Economic integration and the removal of institutional and technological barriers to economic relations are among the main prerequisites of economic progress (Smith Reference Smith1776; Balassa Reference Balassa1961; North and Thomas 1973). Nineteenth-century European industrialization was largely rooted in long-term processes of domestic market integration, and those countries in which integration was delayed fell behind the leading economies. Among the many dimensions of market integration, the integration of the money market performs a crucial role in igniting industrialization by facilitating the consolidation of efficient national systems of payment (Colwell Reference Colwell1860; Bagehot Reference Bagehot1873; Levine Reference Levine1997). Under insufficient money market integration, the scarcity of means of payment for interregional transfers increases transaction costs in the economy. Together with other factors such as high transport costs or chronic political turmoil, a fragmented payment system may represent a serious constraint for the development of national markets, specialization, and structural change.
Historically, the main push to monetary integration came from the political nationalization of payment systems, which accompanied the construction of liberal nation-states during the nineteenth and early twentieth centuries in many countries (Helleiner Reference Helleiner2003). Some of the main elements of national payment systems were the establishment of nationwide issuing banks, paper currencies circulating within the whole national territory, and the expansion of branch banking, together with an intra-national transfer system. These allowed an almost perfect integration of the money market and the reduction of the costs of moving money across each national territory practically to zero. By contrast, before their nationalization, European money markets were defined at a city level. Interregional money transfers were based on commercial finance, that is, on bills of exchange trade between cities (Flandreau et al. Reference Flandreau, Galimard, Jobst and Nogues-Marco2009). Thus, any factors delaying the centralization of country payments might reduce the degree of national monetary integration and provoke situations of shortage of interregional means of payment, substantially increasing, as a consequence, domestic transaction costs in the economy.
This article aims at analyzing the integration of the Spanish money market before the nationalization of the country’s monetary system. In Spain, the Bank of Spain only obtained the national monopoly of banknote issuing in 1874, created a network of provincial branches mainly between 1874 and 1886, established a system of free money transfers between deposits held in different branches in 1883, and introduced national banknotes valid in the whole national territory in 1884 (Castañeda Reference Castañeda2001; Martín-Aceña, Martínez-Ruiz, and Nogues-Marco Reference Martín-Aceña, Martínez-Ruiz and Nogues-Marco2013). Prior to those changes, Spain had a diversity of provincial issuing banks and the circulation of each bank’s notes was restricted to the bank’s location and the surrounding area (Tortella Reference Tortella1973; Sudrià and Blasco-Martel Reference Sudrià Triay and Blasco-Martel2016). As a consequence, before the 1880s Spain kept a traditional city-based monetary system where money transfers between cities were based on the use of bills of exchange.Footnote 1 This article studies to what extent the economic, institutional, and technological changes that took place in Spain between the early nineteenth century and the nationalization of the payment system allowed a better operation of commercial finance and the money market, arguably contributing to the reduction of domestic transaction costs and the increase in liquidity in the economy.
Such analysis is especially relevant for an economy like nineteenth-century Spain, for which insufficient market integration has often been identified as one of the reasons for an extremely slow industrialization process (see, e.g., Fontana Reference Fontana1973). Indeed, the Spanish economy in the early nineteenth century has been described as a mosaic of semi-autarkic regional markets. Leaving aside the complex commercial network organized to supply Madrid’s needs, interregional trade is usually assumed to have been very small, especially between the center and the periphery of the country. This would have been the joint outcome of political instability and rugged geography. Whereas the latter made transport too expensive before the arrival of the railways (Gómez Mendoza Reference Gómez1989; Ringrose Reference Ringrose1972), the succession of civil wars and coups d’état made economic relations rather risky at least until the early 1880s, and might have substantially reduced the government’s ability and available resources to carry out institutional reform. All these factors would have made Spain a case of late market integration, compared with countries such as Britain, the Netherlands, or France (Jacks Reference Jacks2005; Uebele Reference Uebele2013), and would contribute to explain Spanish sustained economic divergence during the nineteenth century (Prados de la Escosura Reference Prados de la Escosura2017). Integration would have only advanced since the late nineteenth century, thanks to institutional development, political stability, and transport infrastructure construction. As summarized by Rosés, Martínez-Galarraga, and Tirado-Fabregat (Reference Rosés, Martínez-Galarraga and Tirado-Fabregat2010, p. 845): “Before the mid-19th century, Spanish regions were relatively independent regional economies. (…) Both market liberalization and transport improvements, particularly the completion of Spain’s railway network, induced the creation of a national market for most important commodities during the second half of the 19th century.” The analysis of the Spanish money market that we present in this article is expected to contribute to a better knowledge of one of the multiple dimensions of such slow process of economic integration.
The degree of integration of city-based money markets can be approached through the analysis of local quotations of bills of exchange. In each city, bills of exchange on other cities were locally traded at a discount or premium, depending on their supply and demand, largely reflecting interregional trade balances, as was often highlighted by nineteenth-century literature (Broussein Reference Broussein1805; Poy Comes Reference Poy Comes1830; Pita Pizarro Reference Pita Pizarro1833; Guillén Suárez Reference Guillén Suárez1846; Castaño Reference Castaño1862).The price at which bills of exchange payable in one city were traded in another city can be considered as the exchange rate between both cities. Given the metallic definition of currencies, exchange rate variations were limited by the costs of moving specie between cities, which defined a fluctuation band for exchange rates according to the specie-point mechanism. The degree of integration of the money market can be approached through the measurement of price convergence (the width of the fluctuation bands, determined by the costs of moving gold or silver) and market efficiency (the speed of adjustment of exchange rates to shocks). In this article, we use daily prices of bills of exchange in ten Spanish cities between 1825 and 1874 to estimate a band-threshold autoregressive (Band-TAR) model, which measures simultaneously convergence and efficiency. This approach has already been used by several authors to measure money market integration, for either the international gold standard or medieval and early modern monetary systems (e.g., Canjels, Prakash-Canjels, and Taylor Reference Canjels, Prakash-Canjels and Taylor2004; Volckart and Wolf Reference Volckart and Wolf2006; Esteves, Reis, and Ferramosca Reference Esteves, Reis and Ferramosca2009; Li Reference Li2015). However, to our knowledge, this is the first time this model has been applied to studying the integration of a domestic money market in late modern times.
Our estimation results provide a mixed picture on the evolution of money market integration in nineteenth-century Spain. There was substantial progress in price convergence during the century, which actually started before the construction of the telegraph and railway networks. However, market efficiency only made progress in some of the inter-city links covered in the analysis, while it stagnated or even decreased in the rest. Interestingly, these different trends of convergence and efficiency in the Spanish money market are consistent with results obtained by Jacks (Reference Jacks2005) for the wheat market in Spain and other European peripheral countries, such as Russia and Norway. Jacks suggests that, while the progress in convergence could be associated to global improvements in commerce, communication, and transport, the evolution of market efficiency rather reflects each country’s level of economic development. More specifically, for the case of the Spanish money market we suggest that the early start in price convergence might be largely explained by government investment in the main road network and the organization of a regular and more efficient postal service. By contrast, efficiency only seems to have clearly improved in certain links, reflecting the significant changes in the Spanish economic geography and monetary leadership that took place during the period.
DATA
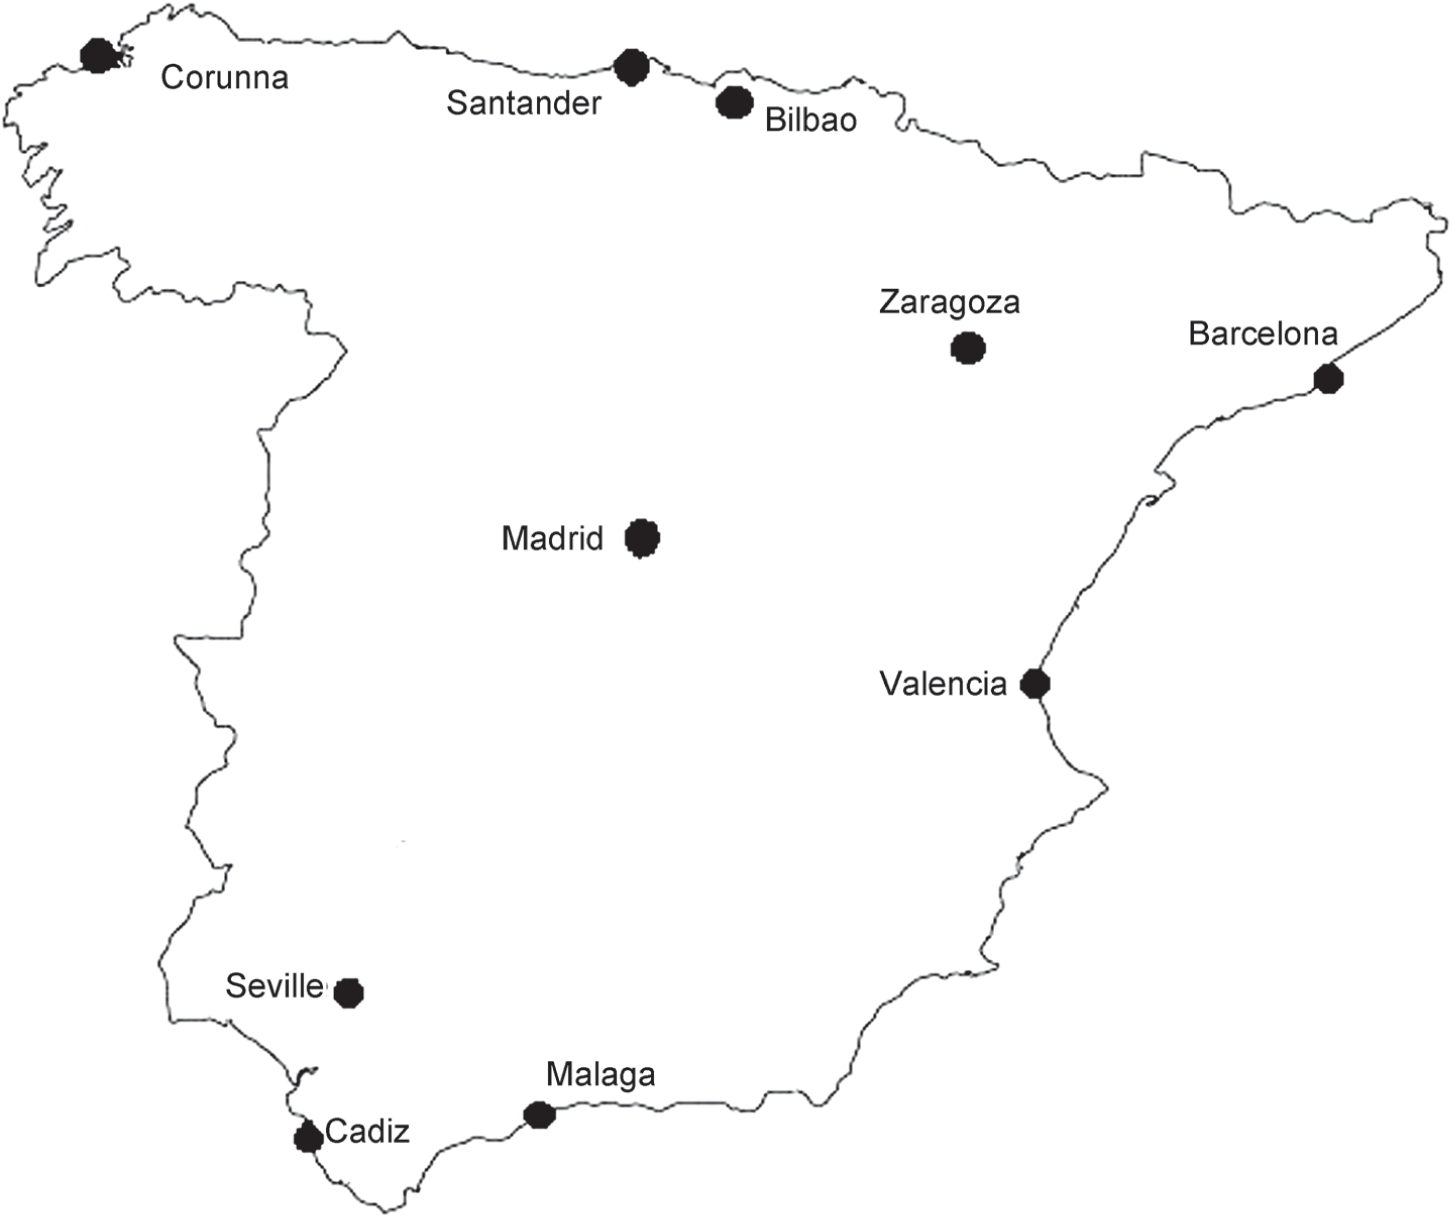
This article focuses on the process of integration of the Spanish money market before its nationalization and the disappearance of locally-based money in 1874–1884. To do this, we have hand-collected a dataset of quasi-daily prices (exchange rates) in Madrid, between 1825 and 1874, of bills of exchange payable in the main commercial and financial centers of the country: Barcelona, Bilbao, Cadiz, Corunna, Malaga, Santander, Seville, Valencia, and Zaragoza. The total number of quotations is 110,623. Figure 1 shows the location of those cities, which are at a distance (by road) between 317 and 648 km from Madrid.Footnote 2 With the exception of Zaragoza, which was an inland town with an active domestic commerce, all other cities were among the most important ports of the country and sustained a significant international trade.
SAMPLE OF CITIES

We start our analysis in 1825, due to data availability,Footnote 3 and end it in the mid-1870s, when the Bank of Spain was granted the note-issuing monopoly in the whole country. Bills of exchange payable in the other nine sample cities had almost-daily quotations in Madrid from the early nineteenth century onwards, which is an indication of their importance in the Spanish money market. We do not consider other cities due to scarcity of data. Secondary centers had a lower degree of liquidity and, therefore, their quotations were not published in the financial press or, when they were, the abundance of gaps prevents the compilation of daily series, especially during the first half of the nineteenth century.Footnote 4 The lack of liquidity that affected most Spanish cities at the beginning of the nineteenth century had already been pointed out by Cabarrús (Reference Cabarrús1813), who was the director of the Bank of San Carlos (the early antecedent of the Bank of Spain) in the last years of the eighteenth century. Incidentally, his words also make clear that Spanish monetary centers were part of a much larger international network of European cities:
“If you have money in Zamora, Badajoz, Granada or Cuenca and want to cash it in Madrid, it will be faster, cheaper and less risky to bring it from Leghorn, London or Amsterdam, because there is no alternative between the hindrance and contingencies of the material cash and transport of the money or the need to wait for months until a bill is available. (…) Assess, from these examples, the condition of our trade: the signs follow the commodities and both trades follow the same push” (p. 160).
We use quotation data in Madrid to build a database of bills of exchange crossed prices (exchange rates) between all possible pairs of cities under consideration.Footnote 5 Prices for those city pairs in which Madrid is one of the two cities of the pair are directly provided by the original sources. For all other city pairs, we can indirectly estimate the exchange rate by combining the quotations in Madrid of bills of exchange payable in the two cities of the pair. For instance, to estimate the price in Barcelona of bills of exchange payable in Cadiz, we multiply the price in Madrid of bills of exchange payable in Cadiz by the inverse of the price in Madrid of bills of exchange payable in Barcelona. We tested the validity of this procedure by comparing a random sample of 2,123 actual prices in Barcelona of bills of exchange payable in the other nine cities between 1825 and 1874, taken from the Diario de Barcelona, with the prices estimated indirectly on the basis of Madrid data.Footnote 6 The correlation coefficient between the direct and indirect prices of bills of exchange in Barcelona is 0.90. This is consistent with nineteenth-century authors stating that the direct and the indirect exchange rates tended to become equal by arbitrage (Castaño Reference Castaño1862, pp. 298–350). In fact, merchants calculated the best price to send a bill from X to Y either directly, or indirectly, by means of the purchase in X of bills upon Z, and by the sale of these bills in Y. In this context, indirect exchanges were also known as “arbitrations of exchange” (Tate Reference Tate1849, p. 87).
Our data, taken from the Gaceta de Madrid and the Official Bulletin of the Madrid Stock Exchange, are prices in Madrid of bills of exchange payable in other towns at eight days sight. Prices were quoted as the percentage of premium or discount on the bills’ face value. In this article we use those daily deviations to estimate changes in the degree of market integration in the Spanish money market in the second and third quarters of the nineteenth century. An integrated market, following Antoine Cournot’s well-known definition, is “an entire territory of which the parts are so united by the relations of unrestricted commerce that prices take the same level throughout with ease and rapidity.”Footnote 7 So, the concept of market integration includes two different dimensions: same prices across territories (price convergence) and non-persistence of asymmetric shocks (market efficiency) (Federico Reference Federico2012, p. 474). We use our database to measure these two dimensions. Since our dataset comprises quasi-daily observations, it allows estimating the convergence and efficiency indicators with the highest possible precision, while avoiding the problem of time aggregation and the subsequent underestimation of market efficiency (Taylor Reference Taylor2001; Federico Reference Federico2012; Brunt and Cannon Reference Brunt and Cannon2014). Figure A1 in the Online Appendix plots the complete series of Madrid prices, which are the empirical basis of our database.
MODEL
Convergence and efficiency are the two essential dimensions of market integration. Price convergence can be defined as a sustained decrease in the price gap between two centers. Price gaps are limited by a band determined by the prevailing transaction costs. As for efficiency, it can be defined as an increase in the speed at which excess price gaps disappear. Therefore, price differentials may be assumed to follow a random walk when they are lower than transaction costs, but to follow an autoregressive process otherwise. This behavior may be captured through threshold autoregressive (TAR)-type models, which allow simultaneous analysis of the convergence and efficiency dimensions of market integration (Jacks Reference Jacks2006). The TAR framework was initially popularized in the literature by Obstfeld and Taylor (1997), who used it to analyze purchasing power parity (PPP), and it has often been applied later on to analyze the money market.
In the case of metallic money, the definition of market integration is based on the concept of specie points (Morgenstern Reference Morgenstern1959; Officer Reference Officer1996; Flandreau Reference Flandreau2004; Nogues-Marco Reference Nogues-Marco2013). Differences in the price of money (bills of exchange) between two locations should be lower than or equal to the costs involved in transporting metal. These costs define a band within which the price of bills of exchange could fluctuate without making profitable the dispatch of metal to the other city. For instance, in the case of the pair composed by Madrid and Barcelona:
 $$(1 - \gamma ){{{P_M}} \over {{P_B}}} \le {e_{MB}} \le (1 + \gamma ){{{P_M}} \over {{P_B}}},$$
where P M represents the official price of gold or silver, expressed in units of account (currency), in Madrid; P B represents the official price of gold or silver in Barcelona; P M /P B is thus the official exchange parity; γ represents the cost of transporting gold or silver between Madrid and Barcelona or between Barcelona and Madrid (we assume that the cost was the same in both directions); and e MB is the market exchange rate between Madrid and Barcelona (price in Madrid of bills of exchange payable in Barcelona or vice versa). When both towns used the same currency, such as in our case, the official exchange rate P M /P B was always 1.
If the market exchange rate remained within the specie-points (defined by transaction costs), there would be no movement of precious metal between Madrid and Barcelona. However, if bills of exchange on Barcelona became expensive enough in Madrid to bring the exchange rate beyond the upper limit of the fluctuation band, agents would transfer metal from Madrid to Barcelona, rather than buying bills payable in Barcelona. Symmetrically, if bills became cheap enough to bring the exchange rate beyond the lower bound, it would be profitable to move metal from Barcelona to Madrid. As a consequence of those specie movements, the demand or supply of bills of exchange would decrease and the market exchange rate would go back to the fluctuation band. After a shock that brought the exchange rate out of the bands, the speed of return to the band depended on the efficiency of the market.
To measure the speed of adjustment (efficiency) and transaction costs (convergence) we apply a flexible Band-TAR model. The Band-TAR model takes the form:
 $$\matrix{
{\Delta x{}_t = \left\{ {\matrix{
{ - \lambda (x{}_{t - 1} - \gamma ) + \varepsilon _t^{out}} & {if{}_{}x{}_{t - 1} > \gamma } \cr
{\varepsilon _t^{in}} & {if\gamma \ge x{}_{t - 1} \ge - \gamma } \cr
{ - \lambda (x{}_{t - 1} + \gamma ) + \varepsilon _t^{out}} & {if - \gamma > x{}_{t - 1}} \cr
} } \right.} & {0 < \lambda < 1} & {\gamma > 0,} \cr
} $$
where x
t
is the percentage deviation of the market exchange rate from the official parity (since the official parity is P
i
/ P
j
= 1, x
t
= [e
t
− 1] × 100), and Δ is the first difference operator. The parameter γ is the threshold that proxies for transaction costs, while λ indicates the speed of adjustment to equilibrium. More specifically, the market exchange rate follows a random walk inside a non-arbitrage band defined by [−γ, γ], within which transaction costs in metal imports/exports prevent arbitrage from correcting the exchange rate disturbances. By contrast, outside the band, arbitrage forces correct any deviations and the market exchange rate has a tendency to move back to the edge of the band, at a speed that depends on λ. The model allows for heteroskedasticity across the different regimes, being
 $\varepsilon _t^{out} \sim N(0,{\sigma ^{(out)2}})$
and
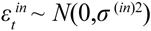 $\varepsilon _t^{in} \sim N(0,{\sigma ^{(in)2}})$
the disturbances outside and inside the band, respectively.
An appealing feature of Band-TAR models relates to their computationally simple estimation procedure. Let the parameters of interest be the vector θ = (λ, σ (out)2, σ (in)2)′ and the threshold value γ. Obstfeld and Taylor (1997) propose an algorithm to estimate the Band-TAR by maximum likelihood (MLE), under the assumption that the errors are Gaussian. Holding γ fixed, the Gaussian log-likelihood is given by:
 $$\eqalign{
& \ln L(\theta |\gamma ) = - \sum\nolimits_t {I[|x{}_{t - 1}| \le \gamma ]{1 \over 2}\left( {\ln (2\pi ) + \ln ({\sigma ^{(in)2}}) + {{{{(\varepsilon _t^{in})}^2}} \over {{\sigma ^{(in)2}}}}} \right)} \cr
& \,\,\,\,\,\,\,\,\,\,\,\,\,\,\,\,\,\,\,\,\,\,\,\, - \sum\nolimits_t {I[|x{}_{t - 1}| > \gamma ]{1 \over 2}\left( {\ln (2\pi ) + \ln ({\sigma ^{(out)2}}) + {{{{(\varepsilon _t^{out})}^2}} \over {{\sigma ^{(out)2}}}}} \right)} \cr}, $$
where I[|x t−1| ≤ γ] and I[|x t−1| > γ] are indicator functions which depend on the position of the (so-called) transition variable x t−1 being inside or outside the band. In practice, we perform OLS regressions for the sub-samples for |x t−1| ≤ γ and |x t−1| > γ, respectively. Once the estimates of θ are obtained, in a second stage, the estimator of γ is given by:
 $$\hat \gamma \equiv \arg \mathop {\max \ln L(\hat \theta |\gamma )}\limits_{\gamma \in [\gamma {}_L,\gamma {}_U]}.$$
This is the value of γ that maximizes Equation (3), where [γ L , γ U] denotes the empirical support of |x t−1|.
As is typical in the threshold literature, the optimization problem presented earlier is solved by a grid search.Footnote 8 More precisely, the grid search algorithm is implemented as in Obstfeld and Taylor (1997). We first find the 5th and 95th percentiles of |x t−1| considering 5 percent trimming.Footnote 9 Then, we implement a grid search with increments of 0.001 over the remaining T*0.90 empirical support of |x t−1|. This estimation algorithm results in a very dense grid search using T*0.90*1000 equally spaced values of γ (e.g., for T=5000, it amounts to 4,500,000 grid points), and guarantees that the values of the indicator functions contain enough sample variation for each choice of γ.Footnote 10
ESTIMATION RESULTS
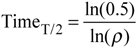
Since we are interested in analyzing the evolution of market integration over time, we perform a rolling window estimation of the Band-TAR model for each pair of cities. In practice, we experimented with different estimation windows and settled with 5,000 observations, as this estimation window gave us more stable results. Since bills of exchange prices are expressed as percentage distance from parity, transaction costs, as captured by the threshold parameter γ, are given as a percentage of the price. In the case of efficiency, we have transformed the speed of adjustment parameter λ into an indicator of the half-life, that is, the number of days that were necessary to reduce the distance of prices to the equilibrium bands by 50 percent.Footnote 11
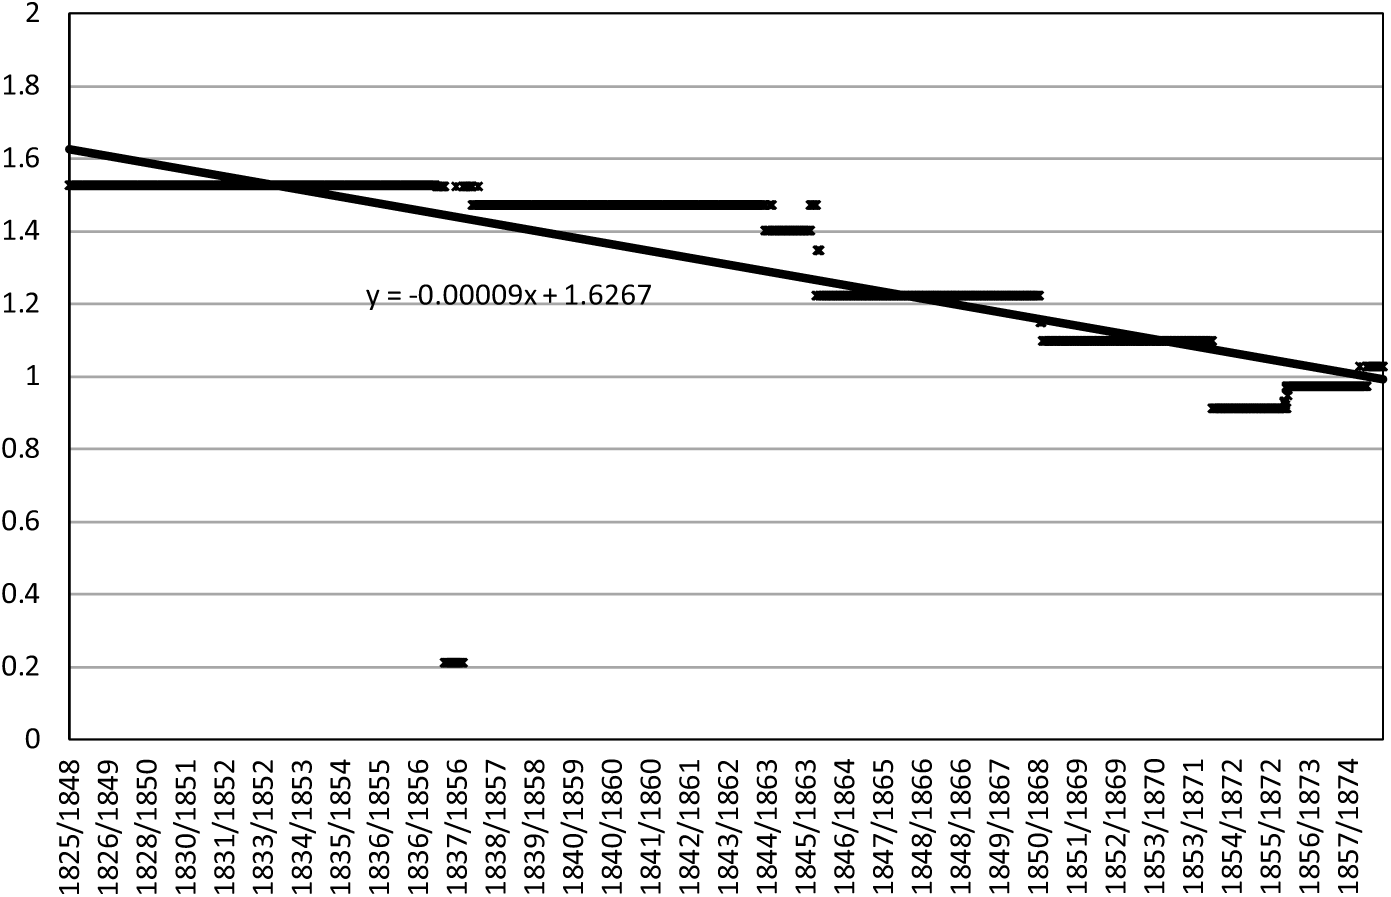
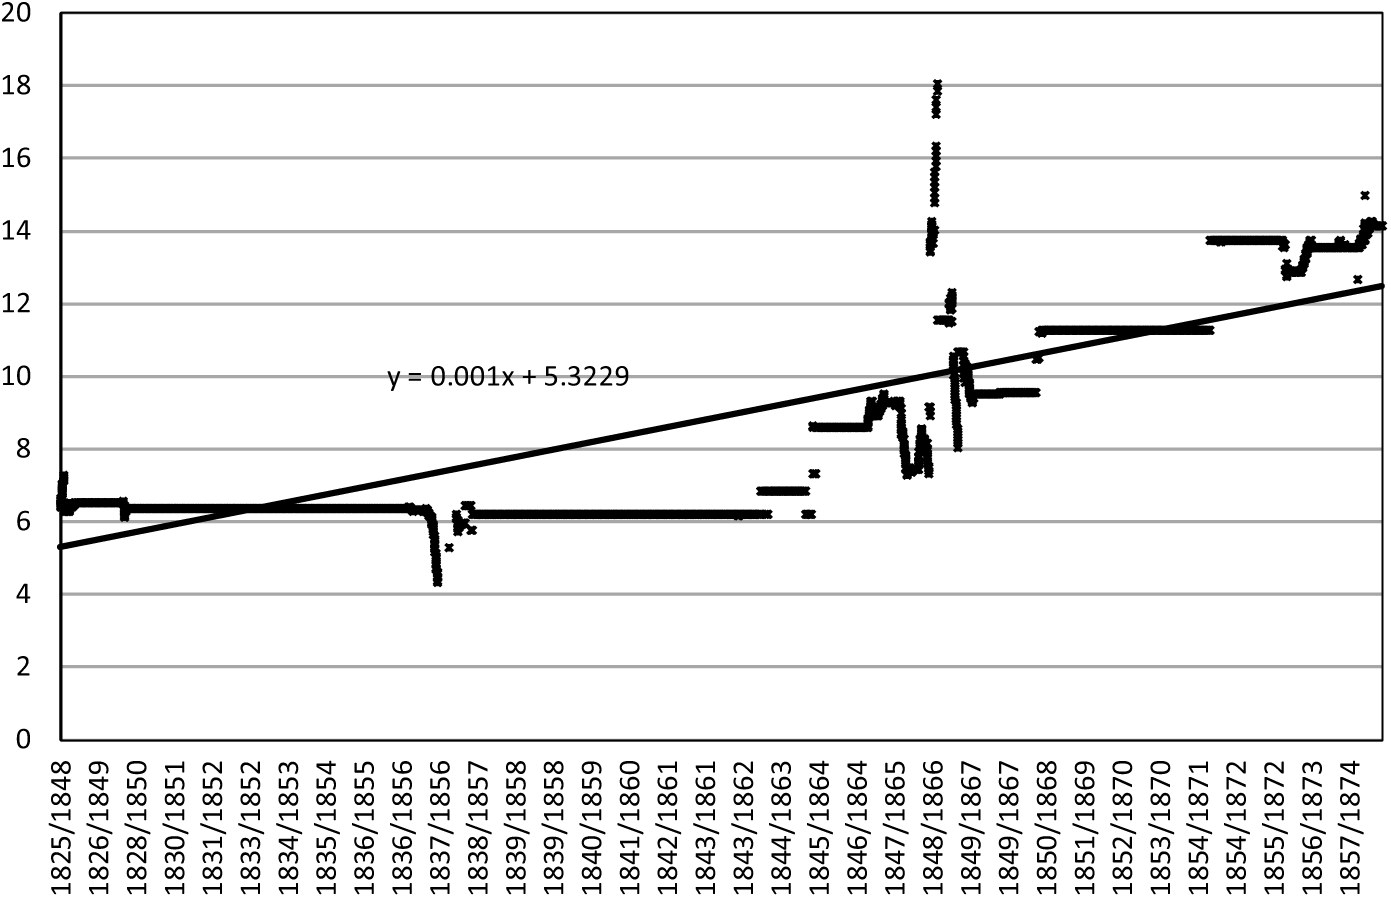
To give an example of the results, Figures 2 and 3 present the rolling window estimates of transaction costs and speed of adjustment of the market for the pair Madrid–Barcelona. Each black point in the figure corresponds to the estimation of the variable of interest (transaction costs or half-life) for a window of 5,000 contiguous daily price observations. After running the model for a window, and obtaining the corresponding estimate, we drop the earliest observation and add a new one, and then we estimate the model again. Thus, Figures 2 and 3 report the estimates for a total of 7,390 rolling windows. The averages of the transaction costs and half-life estimates reported in those figures are 1.3 percent and 8.9 days, respectively.
THE EVOLUTION OF TRANSACTION COSTS (γ) IN THE MONEY MARKET BETWEEN MADRID AND BARCELONA, 1825–1874 (PERCENT)

THE EVOLUTION OF SPEED OF ADJUSTMENT IN THE MONEY MARKET BETWEEN MADRID AND BARCELONA, 1825–1874 (HALF-LIVES, DAYS)

The horizontal axes indicate the initial and final years of the rolling windows. Both figures also include a dotted line reporting the results of an OLS regression line of the series of transaction costs or half-life estimates on a constant and a trend. The negative slope of the dotted line in Figure 2 is a clear indication that transaction costs tended to decrease over time in the route between Madrid and Barcelona. By contrast, the positive trend of the series of estimates reported in Figure 3 reflects the increase over time of the half-lives or, in other words, the gradual decrease in the efficiency of the market and its speed of adjustment to shocks. Thus, in the specific example of the route between Madrid and Barcelona, convergence and efficiency evolved in opposite directions.Footnote 12
We have run similar analyses to those reported in Figures 2 and 3 for all possible city pairs in the sample (45). The overall average of the transaction costs estimates (γ) across all windows and city pairs is 0.9 percent, although individual city-pair averages varied from 0.4 percent (between Cadiz and Seville, two cities located in close vicinity) to 1.4 percent (Madrid–Cadiz and Madrid–Seville). These figures are not far from the direct transaction cost data that are available in contemporary sources for the latest years of the period. For instance, railway rates of transport of money and securities between Madrid and the nine cities of the sample ranged from 0.2 to 0.4 percent of the declared value in 1867 (Compañía de los Ferro-Carriles de Madrid a Zaragoza y Alicante 1867, p. 14), and a study included in the reports of the Spanish Monetary Advisory Board estimated that the total cost of transporting metal from Santander to Madrid amounted to 0.3 percent in 1877.Footnote 13 These transport costs should be increased by the fee of the brokerage of the bill trade associated to the movement of metal, which amounted to 0.2 percent (half paid by the seller and the other half paid by the buyer, see the Decreto Orgánico de la Bolsa de Madrid 08/02/1854, article 77, and Castaño Reference Castaño1862, p. 108), and the tax (timbre), which was 0.05 percent (Real Decreto sobre papel sellado 08/08/1851, article 35; Castaño Reference Castaño1862, p. 95). Additionally, when the operation was conducted by an intermediary (merchant-banker), there was an additional commission fee of ca. 0.25 percent. The final cost was between 0.45 and 0.95 percent, which is slightly lower but not very different from our average estimates of 0.4 to 1.4 percent. The difference can likely be explained by the fact that the first rolling windows for each pair of cities include estimation periods in which the railways were not yet in operation.
The estimated percentages are also higher but not very far away from the direct estimates of transaction costs for international money flows between the main world financial centers during the Classical Gold Standard, as reported by Officer (Reference Officer1989, table 1), which range from 0.62 to 0.69 percent. They are also in line with Canjels, Prakash-Canjels, and Taylor’s (Reference Canjels, Prakash-Canjels and Taylor2004, p. 876) figure of ±0.67 percent for money flows between London and New York in 1879–1913, obtained by applying a similar model to ours. Finally, and not surprisingly, they are much lower than figures estimated for sixteenth-century Spain, for money flows between Seville and Medina del Campo, which were as high as 6 percent (Bernholz and Kugler Reference Bernholz and Kugler2011).
In the case of half-lives, the average estimate over all rolling windows and across all city pairs was 9.6 days, although the individual city-pair averages varied widely, ranging from a minimum of 3 days (again between Cadiz and Seville) to a maximum of 48 days between Madrid and Zaragoza or, if we set aside this anomalous value,Footnote 14 18 days between Madrid and Malaga or 17 days between Barcelona and Corunna. Out of the 45 city-pair averages, in 37 (in other words, 82 percent of the total) the estimates go from 4 to 10 days, which are in line with the 6 days half-life estimated for flows between London and New York during the classical gold standard (Canjels, Prakash-Canjels, and Taylor Reference Canjels, Prakash-Canjels and Taylor2004, p. 876).
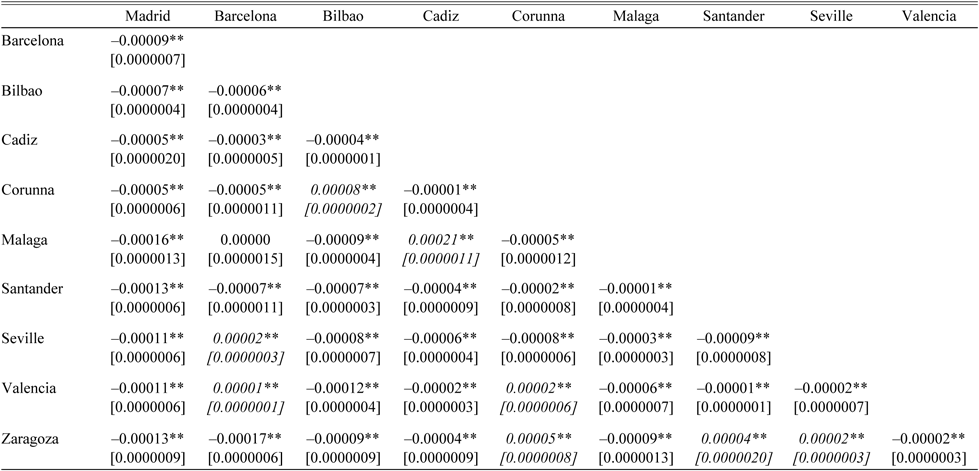
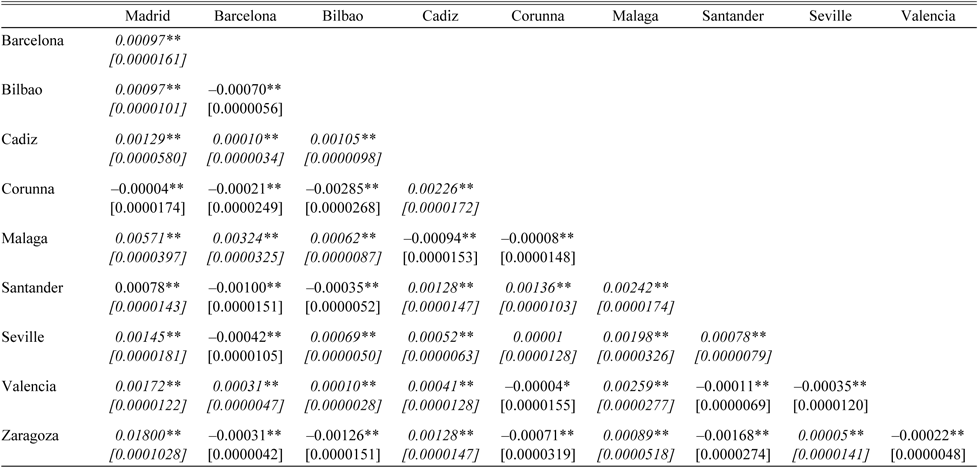
As in Figures 2 and 3, we have also carried out, for each city pair, an OLS regression of the series of transaction costs and half-life estimates across all rolling windows on a constant and a time trend. Tables 1 and 2 present the coefficients of the time trend in each regression, which allow observing the evolution of transaction costs and market efficiency over time in each pair of cities. We also report the bootstrapped standard errors of those coefficients in order to test if they were statistically significant. The coefficient of the γ series in Table 1 show that, over time, transaction costs tended to decrease for most city pairs (37 out of 45), showing therefore a gradual process of price convergence in the Spanish money market during the period under study. By contrast, in the case of market efficiency, the estimates show that half-lives did not decrease, but tended instead to increase (indicating a worsening in market efficiency) in 27 out of 45 cases, or 60 percent of the total. In other words, the speed of adjustment of the Spanish money market tended to decrease during the nineteenth century in more than half of the city links of the sample. Only in 11 city pairs did transaction costs and half-lives decrease over time, while in most cases (56 percent of the links) they evolved in opposite directions, with half-lives increasing and transaction costs decreasing. The Spanish money market provides therefore an interesting case of striking heterogeneity between different links and a wide diversity in the behavior of price convergence and efficiency. The next section suggests some potential explanations for these results.
TIME TREND COEFFICIENTS OF TRANSACTION COSTS (γ) ESTIMATES IN THE SPANISH MONEY MARKET (1825–1874)

* = Significant at the 5 percent level.
** = Significant at the 1 percent level.
Notes: Bootstrapped standard errors in brackets; positive trend in italics. See Nogues-Marco, Herranz-Loncán, and Aslanidis (Reference Nogues-Marco, Herranz-Loncán and Aslanidis2019).
Source: Authors’ elaboration (see text).
DISCUSSION
The Decrease in Transaction Costs
With only a few exceptions, our estimates show a generalized decrease in transaction costs in the Spanish money market during the period under study. The Spanish historiography has often associated the reduction in transaction costs and progress in market integration to the construction of the telegraph and railway systems (see, e.g., Gómez Mendoza Reference Gómez1989; Bahamonde Magro Reference Bahamonde Magro1993; Rosés, Martínez-Galarraga, and Tirado-Fabregat Reference Rosés, Martínez-Galarraga and Tirado-Fabregat2010). However, in the case of the money market, price convergence seems to have started well before the establishment of railway and telegraph links between each pair of cities. In order to exclude the impact of those new technologies on price convergence, we have calculated the time trend coefficient of the series of γ estimates for each city pair including only those rolling windows whose end date is earlier than the establishment of a telegraph link or a railway link between both cities of the pair.Footnote 15 In most city pairs (73 percent in the case of the telegraph and 86 percent in the case of the railways) the trend of γ was already negative and significant (at the 1 percent level) before the construction of the new transport and communication infrastructure. What is more interesting, for those cases in which the overall trend was already negative in the earliest period, it was often steeper before than after the completion of the railway or the telegraph links. That happened in 63 percent of those city pairs in the case of the railway and in 53 percent in the case of the telegraph, indicating therefore that in those links the reduction of transaction costs actually slowed down after the arrival of these new technologies.
Such an early start of the process of price convergence seems puzzling in a country without previous cheap transport and communication alternatives, such as waterways. However, a potential explanation is the gradual improvement in road infrastructure and in the organization of high-speed inland transport that took place before the arrival of the railways. These changes probably had a significant effect on the cost of transport of money, as happened with other high-value commodities, wealthy passengers, and information.
Progress in European high-speed transport during the early decades of the nineteenth century has been analyzed by Kaukiainen (Reference Kaukiainen2001). Focusing on the speed of information, he estimates that dispatch times in the 1850s were on average approximately a third of their level around 1820. This means that, on most routes, the decrease in the number of days that information took to move was higher between those two dates than afterwards, with the introduction of the telegraph. To a large extent, those early gains were the result of the first steamships and other advances in water transport technology and infrastructure. However, Kaukiainen also observes a significant increase in the speed of overland information transmission in several European economies. While, by 1820, only in Britain, northern France and, maybe, the Low Countries and parts of Germany was overland transport able to regularly cover more than 100 km in one day, by 1840 this figure had increased to 200 km on many routes outside those areas, such as the roads to and from Danzig, Marseille, or Trieste. There seem to have been also significant advances in other, more peripheral, areas, such as Odessa and Constantinople. Such widespread progress would be explained by better quality and higher density road networks, better carriages, and improvements in the organization of coach lines (Kaukiainen Reference Kaukiainen2001, pp. 11–13).
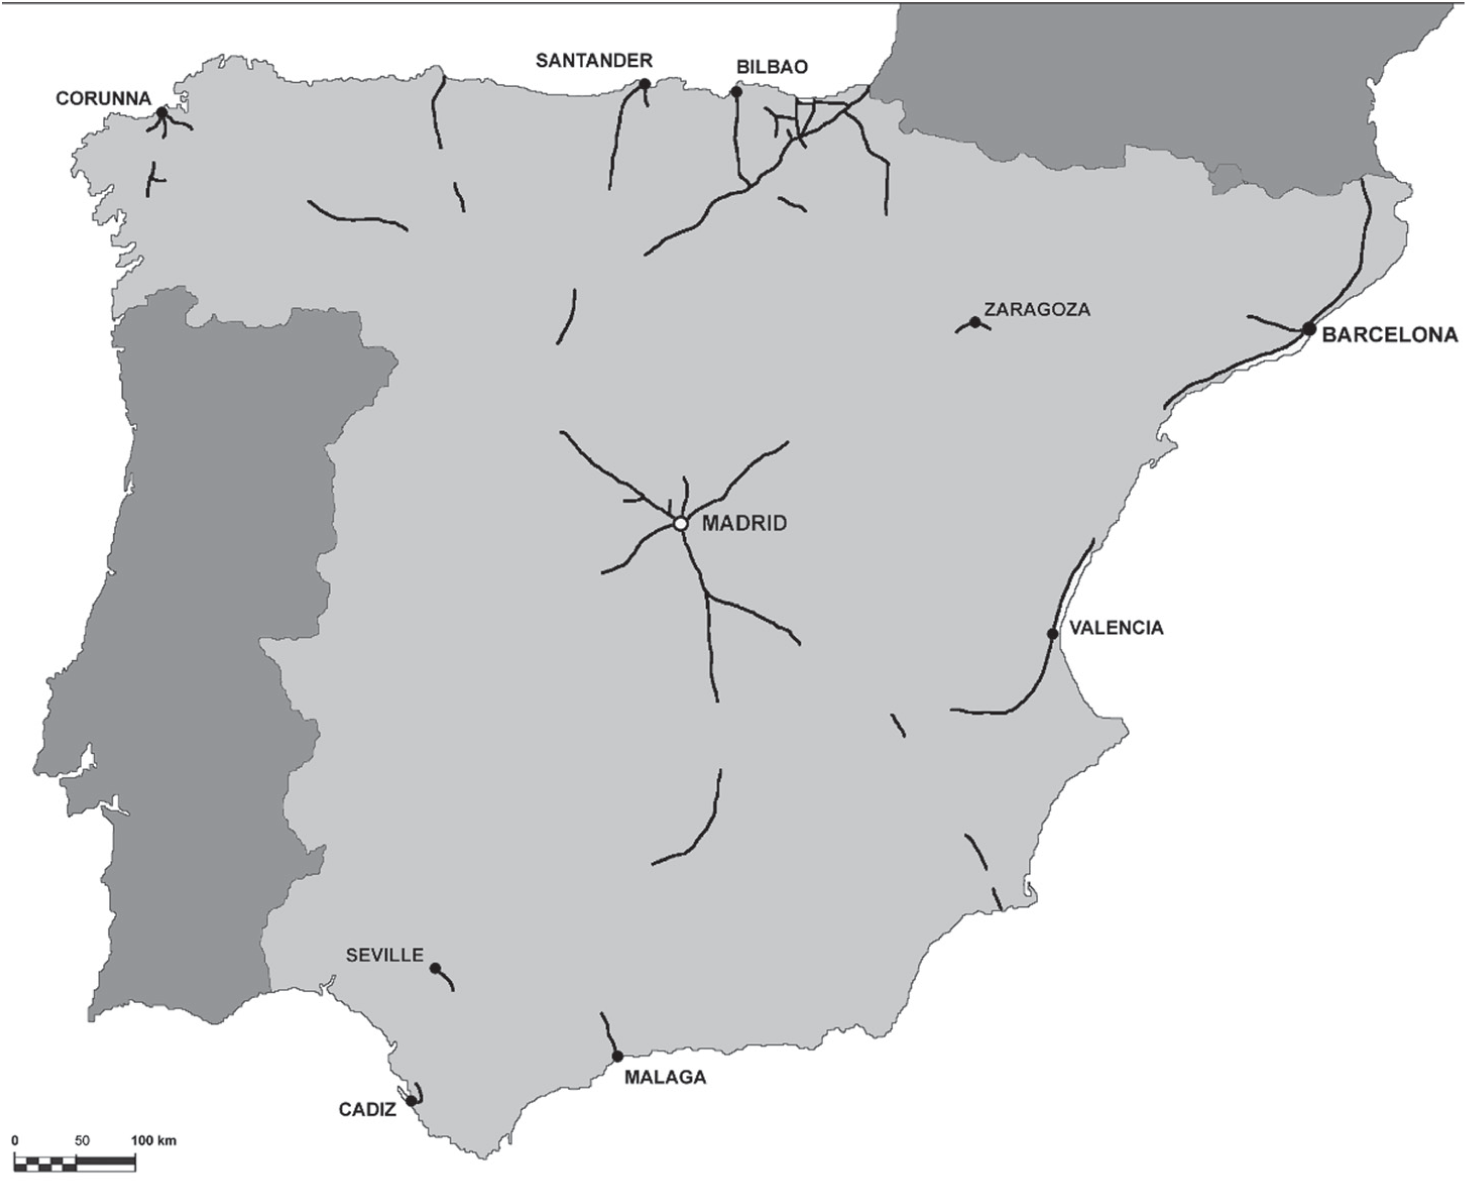
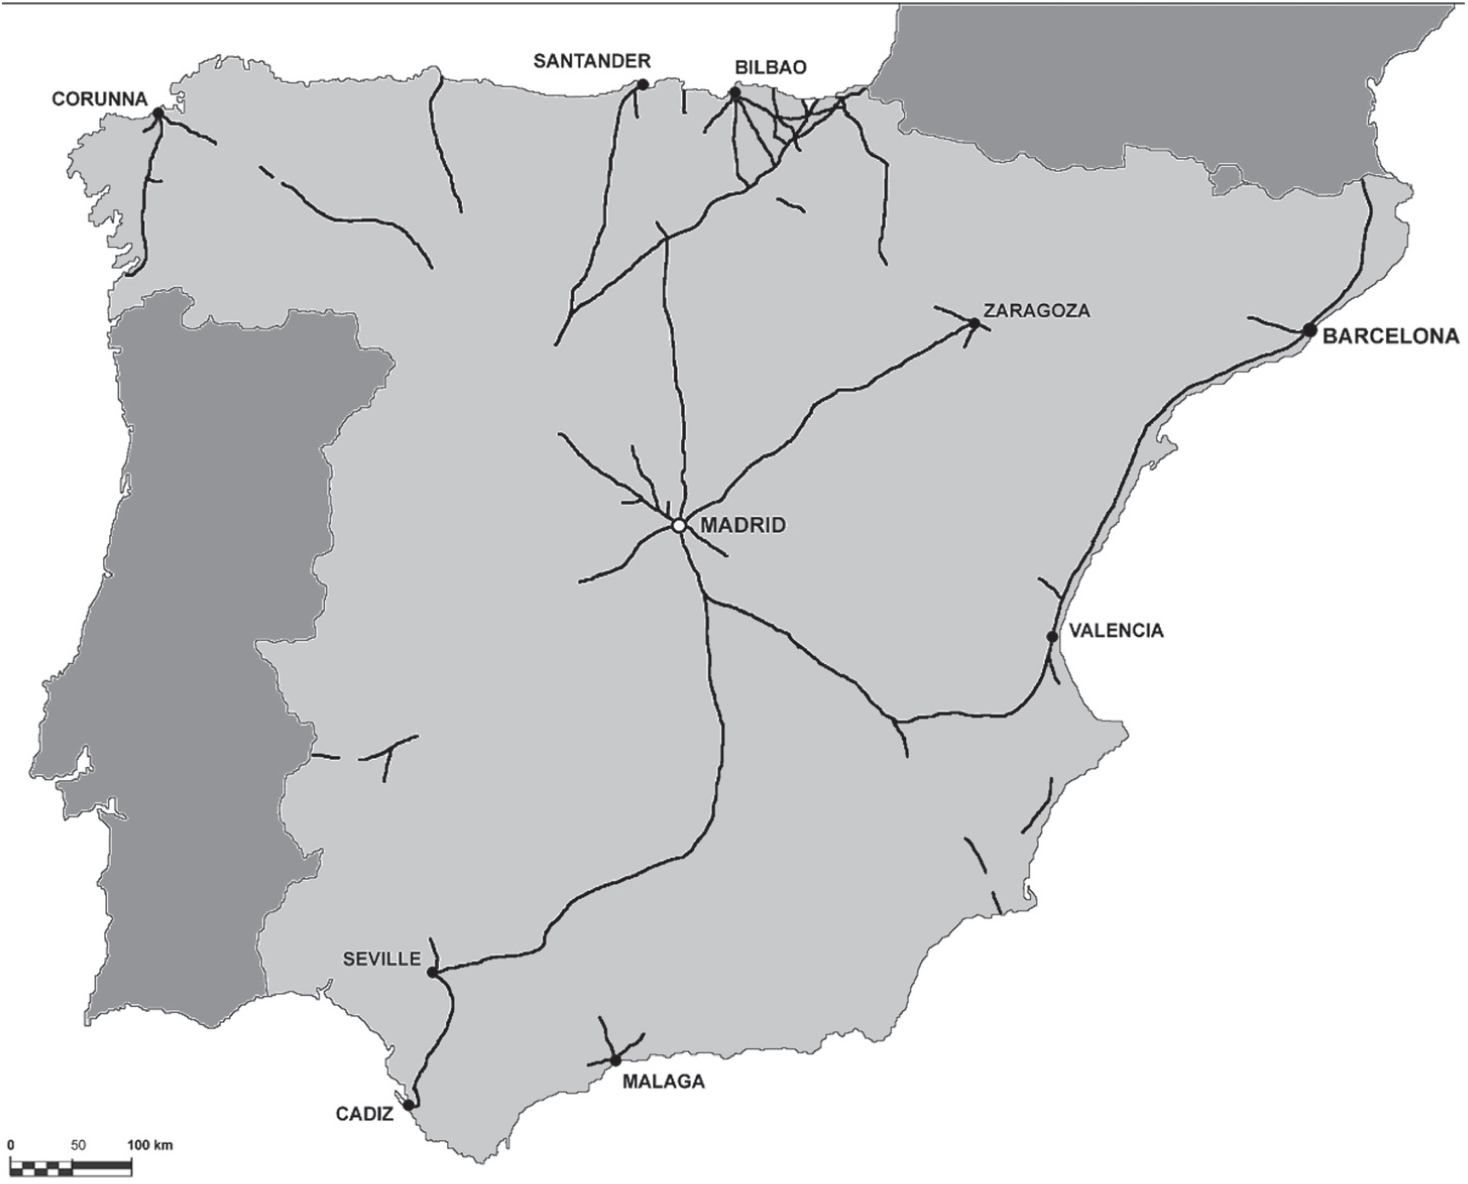
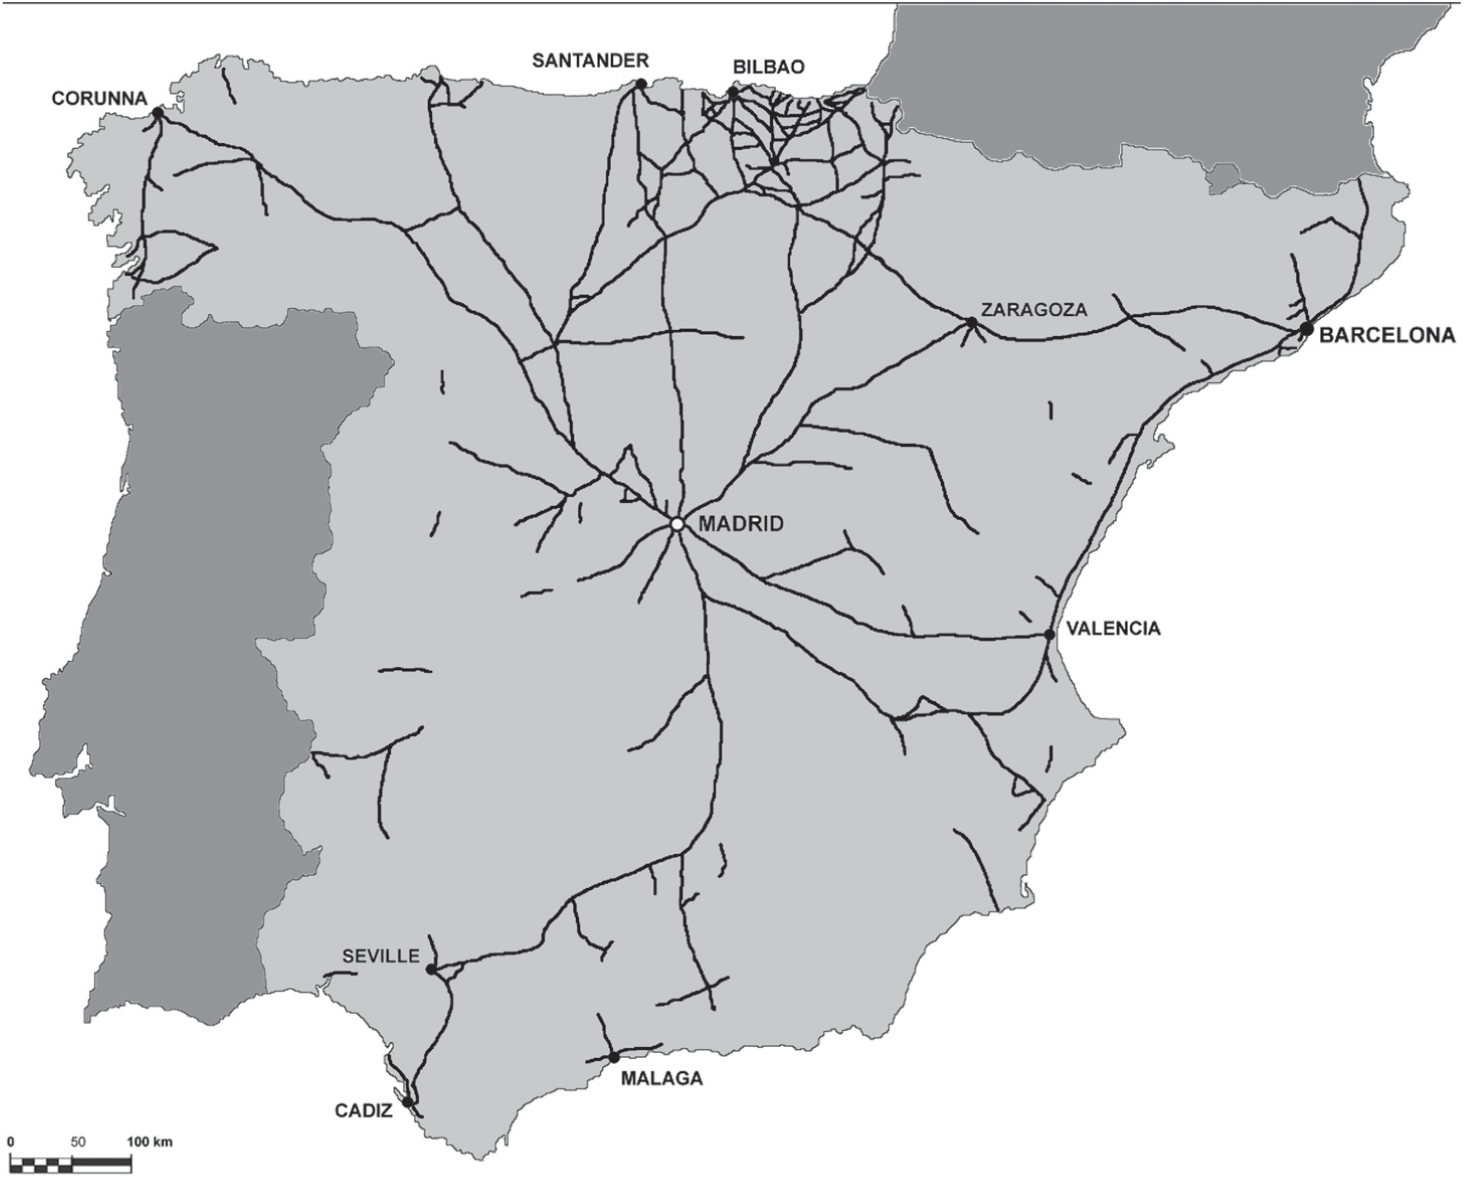
Similar advances took place in Spain before the arrival of the telegraph and railways and this may explain the early steps in the integration of the money market. Figures 4 to 6, taken from Madrazo (Reference Madrazo1984), show the Spanish road network in 1808, 1840, and 1855. Investment in the network, which was very low until Ferdinand VII’s death (1833), grew substantially thereafter. Between the end of the Napoleonic Wars and 1833 the government only invested 7.2 million reales per year. The length of the road system in 1833 was just 4,564 km, and the network consisted of a system of largely unfinished radial trunk routes centered in Madrid, partly inherited from the eighteenth century. Investment increased to 8.3 million per year in 1834–1840, 11.5 million in 1841–1846, and 45.5 million in 1847–1855 and, as a result, by 1855 the network length was 8,324 km (Uriol Salcedo Reference Uriol Salcedo1992, pp. 223–25) and the main cities of the country (including those analyzed in this article) were already connected with Madrid by good quality roads (see Figure 6), able to carry wheeled traffic at high speed without disruptions.Footnote 16
The Spanish road network, 1808

THE SPANISH ROAD NETWORK, 1840

THE SPANISH ROAD NETWORK, 1855

There was also substantial progress in the organization of high-speed inland passenger transport and postal services before the 1850s, which were essential from the perspective of the money market operation. The increasing reliability, safety, and speed of Spanish domestic passenger transport were perceived at the time as revolutionary (Madrazo Reference Madrazo1984, p. 420). Organized stagecoach transport of passengers started in 1816, with regular connections between Barcelona, Valencia, and Madrid, and it significantly expanded in the 1820s.Footnote 17 The frequency of postal services increased accordingly because, from 1820 onwards, many licenses of passenger services included the obligation to transport mail twice a week. Passenger services stagnated during the 1830s due to the Carlist War, but expanded again in the early 1840s, with a fast increase in their frequency and territorial coverage. In many routes, these services included the obligation to distribute mail three times a week. Finally, in 1844, the government decided to restore and reorganize the public postal service, establishing the daily distribution of correspondence in an increasing number of cities (Madrazo Reference Madrazo1984; Bahamonde Magro Reference Bahamonde Magro1993).
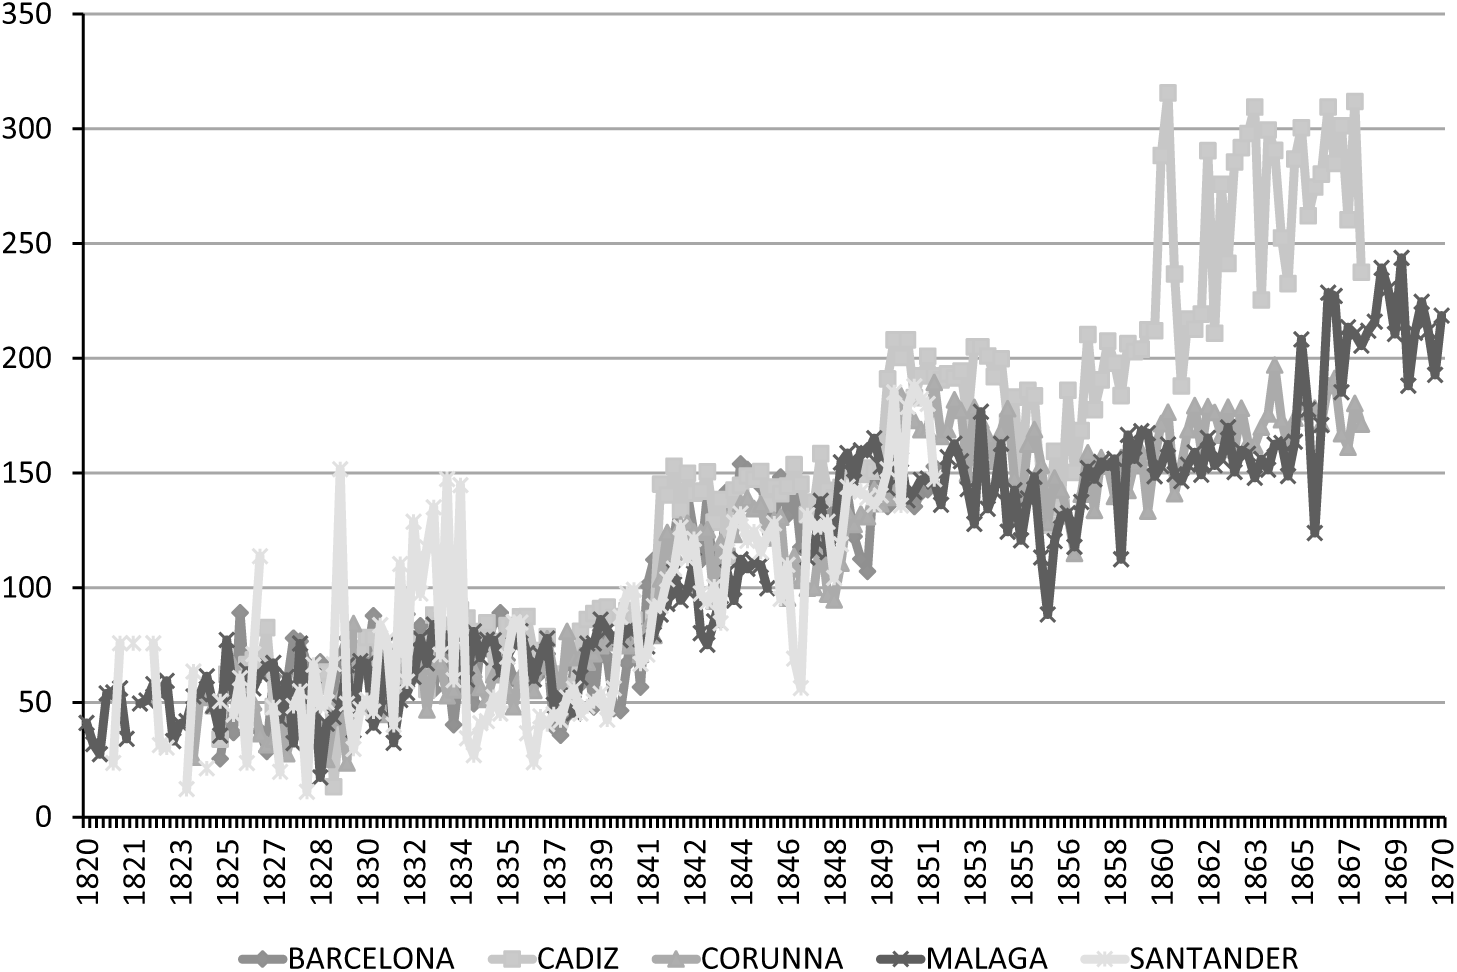
Following Kaukiainen (Reference Kaukiainen2001), we approach the effects of infrastructure and organization improvements on transaction costs by looking at the speed at which information traveled, for two reasons. First, travel speed is an indication of the quality of infrastructure and transportation services, which largely determine transport costs. Second, in the case of high-value commodity, the speed and regularity of trips could have been as relevant as transport fares to determine transaction costs, through higher safety and certainty, and savings in travel time and the associated costs (wages, insurance, etc.). To illustrate this issue, Figure 7 presents changes over time in the speed of information transmission, based on a hand-collected dataset of the number of days elapsed between the registered dispatch and reception of the correspondence that the agents of the Bank of Spain (or its antecedent, the Bank of San Fernando) sent to the bank headquarters in Madrid. We show data for agents based in Barcelona, Cadiz, Corunna, Malaga, and Santander, which are the cities for which correspondence has been preserved.
SPEED OF TRANSMISSION OF INFORMATION TO MADRID (KM. PER DAY, THREE-MONTH AVERAGES)

The figure shows a sustained increase over time in the speed of information transmission. Such increase was especially high in the 1840s, with two significant boosts at the beginning and at the end of the decade.Footnote 18 The synchronization of the evolution of speed among cities until 1850 is impressive, which indicates that improvements in information transmission were the result of nation-wide processes, such as road investment and the reorganization of postal services in the 1840s. In the mid-1850s, when telegraph was introduced and right before the construction of the railway network, correspondence between these five cities and Madrid was transported at a speed between 150 and 200 km per day, which would be quite a respectable figure in comparative terms, according to Kaukiainen (Reference Kaukiainen2001). In other words, by the mid-nineteenth century the efficiency of Spanish high-speed road transport was not far away from the best continental standards. In the 1860s, the railways allowed an additional increase in the speed of the postal service, which fluctuated around 220 km per day, and approached 300 in the case of Cadiz. A speed of 150 to 200 km per day meant that, by 1850, letters sent from these cities would arrive at the Bank headquarters in 3 to 4 days. This was a very short time, compared with the average 13 days that the mail took in the late 1820s. In other words, changes in the road network and in the postal service had reduced the number of days that the letters took to cross the country by 70 percent. In that context, the impact of the telegraph on information speed, or the effect of the railways on high-speed overland transport time, was relatively small compared with the number of days gained since the early 1820s.
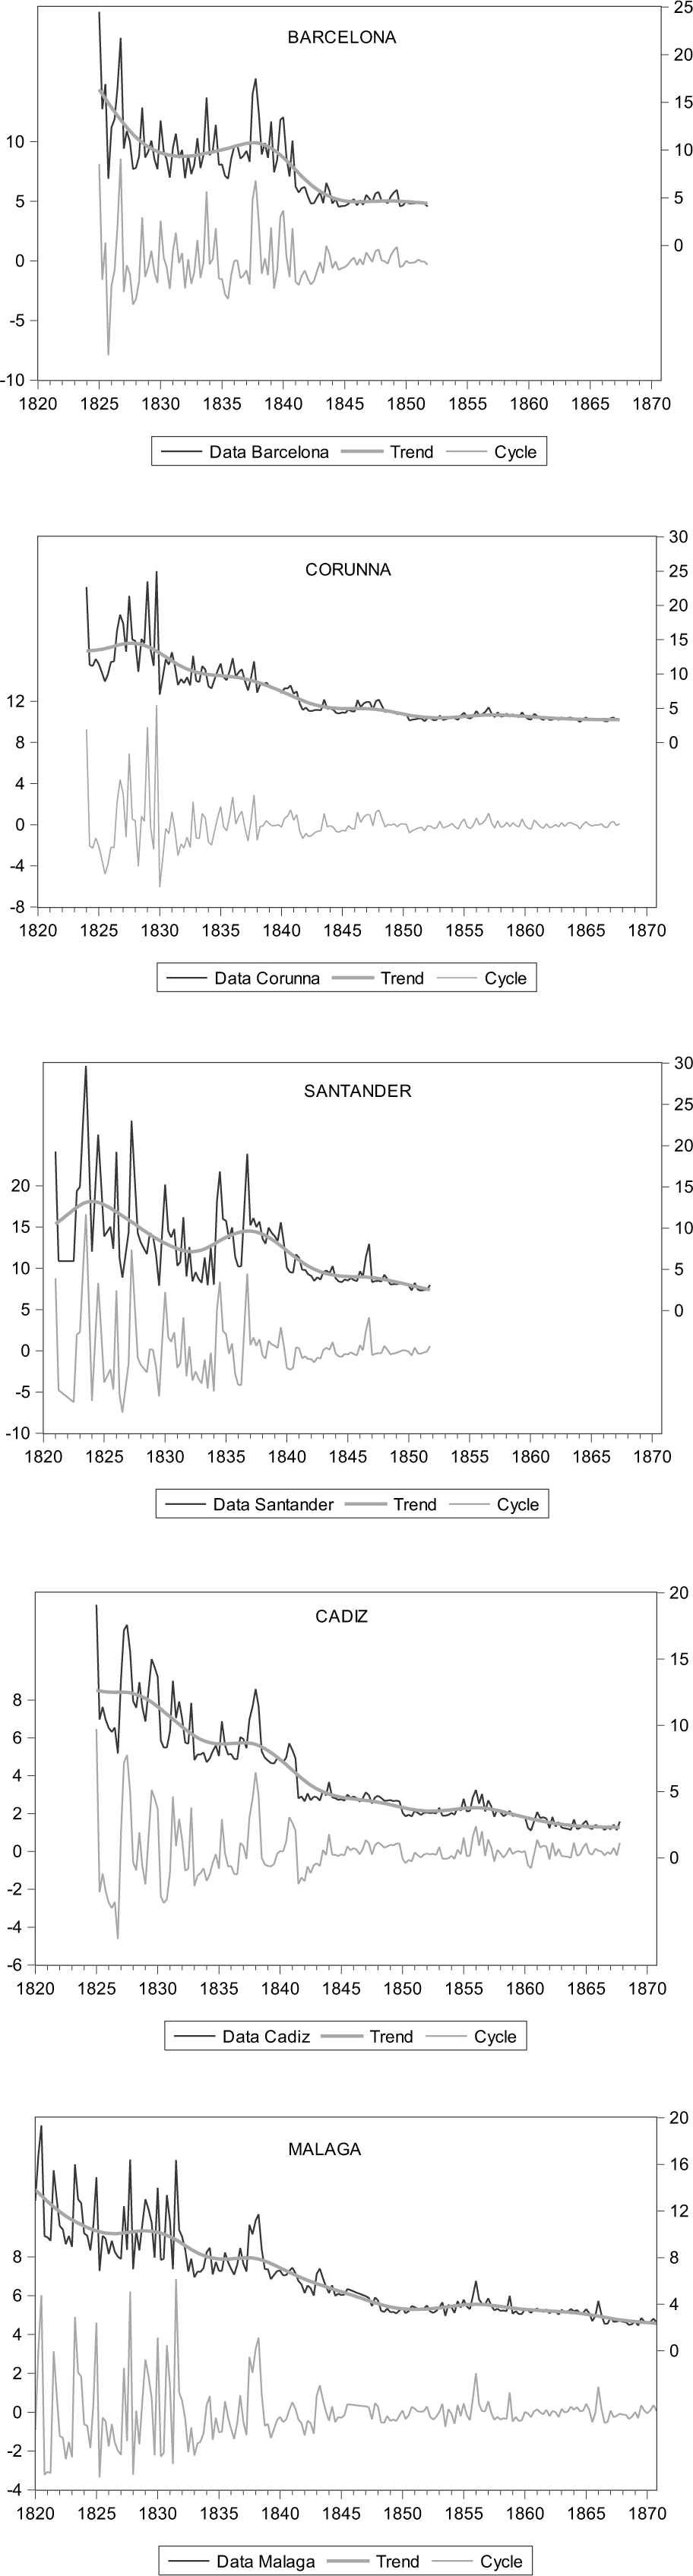
The speed increase associated to early improvements in road transport was accompanied by a significant decrease in speed volatility. This can be seen in Figure 8, which shows the trend and fluctuations of the number of days that correspondence took to arrive from each city to the Bank of Spain headquarters in Madrid. The trend and the cyclical component of each series have been isolated through the application of a Hodrik–Prescott filter. The decrease in volatility in the 1830s or 1840s (depending on the city) is impressive and reflects the improvement in the system of high-speed inland transport. To sum up, from the 1830s or 1840s onwards, agents in each Spanish city could expect to receive information and high-value commodities from other cities with considerable regularity and at a comparatively high speed.
LONG-TERM TRENDS AND FLUCTUATIONS OF THE SPEED OF INFORMATION TRANSMISSION TO MADRID

The decrease in travel times was accompanied by other essential improvements, such as price reduction and increased safety. According to Madrazo (Reference Madrazo1991, p. 167) stagecoach passenger rates decreased by 57 percent between 1822 and 1854. This was important from the viewpoint of money transport, which usually was not dispatched, but carried by merchants or other agents, including in some cases security guards. And, especially since the 1840s and the deployment of the Civil Guard across rural Spain, banditry activity, which had been endemic some decades ago, was substantially reduced (Madrazo Reference Madrazo1991, pp. 221–38). All these changes involved substantial savings and increasing certainty in Spanish overland transport. Although we cannot demonstrate causality, these improvements are likely to be among the main explanatory forces of the reduction in transaction costs that took place in the money market at the same time.
The Heterogeneous Behavior of Efficiency in the Spanish Money Market
The decrease in transaction costs in the Spanish money market did not always go hand-in-hand with an improvement in efficiency. Indeed, Table 2 shows that in 60 percent of the city pairs the speed of adjustment in the market tended to decrease. Such a reduction in efficiency contrasts with the widespread progress in price convergence. Strikingly, in 25 out of 45 city pairs there was simultaneously a decrease in transaction costs and a worsening in market efficiency.
TIME TREND COEFFICIENTS OF HALF-LIFE ESTIMATES IN THE SPANISH MONEY MARKET (1825–1874)

* = Significant at the 5 percent level.
** = Significant at the 1 percent level.
Notes: Bootstrapped standard errors in brackets; positive trend in italics. See Nogues-Marco, Herranz-Loncán, and Aslanidis (Reference Nogues-Marco, Herranz-Loncán and Aslanidis2019).
Source: Authors’ elaboration (see text).
A coincidence of price convergence with a decrease in efficiency was also documented by Jacks (Reference Jacks2005) for nineteenth-century wheat market integration in several countries. Jacks observed that market convergence and efficiency followed opposing trends in Spain, Russia, and Norway, but not in other European countries, during the nineteenth and early twentieth century. He explained such an apparent paradox by suggesting that progress in convergence could be associated to global improvements in commerce, communication, and transport. By contrast, improvements in market efficiency might have been hindered by these countries’ low level of economic development. Jacks’ (Reference Jacks2005) interpretation might also be applicable to the case of the Spanish money market. In the previous subsection we suggested that the progress in Spain’s transport system over the nineteenth century, which started well before the construction of the railway and telegraph networks, was probably one of the main explanatory factors for price convergence. By contrast, in this section we argue that the heterogeneous evolution of market efficiency across city pairs was most likely associated with differences in economic dynamism across cities, and the resulting changes in monetary leadership.
Several authors have argued that monetary leadership, which is associated in each economy to general acceptance and the highest liquidity levels, is largely related to economic size (Kindleberger Reference Kindleberger1967; Krugman Reference Krugman, John and Richard1984; Hartmann Reference Hartmann1998; Flandreau and Jobst Reference Flandreau and Jobst2009; Eichengreen, Mehl, and Chitu Reference Eichengreen, Mehl and Chitu2017). Historically, there have been cases of monetary leadership shared among several centers, such as Amsterdam, London, and Paris in mid-eighteenth-century Europe (Flandreau et al. Reference Flandreau, Galimard, Jobst and Nogues-Marco2009) or the U.K. sterling pound and the U.S. dollar as the world leader currencies in the interwar period (Eichengreen and Flandreau Reference Eichengreen and Flandreau2009). There have also been cases of a single dominant money center, such as New York within the U.S. payment system at the end of the nineteenth century (James and Weiman 2010) or the U.S. dollar as the world leader currency in the second half of the twentieth century (Eichengreen Reference Eichengreen2011). In the case of nineteenth-century Spain, we argue that the heterogeneous behavior of money market efficiency across city links captures a shift in monetary leadership, which would be largely explained by the gradual change in the economic geography of the country. Structural change and industrialization gradually transformed the spatial distribution of the Spanish economic activity, and may have had significant effects on liquidity and money market efficiency. As a consequence, the monetary leadership structure inherited from the Ancient Régime, centered around Madrid and Cadiz, was gradually weakened, giving way to a new set of emerging monetary centers.
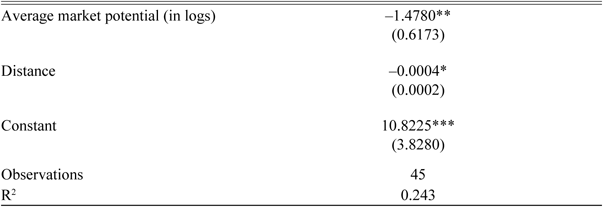
Changes in a country’s economic geography can be approached through market potential estimates. These not only reflect the economic size of each city’s province, but also the level of economic activity in the closer territories, weighted by distance. Thus, for each city they provide an approximation to both economic size and centrality. Martínez-Galarraga (Reference Martínez-Galarraga2014) presents estimates of market potential for the Spanish provinces in 1867. Since these are the only available indicators for our time period, we focus on the comparison between money market efficiency and market potential for the latest part of the sample, using average half-life estimates from the latest 50 percent of the rolling windows. In Table 3, we report the results of an OLS regression of the average half-life of each city pair on both cities’ average market potential in 1867 and the overland distance between them. Our main result is that money market efficiency was higher for those city pairs that were closer and had a higher average market potential.
DETERMINANTS OF MONEY MARKET EFFICIENCY (HALF-LIVES, IN LOGS)

* = Significant at the 10 percent level.
** = Significant at the 5 percent level.
*** = Significant at the 1 percent level.
Notes: Bootstrapped standard errors in brackets.
Source: Authors’ elaboration (see text).
Looking at individual cases it is possible to draw some additional conclusions on the efficiency differences across cities and market links. As may be observed from Table 2, there are four cities where most market links clearly tended to lose efficiency over time: Cadiz, Madrid, Malaga, and Seville, that is, the Spanish capital and the three Andalusian ports in the sample. By contrast, except for three cases, market efficiency tended to grow in all links between the other six cities, namely, Barcelona, Bilbao, Corunna, Santander, Valencia, and Zaragoza. The increase in integration was especially clear in the city pairs composed by the four centers located in the Northeast of the country (Barcelona, Bilbao, Santander, and Zaragoza), among which half-lives decreased over time with no exception, while Valencia and Corunna were intermediate cases, where efficiency increased in some links but decreased in others.
The evidence presented so far establishes a stark differentiation between cities in the Northeast of the country and those in the center/South. The former included Barcelona, Bilbao, and Santander, three of the most dynamic ports of the country, which complemented their flourishing domestic and international trade with industrial growth. A remarkable example is Barcelona, a province that accounted for 18 percent of the Spanish industrial value added by 1870 (Díez-Minguela, Martinez-Galarraga, and Tirado-Fabregat Reference Díez-Minguela, Martinez-Galarraga and Daniel2016). Zaragoza, although being a much less dynamic center during the nineteenth century, had increasingly closer economic relations with Barcelona, to the extent that it could be considered as part of the latter’s hinterland by the late nineteenth century. Together, the four cities formed a dynamic urban system with high and arguably increasing market potential, thanks to the proximity among them and to the European markets. By contrast, Madrid and the three Andalusian cities had the worst record in terms of money market efficiency. Historians have usually stressed the relative decline of the Andalusian economy and, especially, Cadiz and Seville, during the nineteenth century, once they lost their role as the main centers of colonial trade. For instance, until the 1820s Cadiz concentrated 70 percent of the Spanish foreign trade; however, this share had decreased to 17 percent in the mid-nineteenth century (Martín Rodríguez Reference Martín Rodríguez, Nadal and Carreras1990, p. 347). Madrid, despite its demographic dynamism, did not industrialize during the nineteenth century and the expansion of its trade activity was constrained by its location in the center of the Peninsula and the absence of a water transportation system to supply the city.
While the scarcity of statistical information for the period before 1860 prevents us from comparing the dynamics of those two groups of cities during the whole period under study, their economic trends after 1860 were clearly divergent. The GDP of the provinces of the four Northeastern cities, which accounted for 12 percent of Spanish GDP in 1860, increased their share to 15 percent in 1880 and 22 percent in 1900. On the other hand, for Madrid and the three Andalusian ports the corresponding figures decreased from 19 percent in 1860 to 17 percent in 1880 and 15 percent in 1900. Similarly, between 1860 and 1900 the average income per capita of the four Northeastern provinces increased from 111 to 163 percent of the national average, while in Madrid and the three Andalusian territories it declined from 164 to 117 percent (Díez-Minguela, Martinez-Galarraga, and Tirado-Fabregat Reference Díez-Minguela, Martinez-Galarraga and Daniel2018). As a consequence of those changes in the distribution of GDP, together with the dynamism of the European markets (that were closer to the Northeastern group), the difference between the average market potential of the former and the latter groups of cities increased from 7 percent in 1867 to 36 percent in 1900 (Martínez-Galarraga Reference Martínez-Galarraga2014). We argue that these changes in the Spanish economic geography, which very likely had their roots in the decades before 1860, jeopardized the traditional monetary leadership of Madrid and Cadiz at the benefit of the more dynamic Northern cities.
Changes in money market efficiency are also consistent with some additional evidence that the geographical structure of the Spanish monetary and financial system (traditionally centered in the axis Madrid–Cadiz) was being affected by changes in economic geography. For instance, indirect evidence of the decreasing importance of Madrid is provided by the list of Spanish cities whose bills of exchange were quoted in the London Stock Exchange, the most important international financial market at the time. According to The Economist, from 1843 to 1869 only the quotations of bills on Madrid and Cadiz were reported. From 1870 onwards, however, the list of Spanish cities whose exchange rates were reported in The Economist grew substantially. In particular, between 1870 and 1872, Madrid and Cadiz were joined by Barcelona, Malaga, and Santander. Later on, from 1873 to 1876 four other cities were added to the list (Bilbao, Granada, Seville, and Zaragoza). This expansion in the list of Spanish cities reported in The Economist was an exception among European countries, since it took place at a time in which the money systems of advanced countries were being increasingly centralized and nationalized. We suggest that this reflects the increasing decentralization of the Spanish payment system and the emergence of a growing number of internationally relevant financial and commercial centers, parallel to the decreasing leadership of Madrid and Cadiz.
To sum up, the gradual loss of centrality of the axis Madrid–Cadiz in the Spanish economy and payment system could have reduced the liquidity and, as a consequence, the efficiency in the Madrid and Andalusian money markets, while increasing them in the more dynamic Northeastern cities. Changes in Spain’s economic geography and, as a consequence, in monetary leadership, might therefore help to explain that, contrary to the across-the-board decreasing trend in transaction costs, the speed of adjustment in the Spanish money market did not improve everywhere, but had a very different behavior across city links.
CONCLUSIONS
This article analyzes the process of integration of the Spanish money market during the nineteenth century. Taking advantage of the late nationalization of the Spanish monetary system and the availability of a rich database of daily prices in Madrid of bills of exchange on other Spanish cities, we have applied a Band-TAR model to estimate the evolution of price convergence and efficiency in the Spanish money market between 1825 and 1875. Our estimation results offer a mixed picture of the process of money market integration in Spain. Whereas there was substantial progress in price convergence since the early decades of the century, speed of adjustment to shocks decreased over time in most of the links of the sample.
We suggest several possible explanations for those results. Early price convergence was probably associated with the significant progress that took place in the Spanish road infrastructure and the organization of high-speed overland transport before the arrival of the telegraph and the railways. These factors would have allowed a substantial decrease in transaction costs in the money market, down to levels comparable to those prevailing in the links between the most important international financial centers. However, the reduction in transaction costs did not always go hand-in-hand with an increase in market efficiency. We argue that differences in the evolution of money market efficiency across city links reflect the significant changes that took place in the Spanish economic geography throughout the period under study, which dramatically altered the leadership structure of the monetary market that had been inherited from the Ancient Régime.
As a consequence, the integration of the Spanish money market remained incomplete at least until the 1870s and full market integration had to wait until the nationalization of the monetary system. This took place between 1874 and 1884 through the concession of the note-issuing monopoly for the whole country to the Bank of Spain, the quick creation of the Bank’s network of branches, the introduction of national banknotes valid in the whole Spanish territory, and the adoption of a system of free transfers between the Bank’s provincial branches (Castañeda Reference Castañeda2001; Martin-Aceña, Martínez-Ruiz, and Nogues-Marco Reference Nogues-Marco2013).
The nationalization of the Spanish monetary system represented the end of a system of money transfers based on sight bills of exchange. The new monetary institutional structure reduced the costs of moving money across the Spanish territory to zero and led to the total integration of the market. This was clearly reflected in the quotations at the London Stock Exchange. The Economist, which had reported the exchange rate in London on several Spanish cities during the nineteenth century, from 1888 onwards only published a single Spanish exchange rate, under the label: “Madrid, Barcelona & co.” With a substantial delay over other Western European countries, this was the end of the traditional city-based monetary system in Spain.