1. Introduction
Using a magnetic field to enhance inertial fusion is an old idea (Jones & Mead Reference Jones and Mead1986) receiving renewed interest (Slutz & Vesey Reference Slutz and Vesey2012). An imposed field is being investigated at LLNL as a way to improve capsule performance and achieve ignition on the National Ignition Facility (NIF) (Perkins et al.
Reference Perkins, Logan, Zimmerman and Werner2013, Reference Perkins, Strozzi, Rhodes, Logan, Ho and Hawkins2014; D. Ho 2015, private communication). These simulation studies show an initial field of 40–70 T increases both the likelihood of ignition and the fusion yield by reducing electron heat and alpha-particle loss from the hot spot. Earlier experiments at the Omega laser facility with an imposed 8 T axial field show increased fusion yield and ion temperature in spherical implosions (Chang et al.
Reference Chang, Fiksel, Hohenberger, Knauer, Betti, Marshall, Meyerhofer, Séguin and Petrasso2011; Hohenberger et al.
Reference Hohenberger, Chang, Fiksel, Knauer, Betti, Marshall, Meyerhofer, Séguin and Petrasso2012). The field may also limit hydrodynamic (e.g. Rayleigh–Taylor) instability growth, and reduce the negative effects of the growth that does occur. The field also increases the plasma temperature in the underdense hohlraum fill, which could reduce stimulated Raman scattering (SRS) and improve laser propagation to the wall (Montgomery et al.
Reference Montgomery, Albright, Barnak, Chang, Davies, Fiksel, Froula, Kline, MacDonald and Sefkow2015). A pulsed-power approach is being developed to impose
 $B_{z0}=70~\text{T}$
on a NIF hohlraum (Rhodes, Perkins & Logan Reference Rhodes, Perkins and Logan2015), and is sketched in figure 1. Laser-driven capacitor-coil systems are a possible way to impose 100–1000 T fields (Fujioka et al.
Reference Fujioka, Zhang, Ishihara, Shigemori, Hironaka, Johzaki, Sunahara, Yamamoto, Nakashima and Watanabe2013; Pollock et al.
Reference Pollock, Turnbull, Ross, Hazi, Ralph, LePape, Froula, Heberberger and Moody2014).
Sketch of pulsed-power coil design to impose axial magnetic field on NIF hohlraum. (a) Hohlraum surrounded by solenoidal coil, fielded on a Diagnostic Instrument Manipulator (DIM). Additional hardware needed for fielding has been removed. (b) Diagram of hohlraum and solenoid, with full-fielding hardware included. The red region indicates the gold or other high-
 $Z$
hohlraum wall, while the grey regions outside the coil are additional support structure.

This paper presents simulation studies of how an imposed field affects hohlraum hydrodynamics and energetic electrons. First, we report on simulations using the radiation-hydrodynamics code HYDRA (Marinak et al. Reference Marinak, Kerbel, Gentile, Jones, Munro, Pollaine, Dittrich and Haan2001) with and without an imposed field of ignition experiment N120321 (described below). Then we show studies with the particle-in-cell (PIC) code ZUMA (Larson, Tabak & Ma Reference Larson, Tabak and Ma2010; Strozzi et al. Reference Strozzi, Tabak, Larson, Divol, Kemp, Bellei, Marinak and Key2012) of the field’s effect on energetic or ‘hot’ electrons.
We study NIF shot N120321, which used a 4-shock, low-adiabat or ‘low-foot’ laser pulse, a plastic ablator and a cryogenic deuterium–tritium (DT) ice layer. It achieved the highest fuel areal density to date on NIF, and has been extensively modelled to understand its low neutron yield (Clark et al.
Reference Clark, Marinak, Weber, Eder, Haan, Hammel, Hinkel, Jones, Milovich and Patel2015). Here, we use HYDRA’s magnetohydrodynamics (MHD) package (Koning, Kerbel & Marinak Reference Koning, Kerbel and Marinak2006) with
 $B_{z0}=70~\text{T}$
, which was not present in the actual experiment. We include the
 $\boldsymbol{J}\times \boldsymbol{B}$
magnetic pressure force, a simple Ohm’s law
 $\boldsymbol{E}={\it\eta}\boldsymbol{J}-\boldsymbol{v}\times \boldsymbol{B}$
, Ohmic heating and anisotropic electron thermal conductivities parallel and perpendicular to
 $\boldsymbol{B}$
(but not the Righi–Leduc heat flow along
 $\boldsymbol{B}\times \boldsymbol{{\rm\nabla}}T_{e}$
). This neglects several effects which could be important and which will be studied in future work, namely the self-generated or ‘Biermann battery’
 $\partial _{t}\boldsymbol{B}\propto \boldsymbol{{\rm\nabla}}T_{e}\times \boldsymbol{{\rm\nabla}}n_{e}$
field and the Nernst effect (
 $\boldsymbol{E}\propto \boldsymbol{B}\times \boldsymbol{{\rm\nabla}}T_{e}$
). In our runs, the
 $B$
field roughly follows the MHD ‘frozen-in’ law for the highly-conducting plasma flow. The primary effect of the field is to reduce electron heat conduction perpendicular to
 $\boldsymbol{B}$
. This leads to a hotter hohlraum fill, and a wider channel between the capsule and hohlraum equator. The inner cone of beams (pointed toward the equator) better propagate to the wall, which gives more equatorial X-ray drive and a less oblate imploded capsule. This would reduce the need for energy transfer to the inners, and probably reduce their backscatter; both due to the lower power and higher temperature.
Besides hydrodynamics, we also study hot electron dynamics. Hot electrons are a generic aspect of intense laser–plasma interactions (LPI). They are produced in any parametric process that drives a Langmuir wave. Of particular interest in inertial confinement fusion (ICF) are SRS and two-plasmon decay (TPD). These are the decay of a light wave to a Langmuir wave and, respectively, a light wave or Langmuir wave. In many laser-produced plasmas, the daughter Langmuir waves are damped primarily by collisionless Landau damping, which entails the resonant interaction of the wave with electrons at its phase velocity. This is typically greater than the electron thermal speed, and therefore produces a population of superthermal or ‘hot’ electrons. Experiments show the resulting hot-electron spectrum from a single parametric process is roughly exponential with ‘temperature’
 $T_{h}$
,
 $\text{d}N/\text{d}E\propto g(E)\text{e}^{-E/T_{h}}$
(
 $E$
is the hot electron kinetic energy), with
 $g=E^{1/2}$
for a non-relativistic Maxwellian. NIF experiments with gas-filled hohlraums have shown hard X-ray output consistent with a two-temperature hot-electron population. The lower temperature is attributed to Raman backscatter, and the higher one to TPD or SRS at quarter-critical density (Döppner et al.
Reference Döppner, Thomas, Divol, Dewald, Celliers, Bradley, Callahan, Dixit, Harte and Glenn2012). Relativistic processes that produce
 ${>}$
MeV electrons at intensities
 $I{\it\lambda}^{2}>10^{18}~\text{W}~\text{cm}^{-2}~{\rm\mu}\text{m}^{2}$
are of great interest in the short pulse and fast-ignition fields, but are not discussed here.
This paper focuses on hot electrons in ignition hohlraums, though similar considerations apply to directly-driven targets. Hot electrons impede ICF in several ways, namely implosion asymmetry and fuel preheat. The laser power transferred to hot electrons generally stays in the target, so is not a power loss like backscattered light. But, the deposition in space and time differs from the intended inverse-bremsstrahlung absorption of the incident laser. NIF hohlraums with high hohlraum gas-fill density
 $({\gtrsim}0.9~\text{mg}~\text{cm}^{-3}~\text{He})$
have generally shown large SRS from the inner beams. This reduces the inner-beam power reaching the wall – both by scattered light and Langmuir waves – which makes the implosion more oblate (or ‘pancaked’). The Langmuir wave energy remains in the target, but heats the hohlraum wall by conduction in a much larger area than the inner-beam spots. To control symmetry, cross-beam energy transfer has been used to move power from the outer to inner beams, inside the target (Michel et al.
Reference Michel, Divol, Williams, Weber, Thomas, Callahan, Haan, Salmonson, Dixit and Hinkel2009). Hot electrons with energy
 ${\gtrsim}170~\text{keV}$
can also preheat the fusion fuel (e.g. cryogenic DT ice layer) by depositing energy separate from the intended shock sequence and capsule compression (Salmonson et al.
Reference Salmonson, Haan, Meeker, Thomas, Robey, Suter and Dewald2010; Haan et al.
Reference Haan, Lindl, Callahan, Clark, Salmonson, Hammel, Atherton, Cook, Edwards and Glenzer2011). This results in a higher fuel adiabat, which significantly reduces the achievable compression.
We propagate hot electrons with the hybrid-PIC code ZUMA through plasma conditions from HYDRA. We run ZUMA in a ‘Monte-Carlo mode’ with no
 $E$
or
 $B$
fields, except sometimes a static
 $B$
. Hot electrons undergo energy loss and angular scattering as they propagate, and the energy deposition profile is found with and without an initial
 $B_{z0}$
. We first present an unphysical test-case study of mono-energetic hot electrons directly incident on the capsule (unrealistic for LPI-produced hot electrons) early in peak laser power (time 18 ns). A minimum initial energy
 $E_{0}=125~\text{keV}$
is needed to penetrate the ablator and reach the DT layer. The maximum energy deposited in the DT layer,
 $E_{DT}$
, occurs for
 $E_{0}=185~\text{keV}$
and is
 $E_{DT}/E_{0}=13\,\%$
. Higher energy electrons do not fully stop in DT.
We then examine a realistic hot-electron source, consistent with TPD during the early-time ‘picket’ or initial part of the laser pulse (time 1 ns). The deposition is mostly in the high-
 $Z$
wall, as expected from solid-angle arguments, and
 $E_{DT}/E_{h}=2.2\times 10^{-3}$
with
 $E_{h}$
the total injected hot electron energy. Adding a uniform 70 T axial
 $B$
field strongly magnetizes the hot electrons in the hohlraum fill, guides them to the capsule and increases
 $E_{DT}/E_{h}$
by
 $12\times$
to 0.026. This may not degrade fusion performance, since NIF experiments have shown greatly reduced picket hot electrons with pulse shaping, e.g. a low-power ‘toe’ to burn down the window (Moody et al.
Reference Moody, Callahan, Hinkel, Amendt, Baker, Bradley, Celliers, Dewald, Divol and Döppner2014; Dewald et al.
Reference Dewald2015).
Finally, we consider a hot-electron source consistent with SRS of the inner laser beams, early in peak laser power (18 ns). With no
 $B_{z0}$
, the hot electrons deposit throughout the target, with a very small
 $E_{DT}/E_{h}\approx 1.2\times 10^{-4}$
. With
 $B_{z0}=70~\text{T}$
, the field strongly magnetizes the hot electrons in the hohlraum fill gas. The deposition in DT is greatly increased (decreased) for hot electrons originating on field lines that do (do not) connect to the capsule at this time.
This paper is organized as follows. We describe our MHD simulation methodology in § 2 and our MHD results in § 3. The ZUMA simulation method is detailed in § 4. Section 5 discusses test cases of mono-energetic electron propagation through the capsule. Section 6 presents ZUMA results for a TPD-relevant source during the picket, and shows a
 $12\times$
increase in
 $E_{DT}$
with a 70 T axial field. In § 7 we present ZUMA results early in peak laser power with an SRS-relevant hot electron source, using plasma conditions and the
 $B$
field from our HYDRA simulations, and find a strong dependence in
 $E_{DT}$
on source location. We conclude in § 8.
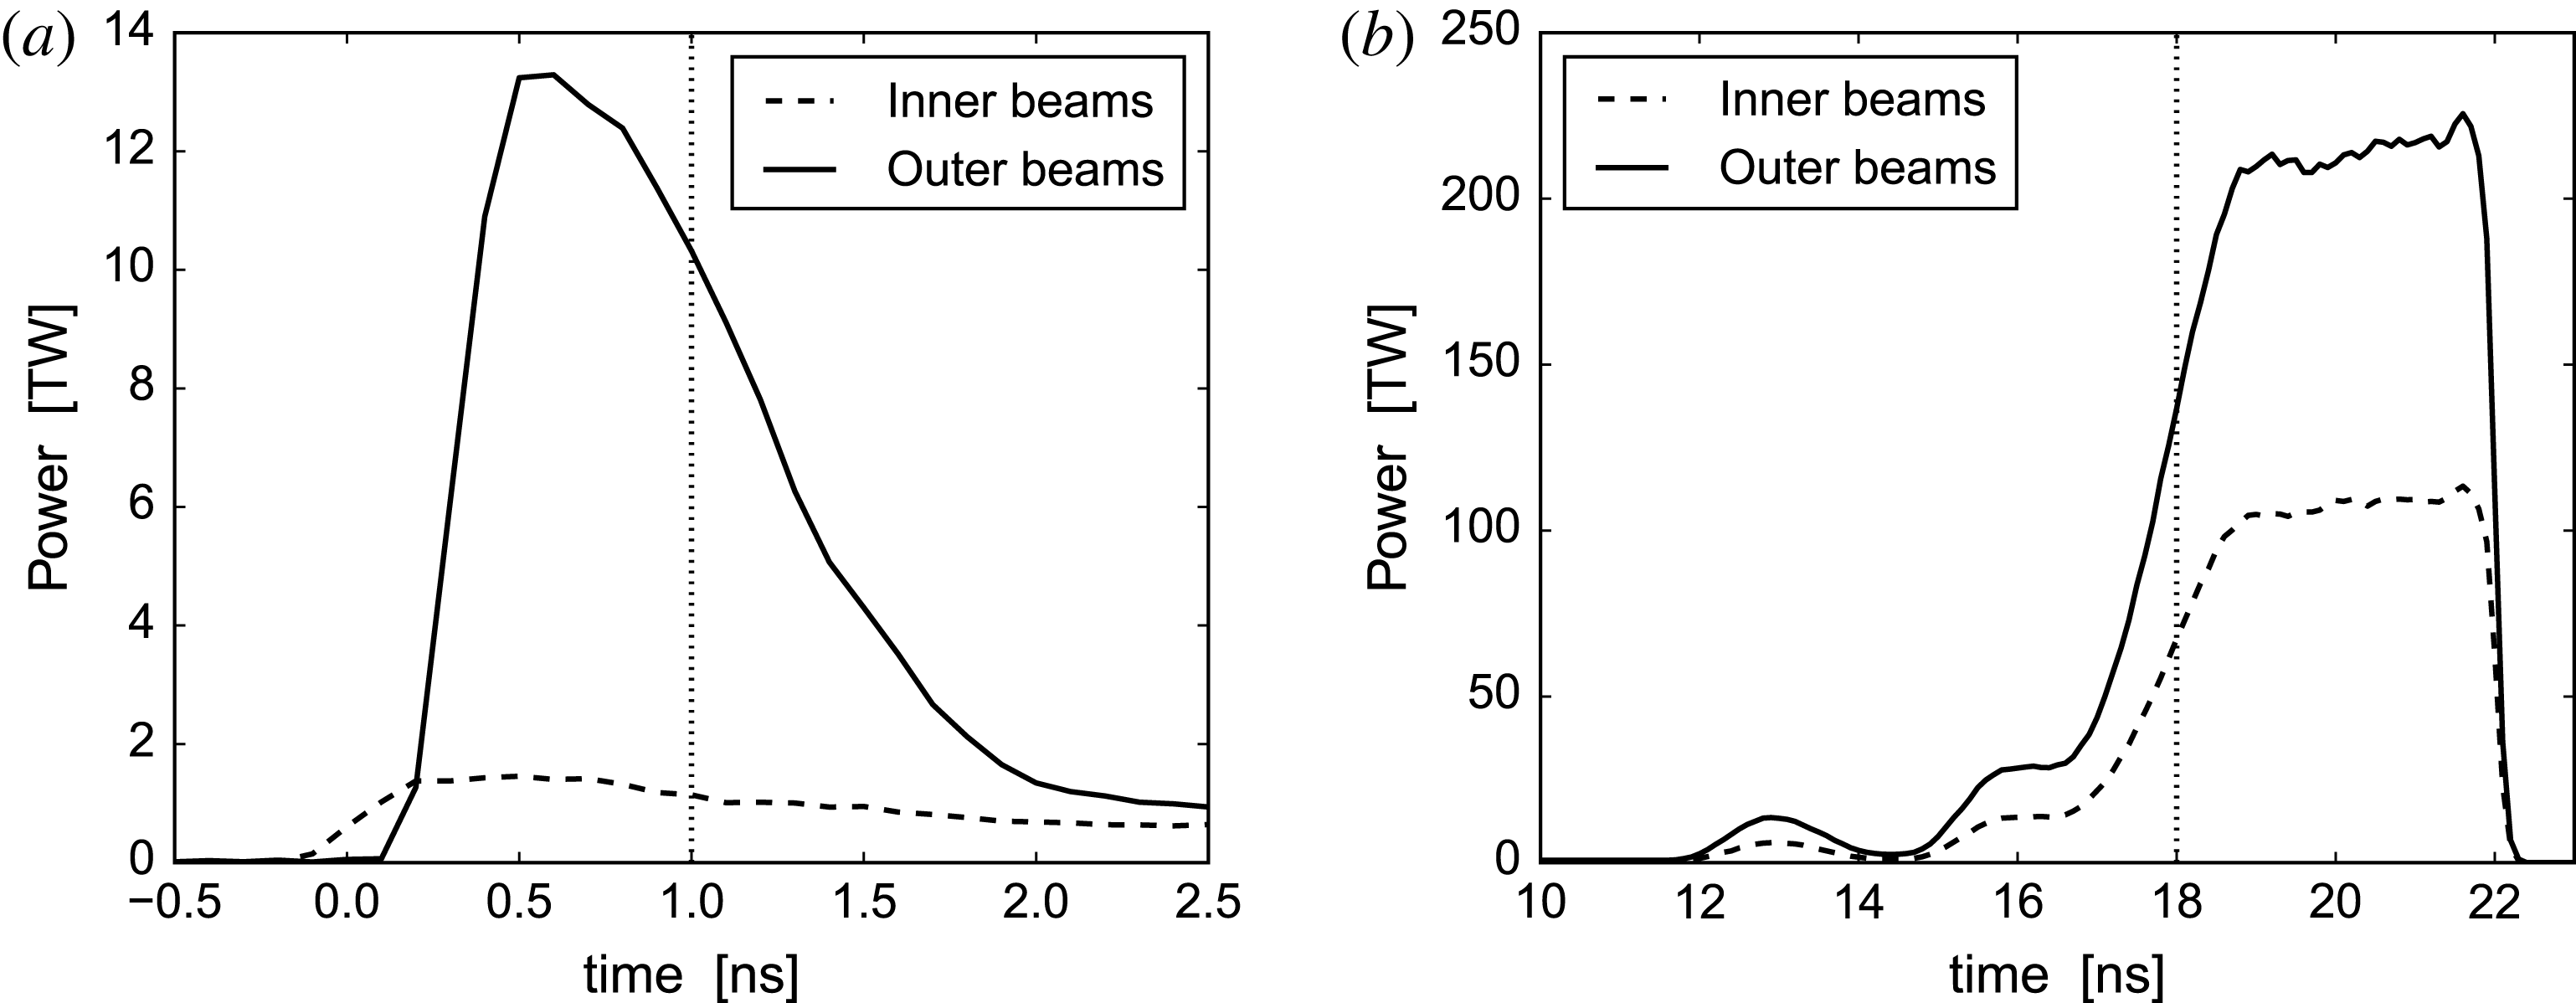
Incident laser power on NIF shot N120321 on the inner (dashed) and outer (solid) laser beams during the early-time picket (a) and peak power (b). The dotted vertical lines at 1 and 18 ns indicate times HYDRA plasma conditions are used for ZUMA hot electron studies.

2. HYDRA MHD simulation method
We use the radiation-hydrodynamics code HYDRA to simulate the NIF hohlraum experiment N120321. This shot used a 4-shock, ‘low-foot’ laser pulse (shown in figure 2), a plastic ablator (
 $\text{C}_{0.42}\text{H}_{0.57}$
plus small amounts of O impurity, and Si dopant to control X-ray preheat) with a DT ice layer, and a depleted uranium (DU) hohlraum with a thin
 $0.7~{\rm\mu}\text{m}$
inner gold coating. The hohlraum fill gas was
 $0.96~\text{mg}~\text{cm}^{-3}$
of He. The methodology is the standard one in use for hohlraum simulations at LLNL (Jones et al.
Reference Jones, Cerjan, Marinak, Milovich, Robey, Springer, Benedetti, Bleuel, Bond and Bradley2012), entailing the ‘high-flux model’ with detailed configuration accounting (DCA) for non-LTE material properties, and an electron thermal flux limit of 0.15 times the free-streaming value (Rosen et al.
Reference Rosen, Scott, Hinkel, Williams, Callahan, Town, Divol, Michel, Kruer and Suter2011). The runs use a 3-D mesh with one zone and periodic boundary conditions in azimuth, and are effectively cylindrical 2-D
 $(r-z)$
. The mesh is managed with an arbitrary Lagrangian–Eulerian (ALE) approach, designed to keep the mesh as Lagrangian as possible. We use the full, incident laser energy of 1.52 MJ, and neither remove measured backscatter nor degrade the laser power as is needed to match X-ray drive data in high gas fill targets (Jones et al.
Reference Jones, Cerjan, Marinak, Milovich, Robey, Springer, Benedetti, Bleuel, Bond and Bradley2012). Our HYDRA simulations are therefore not proper post-shots, but address the role of an imposed field in ignition-scale designs, and provide relevant plasma conditions for hot electron studies.
A distinct aspect of the present work is the inclusion of an initial axial magnetic field
 $B_{z0}$
. HYDRA’s MHD package (Koning et al.
Reference Koning, Kerbel and Marinak2006) was used to model
 $B_{z}$
and the resulting
 $B_{r}$
required by
 $\boldsymbol{{\rm\nabla}}\boldsymbol{\cdot }\boldsymbol{B}=0$
. No azimuthal field is produced for our axisymmetric geometry and simple Ohm’s law. The MHD package uses a 3-D finite element method, with appropriate boundary conditions to be effectively axisymmetric. We used the Ohm’s law
 $$\begin{eqnarray}\boldsymbol{E}={\it\eta}\boldsymbol{J}-\boldsymbol{v}\times \boldsymbol{B},\end{eqnarray}$$
where
 ${\it\eta}$
,
 $\boldsymbol{J}$
and
 $\boldsymbol{v}$
are scalar resistivity, net current and centre-of-mass velocity, respectively. The
 $B$
field is evolved via
 $\partial _{t}\boldsymbol{B}=-\boldsymbol{{\rm\nabla}}\times \boldsymbol{E}$
. The MHD package as used here affects the matter in three ways: (i) the
 $\boldsymbol{J}\times \boldsymbol{B}$
force, (ii)
 ${\it\eta}J^{2}$
(Ohmic) and other heating terms, and (iii) a tensor electron thermal conductivity:
 $$\begin{eqnarray}{\it\kappa}={\it\kappa}_{\bot }(\unicode[STIX]{x1D644}-\hat{b}\hat{b})+{\it\kappa}_{\Vert }\hat{b}\hat{b},\quad \hat{b}\equiv \frac{\boldsymbol{B}}{|\boldsymbol{B}|}.\end{eqnarray}$$
The Righi–Leduc effect, with a separate conductivity along
 $\boldsymbol{B}\times \boldsymbol{{\rm\nabla}}T_{e}$
, is currently neglected (
 $T_{e}$
is electron temperature). An artificial flux limit
 $f$
is imposed, as is typical in hohlraum simulations. Specifically, the component of the heat flux
 $\boldsymbol{q}_{e}$
along each logical index (not physical) coordinate
 $\hat{i}$
is limited:
 $\boldsymbol{q}_{e}\boldsymbol{\cdot }\hat{i} =\min [\hat{i} \boldsymbol{\cdot }{\it\kappa}\boldsymbol{\cdot }\boldsymbol{{\rm\nabla}}T_{e},fq_{FS}]$
where
 $q_{FS}\equiv n_{e}T_{e}^{3/2}/m_{e}^{1/2}$
is the free-streaming heat flux.
The anisotropic heat conduction has the largest effect in our simulations. We expect
 $B\gtrsim 1~\text{T}$
to significantly reduce
 ${\it\kappa}_{\bot }$
below its unmagnetized value
 ${\it\kappa}_{\Vert }$
. The Hall parameter
 $H\equiv {\it\omega}_{ce}{\it\tau}_{ei}$
for thermal electrons is
 $$\begin{eqnarray}\displaystyle H & \equiv & \displaystyle \displaystyle {\it\omega}_{ce}{\it\tau}_{ei}=\frac{B}{B_{0}},\end{eqnarray}$$
 $$\begin{eqnarray}\displaystyle \displaystyle B_{0} & \equiv & \displaystyle \frac{(32{\rm\pi})^{1/2}}{3}\frac{m_{e}^{1/2}e^{3}}{(4{\rm\pi}{\it\epsilon}_{0})^{2}}\frac{n_{e}}{T_{e}^{3/2}}Z_{eff},\end{eqnarray}$$
 $$\begin{eqnarray}\displaystyle \displaystyle Z_{eff} & \equiv & \displaystyle \frac{\displaystyle \mathop{\sum }_{i}f_{i}Z_{i}^{2}\ln {\it\Lambda}_{ei}}{\displaystyle \mathop{\sum }_{i}f_{i}Z_{i}}.\end{eqnarray}$$
 $Z_{i}$
is the ionic (not nuclear) charge,
 $n_{i}=f_{i}n_{I}$
and
 $n_{I}=\sum _{i}n_{i}$
is the total ion number density. In practical units,
 $B_{0}\;(\text{T})=4.73(n_{e}/n_{cr})Z_{eff}/T_{e}~(\text{keV})^{3/2}$
with
 $n_{cr}=9.05\times 10^{21}~\text{cm}^{-3}$
the critical density for light of wavelength 351 nm. For
 $Z_{i}=2$
He at
 $n_{e}=0.1n_{cr}$
and
 $T_{e}=3~\text{keV}$
, typical of the underdense hohlraum fill, we find
 $\ln {\it\Lambda}_{ei}=7.9$
and
 $B_{0}=1.43~\text{T}$
. Given
 $B_{z0}=70~\text{T}$
, most of the underdense plasma fill should be strongly magnetized.
 ${\it\kappa}_{\bot }$
decreases with
 $H$
according to
 $$\begin{eqnarray}\frac{{\it\kappa}_{\bot }}{{\it\kappa}_{\Vert }}\approx \frac{1+p_{1}H}{1+p_{2}H+p_{3}H^{2}+p_{4}H^{3}},\end{eqnarray}$$
with the
 $Z_{i}$
-dependent fitting coefficients
 $p_{j}$
given in Epperlein & Haines (Reference Epperlein and Haines1986). For
 $Z_{i}=2$
He,
 ${\it\kappa}_{\bot }/{\it\kappa}_{\Vert }=0.1$
for
 $H=1.6$
.
 ${\it\kappa}_{\Vert }$
is found either from the Lee & More (Reference Lee and More1984) formulation to include dense-plasma effects, or interpolation from an advanced table. The Epperlein and Haines results are used to include electron self-collisions (
 $Z_{i}<\infty$
) and dependence on
 $H$
.
3. MHD simulation results
The HYDRA runs of NIF shot N120321 with and without MHD are qualitatively similar. The principal difference is the MHD run has higher electron temperature in some regions and a wider channel of He fill gas at the equator. This leads to better inner beam propagation to the wall (less inverse-bremsstrahlung absorption in the low-
 $Z$
fill), and results in a less oblate capsule. Figure 3 shows the material regions and electron density for the two runs at 18 ns, during the rise to peak power. We use this time for ZUMA simulations of SRS hot electrons. A more detailed density plot is shown below in figure 7. Electron temperature
 $T_{e}$
with and without MHD at several times during peak power is displayed in figure 4. The field increases
 $T_{e}$
mainly in the laser-heated gold, such as the outer-beam ‘bubble’
 $(r,z)\approx (0.2,-0.3)~\text{cm}$
. The He gas fill is also hotter with the field, but less so than the gold. The low density plasma outside the laser entrance hole (LEH) is cooler with the field, though the total energy in this region is small.
Plasma conditions from HYDRA simulations of NIF shot N120321 at 18 ns, used in SRSPEAK ZUMA run series. The left
 $(z<0)$
half of the hohlraum is plotted, but the simulation included both halves. Top half (
 $r>0$
): without MHD, bottom half (
 $r<0$
): with MHD and initial axial magnetic field
 $B_{z0}=70~\text{T}$
. (a) Material region: DT, He, CH (two green regions), Au and DU indicate the materials deuterium–tritium, helium, plastic, gold and depleted uranium. (b) Free electron density in units of critical density for 351 nm light.

(a,c,e) Electron temperature in keV from HYDRA MHD simulations shown in figure 3, at several times. (b,d,f) Temperature difference with MHD minus without MHD. Light blue contour marks region boundary for DT, CH and Au. Dashed contours are temperature differences of
 $\pm 0.5~\text{keV}$
.

 $|\boldsymbol{B}|$
at 18 ns from HYDRA MHD simulation shown in figure 3. The dark red colour in the capsule is the uncompressed field of
 $70~\text{T}$
. White curves are stream lines (integral curves) of the vector field
 $(B_{z},B_{r})$
. Light blue boxes and text indicate ZUMA hot electron sources for runs with and without MHD.

Capsule shell density at 21.5 ns from HYDRA simulations shown in figure 3 without MHD (top half,
 $r>0$
), and with MHD and
 $B_{z0}=70~\text{T}$
(bottom half,
 $r<0$
). The shell is oblate without MHD, while it is close to round with MHD. This reflects the improved inner beam propagation with the field.

The
 $B$
field for the MHD run is plotted in figure 5. It roughly follows the MHD frozen-in law, and advects with the radial motion of the ablator and high-
 $Z$
wall. The compressed field approaches 300 T and continues to grow with time. The white streamline that just touches the capsule outer radius at
 $(z,r)=(0,0.1)$
roughly separates field lines that are still connected to the capsule (
 $r<0.1~\text{cm}$
at
 $z=0$
), from those that have advected with the ablated blowoff and no longer connect to the capsule.
The capsule density at the end of peak power is plotted in figure 6. The dense fuel is oblate without the field, but becomes close to round with it.
4. ZUMA hot electron simulation method
We propagate hot electrons through fixed plasma conditions from HYDRA using the hybrid-PIC code ZUMA in a ‘Monte-Carlo’ mode. We do not include forces from
 $E$
and
 $B$
fields, except when we include a specified (static)
 $B$
field. The background plasma properties are not updated. In other work, HYDRA and ZUMA have been coupled to run in tandem, and applied to fast ignition designs (Strozzi et al.
Reference Strozzi, Tabak, Larson, Divol, Kemp, Bellei, Marinak and Key2012). The hot electrons undergo collisional energy loss off background electrons, and angular scattering off background electrons and ions. We neglect collisions among hot electrons, since their density is much less than the background species. We use the formulas in Robinson et al. (Reference Robinson, Strozzi, Davies, Gremillet, Honrubia, Johzaki, Kingham, Sherlock and Solodov2014) for a fast electron with
 $v\gg v_{Te}$
. The energy loss rate (stopping power) is given by
 $$\begin{eqnarray}\displaystyle \displaystyle \frac{\text{d}E}{\text{d}t} & = & \displaystyle \displaystyle \frac{C_{e}n_{e}}{m_{e}v}L_{d}\end{eqnarray}$$
 $$\begin{eqnarray}\displaystyle & {\approx} & \displaystyle \displaystyle \frac{C_{e}n_{e}}{\sqrt{2m_{e}E}}\ln \frac{E}{\hbar{\it\omega}_{p}},\quad \hbar{\it\omega}_{p}\ll E\ll m_{e}c^{2},\end{eqnarray}$$
 $$\begin{eqnarray}\displaystyle L_{d} & = & \displaystyle \displaystyle \ln \frac{pv}{\hbar{\it\omega}_{p}\sqrt{{\it\gamma}+1}}-\frac{\ln 2}{2}+\frac{9}{16}+\frac{\ln 2+1/8}{{\it\gamma}}\left(\frac{1}{2{\it\gamma}}-1\right).\end{eqnarray}$$
 $C_{e}\equiv e^{4}/4{\rm\pi}{\it\epsilon}_{0}^{2}$
, the fast electron kinetic energy
 $E=m_{e}c^{2}{\it\epsilon}$
,
 ${\it\gamma}={\it\epsilon}+1$
is the Lorentz factor and
 $p={\it\gamma}m_{e}v$
.
 $n_{e}$
is the total (free plus bound) background electron density.
 $L_{d}$
given above is valid for energy loss off free electrons, or bound electrons for sufficiently high
 $E$
or
 $n_{e}$
(the ‘density effect’). This assumption may not be valid for all electrons. The angular scattering rate is
 $$\begin{eqnarray}\displaystyle \displaystyle \frac{\text{d}\langle {\it\theta}^{2}\rangle }{\text{d}t} & = & \displaystyle \displaystyle \frac{2C_{e}}{p^{2}v}[n_{I}\langle Z^{2}\rangle L_{si}+n_{e,f}L_{se}]\end{eqnarray}$$
 $$\begin{eqnarray}\displaystyle & {\approx} & \displaystyle \displaystyle \frac{C_{e}}{\sqrt{2m_{e}}E^{3/2}}[n_{I}\langle Z^{2}\rangle +n_{e,f}]\ln \frac{2(2T_{e}E)^{1/2}}{\hbar{\it\omega}_{p}},\quad \frac{(\hbar{\it\omega}_{p})^{2}}{T_{e}}\ll E\ll m_{e}c^{2},\end{eqnarray}$$
 $$\begin{eqnarray}\displaystyle L_{si} & = & \displaystyle \displaystyle \ln \frac{2l_{s}p}{\hbar}-0.234-0.659v^{2}/c^{2},\end{eqnarray}$$
 $$\begin{eqnarray}\displaystyle L_{se} & = & \displaystyle \displaystyle L_{si}-\frac{1}{2}\ln \frac{{\it\gamma}+3}{2}.\end{eqnarray}$$
 $n_{e,f}$
is the free-electron density,
 $\langle Z^{2}\rangle =\sum _{i}f_{i}Z_{i}^{2}$
and we use the same ion species notation as after (2.3) except
 $Z_{i}$
is the nuclear (not ionic) charge.
 $l_{s}$
is a screening length, which we take to be the free-electron Debye length. For neutral atoms, it should be replaced by the atomic radius. In any event, we impose a minimum of 1 on
 $L_{d}$
,
 $L_{si}$
, and
 $L_{se}$
.
We run ZUMA in 2-D cylindrical geometry. ZUMA currently operates with constant (but different) grid spacing
 $\text{d}r$
and
 $\text{d}z$
. The HYDRA plasma conditions are interpolated onto a uniform mesh with
 $\text{d}r=\text{d}z=3~{\rm\mu}\text{m}$
using the OVERLINK package (Grandy Reference Grandy1999). This small spacing is needed to resolve small features, such as the gold wall and DT layer. The ZUMA time step is 1 fs, which is chosen to adequately resolve the dependence of
 $\text{d}E/\text{d}t$
on
 $E$
for small
 $E$
and high
 $n_{e}$
. ZUMA stops following electrons when
 $E<5.11~\text{keV}$
and locally deposits their kinetic energy. In this paper, ZUMA injects hot electrons from a distribution that is a product of an energy spectrum
 $\text{d}N/\text{d}E$
times a polar angle spectrum
 $\text{d}N/\text{d}{\it\Omega}$
. For a thermal spectrum with a ‘temperature’
 $T_{h}$
, we use a relativistic Maxwell–Jüttner distribution:
 $$\begin{eqnarray}\frac{\text{d}N}{\text{d}E}=C[1+{\it\epsilon}/2]^{1/2}[1+{\it\epsilon}]E^{1/2}\text{e}^{-E/T_{h}}.\end{eqnarray}$$
 $C$
is a normalization constant, and the two bracketed factors are absent for a non-relativistic Maxwellian.
5. Mono-energetic electron propagation through capsule at peak power: CAPTEST series
This section considers the propagation of electrons directly incident on the capsule during peak laser power, as a function of electron energy. We call this the CAPTEST series of ZUMA runs, and stress this source is not realistic for LPI-generated hot electrons. Rather, our purpose is to understand where electrons that reach the capsule deposit their energy, and which energies pose the greatest preheat risk. We use plasma conditions from our HYDRA simulation of NIF shot N120321 with no MHD at time 18 ns. The same conditions are used in the SRS-relevant SRSPEAK series discussed below in § 7. The time 18 ns is during the rise to peak power (see figure 2) and has significant inner-beam SRS. An analogous time in shock-timing (‘keyhole’) shots has been identified as possibly having a large hot-electron preheat effect (Robey et al. Reference Robey, Celliers, Moody, Sater, Parham, Kozioziemski, Dylla-Spears, Ross, LePape and Ralph2014).
Electron density (free plus bound) at 18 ns in HYDRA simulation of NIF shot N120321 with no MHD (discussed in § 3), used for CAPTEST series of ZUMA runs. (b) Zooms on capsule. Material regions are separated by solid lines and labelled with text as in figure 3. The ZUMA hot electron source is indicated.

Energy deposited by 175 keV mono-energetic hot electron source, without (a) and with (b) angular scattering, for CAPTEST ZUMA run series.

Figure 7 shows the total (free plus atomically bound) electron density in the HYDRA simulation. Mono-energetic hot electrons are injected in a cylinder of radius
 $500~{\rm\mu}\text{m}$
at
 $z=-0.1~\text{cm}$
, with an initial velocity in the
 $z$
direction. The hot electrons experience energy loss and (in some runs) angular scatter, but no forces from
 $E$
or
 $B$
fields. The resulting energy deposited per volume, zoomed on the capsule, is plotted in figure 8. The case with angular scattering shows large spreading of the hot electrons in the dense CH (plastic) ablator. Since the absolute number of hot electrons introduced is arbitrary, we express the deposition as energy density per injected hot electron energy.
Fraction of injected hot electron energy deposited in different regions, or escaped to boundaries, for CAPTEST ZUMA run series. Plot on (a,b) is (without, with) angular scattering.

Solid curves:
 ${\it\phi}_{DT}=$
fraction of injected hot-electron energy deposited in DT, with (black) and without (red) angular scatter, for CAPTEST ZUMA run series. Closed circles are ZUMA simulation points. Dashed curves: power-law fits to
 $E\geqslant 200~\text{keV}$
points. Thin blue curve is approximate form explained in text.

We plot the fraction of injected energy that is deposited in various regions or escapes to the boundaries in figure 9. The deposition in DT (essentially the dense fuel layer, not the less-dense proto-hotspot) is shown in figure 10. All electrons with
 $E<125~\text{keV}$
stop in the CH ablator. This sets a minimum energy hot electrons must have when they reach the capsule (at the time 18 ns) to reach the DT layer. Above this energy, the fraction deposited in DT increases, until the hot electrons have enough energy to not stop in the DT. With no angular scatter (figure 9
a), hot electrons eventually cross the capsule, and exit the problem through the LEH. Angular scatter lowers and spreads out the peak in coupling to DT. It also causes some hot electrons to reach the Au/U hohlraum wall. In both cases, the deposition in the He hohlraum fill gas is negligible.
A simple model illustrates the basic features of figure 10, especially for no angular scatter. Imagine a hot electron starting at position
 $z_{0}$
in the CH ablator, with initial energy
 $E_{0}$
and
 $v_{z}>0$
. We use a 1-D slab geometry with CH from
 $z_{0}$
to
 $z_{1}$
, DT from
 $z_{1}$
to
 $z_{2}$
and CH for
 $z>z_{2}$
. We seek the fraction of initial energy deposited in DT,
 ${\it\phi}_{DT}=E_{DT}/E_{0}$
, where
 $E_{DT}$
is the energy deposited in DT. The hot electron loses energy as it moves to increasing
 $z$
according to
 $\text{d}E/\text{d}z=-f/2E$
, where
 $f$
is a constant and we include only the leading-order dependence of stopping power on energy, for
 $E\ll m_{e}c^{2}$
. Integrating from
 $z_{a}$
to
 $z_{b}$
gives
 $E_{b}^{2}=E_{a}^{2}-f(z_{b}-z_{a})$
. An electron with
 $E_{0}<E_{01}$
fully stops in the CH with
 $z<z_{1}$
, one with
 $E_{0}>E_{02}$
crosses the DT, i.e. stops at
 $z>z_{2}$
and one with
 $E_{01}<E_{0}<E_{02}$
stops in the DT layer, i.e.
 $z_{1}<z<z_{2}$
. A straightforward calculation gives
 $$\begin{eqnarray}{\it\phi}_{DT}=\left\{\begin{array}{@{}ll@{}}0, & E_{0}<E_{01}\\ \left[1-E_{01}^{2}/E_{0}^{2}\right]^{1/2}, & E_{01}<E_{0}<E_{02}\\ \left[1-E_{01}^{2}/E_{0}^{2}\right]^{1/2}-\left[1-E_{02}^{2}/E_{0}^{2}\right]^{1/2}, & E_{02}<E_{0}.\end{array}\right.\end{eqnarray}$$
 $E_{01}^{2}=f_{CH}(z_{1}-z_{0})$
and
 $E_{02}^{2}=E_{01}^{2}+f_{DT}(z_{2}-z_{1})$
. For
 $E_{0}=E_{01}+{\it\delta}E$
with
 ${\it\delta}E$
small,
 ${\it\phi}_{DT}\approx (2{\it\delta}E/E_{01})^{1/2}$
, and for
 $E_{0}\gg E_{02}$
,
 ${\it\phi}_{DT}\approx f_{DT}(z_{2}-z_{1})/2E_{0}^{2}$
. The simple model for
 ${\it\phi}_{DT}$
, with
 $E_{01}=135~\text{keV}$
and
 $E_{02}=155~\text{keV}$
, is plotted as the solid blue curve in figure 10. The model is close to the red, no-scattering result, though the capsule curvature smears the peak compared to the simple model. Figure 10 also includes least-square power-law fits to the
 $E_{0}\geqslant 200~\text{keV}$
results:
 ${\it\phi}_{DT}=(E_{0}/52.3~\text{keV})^{-1.79}$
without angular scatter, and
 ${\it\phi}_{DT}=(E_{0}/62.7~\text{keV})^{-1.75}$
with scatter. These are both close to the
 $E_{0}^{-2}$
scaling of our simple model for
 $E_{0}\gg E_{02}$
.
Coupling to DT of a Maxwell–Jüttner hot electron source. Blue:
 $E\ast \text{d}N/\text{d}E$
for Jüttner source with
 $T_{h}=50~\text{keV}$
. Black:
 ${\it\phi}_{DT}=$
energy fraction deposited in DT, with angular scatter (solid black curve from figure 10). Red: product of black and blue curves.

Black (left
 $y$
-axis): injected hot electron energy fraction coupled to DT, for Maxwell–Jüttner source with temperature
 $T_{hot}$
. Red (right
 $y$
-axis): hot electron energy with peak coupling to DT (i.e. peak of red curve from figure 11).

Material region (a) and laser intensity summed over all beams (b) at 1 ns from HYDRA simulation with no MHD of NIF shot N120321, used for PICKET series of ZUMA runs. Hot-electron source is indicated as white box and is placed only in the
 $z<0$
half of the two-sided (
 $z<0$
and
 $z>0$
) ZUMA domain.

We apply our mono-energetic results to a thermal spectrum in figures 11 and 12, and find DT preheat comes mainly from hot electrons with energies
 ${\gtrsim}160~\text{keV}$
, for
 $T_{h}>20~\text{keV}$
. Figure 11 shows the coupling to DT of a thermal, Maxwell–Jüttner spectrum with
 $T_{h}=50~\text{keV}$
. The black curve is the DT coupling fraction from figure 10 (also given there by a black curve), and the blue curve is the thermal energy spectrum
 $E\ast \text{d}N/\text{d}E$
for
 $T_{h}=50~\text{keV}$
. The red curve is their product, namely the energy coupled to DT by electrons of a given energy, in a thermal spectrum. The red curve exhibits behaviour akin to the ‘Gamow peak’ in fusion reactions, with a location determined essentially by the steeper black curve. Figure 12 shows the overall
 ${\it\phi}_{DT}$
integrated over the thermal spectrum versus
 $T_{h}$
. This peaks slightly above 5 % near
 $T_{h}=90~\text{keV}$
. The red curve is, as a function of
 $T_{h}$
, the hot electron energy of maximum
 $E_{DT}$
, i.e. the energy of the peak in the red curve in figure 11. This increases slowly with
 $T_{h}$
, and is at
 ${>}160~\text{keV}$
for all
 $T_{h}$
of interest. It is thus important to correctly model these hot electrons to calculate DT preheat, even for
 $T_{h}\ll 160~\text{keV}$
.
6. Hot electron propagation in early-time picket: PICKET series
This section studies hot-electron dynamics during the initial laser ‘picket’, and the effects of an axial
 $B$
field. The principal way hot electrons are produced during the picket is LPI in the LEH. This can be TPD for
 $n_{e}\approx n_{cr}/4$
, Raman scattering or a multi-beam variant of it (Michel et al.
Reference Michel, Divol, Dewald, Milovich, Hohenberger, Jones, Hopkins, Berger, Kruer and Moody2015). NIF experiments have shown the picket hot electrons can be reduced by shaping the picket pulse, for instance by turning the inner beams on before the outers to blow down the window at low power. Experiments at the Omega laser studied hot electrons from TPD during window burn down (Regan et al.
Reference Regan, Meezan, Suter, Strozzi, Kruer, Meeker, Glenzer, Seka, Stoeckl and Glebov2010).
The DT fuel is particularly sensitive to hot electrons produced during the early time picket pulse:
 ${\rm\Delta}\text{entropy}=E_{DT}/\text{temperature}$
, so a small
 $E_{DT}$
added when the fuel is cold produces a large entropy increase. In addition, melting the cryogenic DT layer before the first shock arrives causes the inside surface to expand, which can degrade the ability to perform shock timing (C. A. Thomas, 2015, private communication). For indirect-drive ignition designs, this occurs for
 $E_{DT}\sim 0.1~\text{J}$
. NIF ignition-relevant hohlraum experiments show total hot-electron energies
 $E_{h}\sim 1~\text{J}$
with
 $T_{h}\sim 80~\text{keV}$
. Calculations typically show
 $E_{DT}/E_{h}\sim (2{-}5)\times 10^{-3}$
, giving preheat
 $E_{DT}\sim (2{-}5)\times 10^{-3}~\text{J}$
well below melt.
We use HYDRA plasma conditions at 1 ns, shortly after the outer-beam power has peaked, for ZUMA calculations. We call this the PICKET run series. Figure 13 shows the material regions and laser intensity. We source the hot electrons in a
 $500~{\rm\mu}\text{m}$
radius circle at the left-side LEH (
 $z=-0.45~\text{cm}$
), which is roughly the extent of high laser intensity. Since TPD does not generally produce collimated hot electrons, we use an isotropic source with velocity-space
 $\text{d}N/\text{d}{\it\Omega}$
constant (
 ${\it\Omega}$
is solid angle in velocity) for polar angles between 0 and
 $90^{\circ }$
, and zero otherwise (i.e. uniform in the forward-going half-space). The energy spectrum is a Maxwell–Jüttner with
 $T_{h}=80~\text{keV}$
, which is consistent with hard X-ray data on NIF (discussed below).
We expect a 70 T axial field to strongly magnetize the hot electrons in the low-density hohlraum gas fill, and guide them to the capsule. Recall that we inject a divergent hot-electron source, so the question is whether the field confines them in space. It will not collimate them, i.e. reduce their velocity-space divergence. The electron Larmor radius
 $r_{Le}\equiv p_{\bot }/eB$
, which for
 $E=100~\text{keV}$
and
 $B=70~\text{T}$
is
 $r_{Le}=16.0~{\rm\mu}\text{m}\cdot \sin {\it\alpha}$
(
 ${\it\alpha}$
is the angle between
 $\boldsymbol{B}$
and
 $\boldsymbol{p}$
). This is much less than the relevant plasma scale lengths. Also, the cyclotron period
 ${\it\tau}_{ce}=2{\rm\pi}{\it\gamma}m_{e}/eB$
is
 $0.510~\text{ps}\cdot {\it\gamma}$
for
 $B=70~\text{T}$
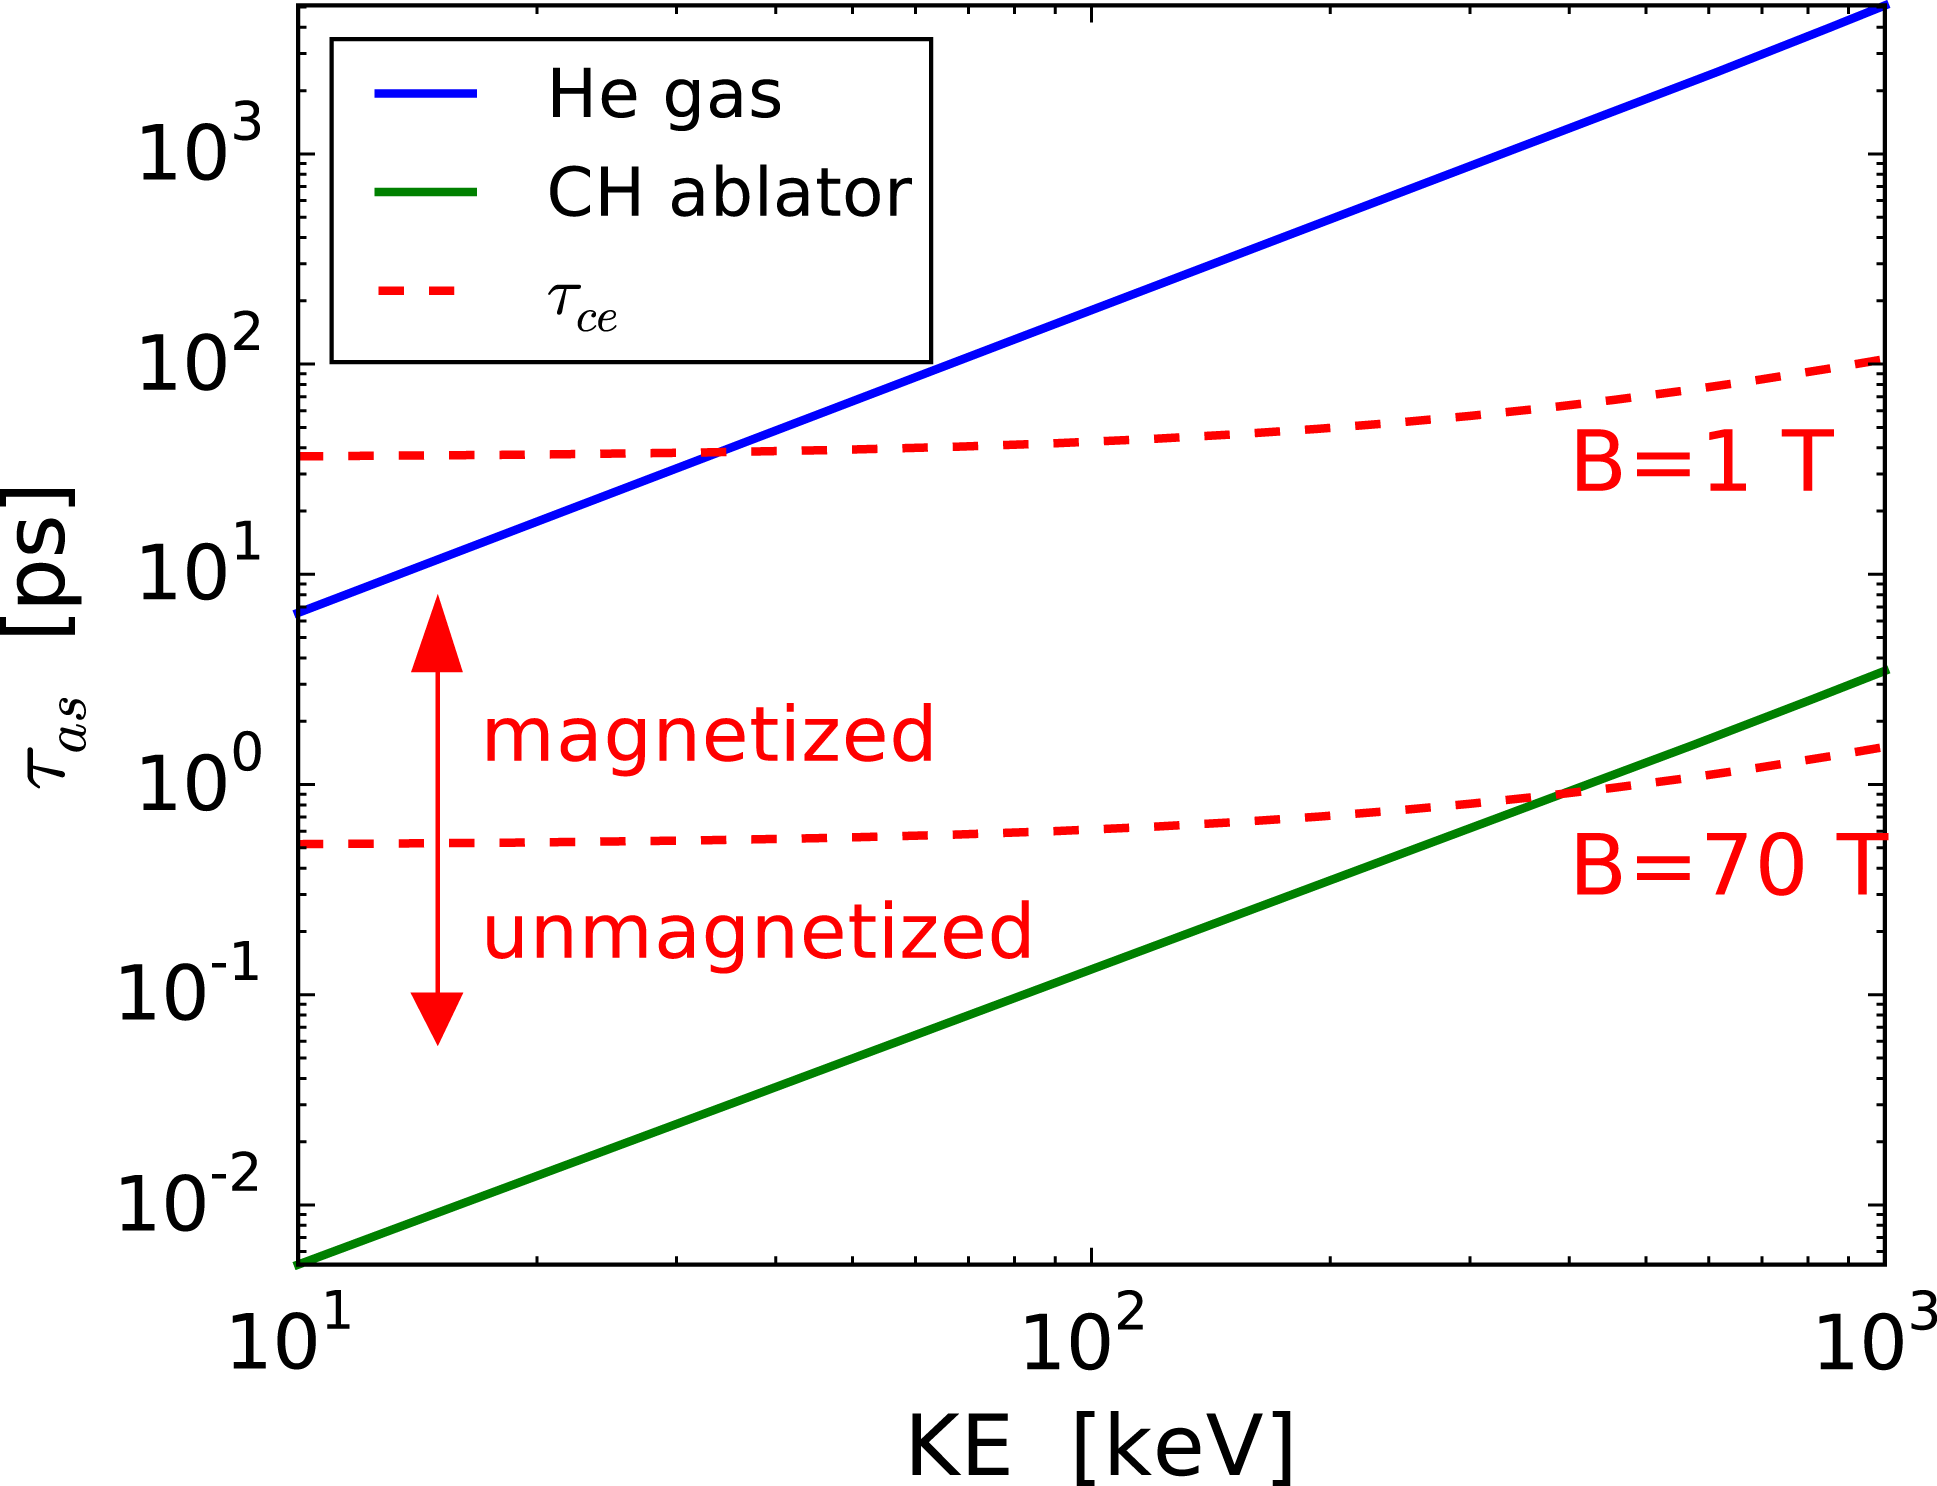
, which is much shorter than the propagation time through the hohlraum. Figure 14 plots
 ${\it\tau}_{ce}$
and the time for
 $90^{\circ }$
root-mean-square angular scatter,
 ${\it\tau}_{as}$
:
 $\langle {\it\theta}^{2}\rangle =(90^{\circ })^{2}$
for
 $\text{d}t={\it\tau}_{as}$
in (4.2). We consider two fully-ionized cases: one representative of the hohlraum fill:
 $0.96~\text{mg}~\text{cm}^{-3}$
of He at
 $T_{e}=1~\text{keV}$
, and one of the ablator:
 $1~\text{g}~\text{cm}^{-3}$
of
 $C_{1}H_{1}$
at 200 eV. The plot shows all hot electrons are magnetized in the He, while those with
 $E>300~\text{keV}$
in the CH are. Even if
 ${\it\tau}_{ce}$
exceeds
 ${\it\tau}_{as}$
,
 $r_{Le}$
is much smaller than typical capsule dimensions
 ${\sim}$
100’s
 ${\rm\mu}\text{m}$
.
Time for
 $90^{\circ }$
angular scatter
 ${\it\tau}_{as}$
for: blue curve:
 $0.96~\text{mg}~\text{cm}^{-3}$
of He at
 $T_{e}=1~\text{keV}$
(typical for hohlraum gas fill in NIF shot N120321), green curve:
 $1~\text{g}~\text{cm}^{-3}$
of
 $C_{1}H_{1}$
at 200 eV (typical for the ablator). Red dashed curves are cyclotron period
 ${\it\tau}_{ce}$
for
 $B_{z}=1$
and
 $70~\text{T}$
. Most hot electrons are (strongly, weakly) magnetized in the (He gas, CH ablator).

The energy deposition is shown in figure 15 for the ZUMA runs with no
 $B$
field (top half), and with a uniform
 $B_{z}=70~\text{T}$
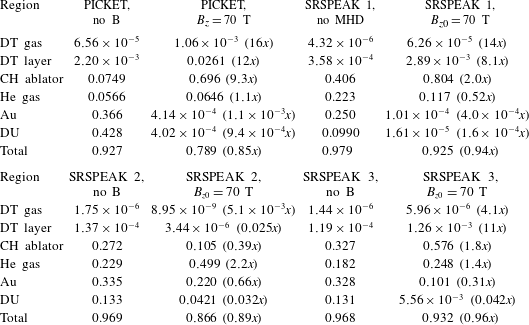
field (bottom half). Table 1 lists the fraction of injected hot-electron energy deposited in different regions. With no
 $B$
field, the hot electrons propagate essentially freely in the He gas fill. They mostly deposit in the hohlraum wall, and a small fraction deposits in the ablator. This is expected based on the solid angle subtended by these regions. With a uniform
 $B_{z}=70~\text{T}$
, the hot electrons are strongly magnetized in the He gas and guided to the capsule. They mostly deposit in the ablator, out to a radius comparable to that of the source. This asymmetric preheat, occurring mostly in the poles, may drive capsule asymmetries. The energy deposited in the DT layer is
 ${\sim}12\times$
higher with the 70 T field. Whether this is a preheat concern depends on the spectrum and total energy of hot electrons produced.
The lack of deposition in high
 $Z$
with the field means the same hot electron source produces many fewer hard X-rays. This is a diagnostics concern, since hard X-rays are generally used to deduce hot electrons on NIF. One such principal diagnostic is the FFLEX hard X-ray (
 ${>}10~\text{keV}$
) detector (Dewald et al.
Reference Dewald, Thomas, Hunter, Divol, Meezan, Glenzer, Suter, Bond, Kline and Celeste2010; Hohenberger et al.
Reference Hohenberger, Albert, Palmer, Lee, Döppner, Divol, Dewald, Bachmann, MacPhee and LaCaille2014), with 10 channels filtered for different energy ranges. Energetic electrons lose energy by collisions with background electrons and by bremsstrahlung radiation. Radiation loss
 ${\sim}EZ\times$
collisional loss, with the two equal in gold for
 $E=10$
MeV. Only electrons that deposit energy in high-
 $Z$
material, such as the hohlraum wall, produce enough hard X-rays for FFLEX to detect. Hot electrons striking the capsule during the picket have been measured on ‘re-emit’ experiments, where the capsule is replaced by a high-
 $Z$
(e.g. bismuth) ball.
Hot electron energy deposition for PICKET series of ZUMA runs with no magnetic field (top) and a uniform
 $B_{z}=70~\text{T}$
field (bottom).

Fraction of injected hot-electron energy deposited in different regions, for PICKET (1 ns) and SRSPEAK (18 ns) series of ZUMA runs.
 $(x)$
is ratio of with
 $B$
field/MHD to without. Fractions do not sum to unity because some hot electrons escape from problem boundaries.

7. Hot-electron propagation during peak power: SRSPEAK series
We now consider ZUMA simulations of propagation of a realistic hot-electron source produced by Raman scattering on the inner beams during peak power. We use the same plasma conditions at 18 ns that were used in the CAPTEST series (i.e. a simulation of NIF shot N120321 with the full, incident laser power on each cone), along with conditions from a HYDRA run with an initial
 $B_{z0}=70~\text{T}$
axial field and the MHD package active. The hot-electron source has a Maxwell–Jüttner energy spectrum with
 $T_{h}=30~\text{keV}$
. This temperature is from the FFLEX data at 18 ns (rise to peak power) on NIF shot N130517, which is analogous to N120321 (Robey et al.
Reference Robey, Celliers, Moody, Sater, Parham, Kozioziemski, Dylla-Spears, Ross, LePape and Ralph2014). Once peak power is reached,
 $T_{h}=18~\text{keV}$
is consistent with FFLEX data. The injected angle spectrum is
 $\text{d}N/\text{d}{\it\Omega}=\exp [-(({\it\theta}-27^{\circ })/10^{\circ })^{4}]$
, which is directed along roughly the bisector of the two NIF inner beams at
 ${\it\theta}=23.5^{\circ }$
and
 $30^{\circ }$
.
We find strong sensitivity to what field lines the hot electrons start on – namely, whether or not the field lines connect to the capsule. Hot electrons are injected in the three locations indicated as sources 1, 2 and 3 in figure 5: from
 $r=0$
to 0.06 cm at
 $z=-0.4$
cm, and from
 $r=0.12$
to 0.18 cm, at
 $z=-0.25$
and
 $-$
0.2 cm. The energy deposition versus space is plotted in figure 16, and the total into various materials is given in table 1. With no MHD, the fraction of hot-electron energy deposited to DT varies from
 $(1.2{-}3.6)\times 10^{-4}$
over the three sources. The field strongly magnetizes the hot electrons in the He fill gas for all three sources, as in the PICKET series of § 6. Also like the PICKET series electrons from source 1, in the LEH, are guided to the capsule. The deposition in DT and CH is greatly increased compared to the no-MHD case. For source 2, located deeper in the hohlraum and off axis, electrons are injected on field lines that do not connect to the capsule. The resulting deposition in He gas is significantly increased compared to the no-MHD case, while that into the CH ablator and especially the DT layer are reduced. The situation reverses for source 3, which is slightly closer to the capsule in
 $z$
than source 2. Some electrons now start on field lines that connect to the capsule, which results in much higher DT deposition. It is not presently known where in the hohlraum SRS hot electrons are produced, so we cannot say whether the field increases or decreases DT deposition. As with the PICKET series, the fraction of hot-electron energy deposited in high-
 $Z$
material is lower with the field, especially for source 1. Hard X-ray diagnostics may thus not be reliable indicators of hot electron preheat.
Hot electron energy deposition for SRSPEAK series of ZUMA runs without MHD (top
 $r>0$
) and with MHD (bottom
 $r<0$
). (a–c) plots are for source locations 1, 2, 3 indicated in figure 5.

8. Conclusions
This paper gave results of HYDRA rad-hydro simulations with no MHD effects, and with MHD and a 70 T initial axial
 $B$
field. The field is essentially frozen-in to the highly conductive plasma, and gets advected with the radial expansion of the capsule and wall. This results in field lines that roughly follow contours of ablated material. The magnetic pressure is much less than material pressure. The principal hydro effect of the field is reduced electron heat conduction perpendicular to it. This gives a hotter hohlraum fill, especially in gold, and a wider channel between the capsule and equator wall. Less inner-beam absorption occurs before they reach the wall, which increases the equatorial X-ray drive. Inner-beam Raman scattering may be reduced by the hotter fill, in addition to the lower power needed to achieve a round implosion.
We also presented hot electron propagation studies with ZUMA, using plasma conditions from HYDRA. Mono-energetic test cases with plasma conditions from early peak power (18 ns) show a minimum hot electron energy of 125 keV incident on the capsule is required to reach the DT layer. The energy coupled to the layer maximizes at 13 % for 185 keV electrons, and drops with energy above that. Using plasma conditions during the early-time picket (1 ns) with no field, we find a small fraction
 $(2\times 10^{-3})$
of hot-electron energy from a TPD-relevant source couples to DT. With a uniform 70 T axial
 $B$
field, the hot electrons are magnetized in the He fill gas, guided to the capsule and the DT coupling increases by a factor
 $12$
. This may not be a preheat concern, since picket pulse shaping has been shown on NIF to significantly decrease the hot-electron source. ZUMA simulations using plasma conditions at 18 ns, with a source motivated by inner-beam SRS, show an imposed field can greatly increase or decrease hot-electron coupling to DT. This depends on whether electrons are produced on field lines that connect to the capsule.
Imposed magnetic fields may enhance hohlraum performance by improving inner-beam propagation and reducing Raman scattering during peak laser power. This is in addition to the primary benefit of reducing electron-heat and alpha-particle loss from the hotspot. One concern is possible increase in DT fuel preheat due to the field guiding hot electrons to the capsule. Work is underway on a pulsed-power field generator for NIF, and we look forward to hohlraum experiments in the next few years.
Acknowledgements
We gratefully acknowledge fruitful conversations with H. F. Robey, J. D. Salmonson, C. A. Thomas, J. Hammer, and D. E. Hinkel. This work was performed under the auspices of the US Department of Energy by Lawrence Livermore National Laboratory under contract DE-AC52-07NA27344. Partly supported by LLNL LDRD project 14-ERD-028.