

INTRODUCTION
In contemporary sociolinguistics, language variation is considered as one of many tools people have at their disposal to convey social meaning, or as Eckert (Reference Eckert2012:91) puts it: language variation is a ‘component of a broader semiotic system’. Multiple social meanings can be associated with a linguistic variable, forming an indexical field of related meanings. Yet, which of those potential meanings is activated in interaction depends on the context in which the variable is used (Eckert Reference Eckert2008). Consequently, taking context into account should be a primary concern when studying language attitudes.Footnote 1 Several studies have tried to explore how the social meaning of language variation is moderated by different types of contextual information (e.g. Campbell-Kibler Reference Campbell-Kibler2010; Campbell-Kibler & McCullough Reference Campbell-Kibler, McCullough, Prikhodkine and Preston2015). Yet, despite their evidence that context plays a crucial role in moderating (language) attitudes, context features are often still ignored in quantitative sociolinguistic attitude research (Soukup Reference Soukup2013b).
Context dependence of language attitudes is a particularly relevant topic in the light of the recent introduction of social psychological implicit attitude measures in sociolinguistic attitude research, like affective priming (Speelman, Spruyt, Impe, & Geeraerts Reference Speelman, Spruyt, Impe and Geeraerts2013) and the Implicit Association Test (IAT; Pantos Reference Pantos2012; Campbell-Kibler Reference Campbell-Kibler2012; Rosseel, Speelman, & Geeraerts Reference Rosseel, Speelman and Geeraerts2018). An aspect shared by many of these reaction-time-based attitude measures is that they present the attitude object void of context features. This is usually the result of restrictions placed on the stimuli used in these tasks: they have to be as short as possible in order to assure that the method measures the outcome of automatic processes. The required shortness of the stimuli in these methods makes it difficult to study attitudes towards linguistic phenomena that cannot easily be captured in a short word (e.g. syntactic structures or certain intonation patterns). But it also makes it difficult to embed the linguistic variant or variety under study in a wider context—linguistic, interactional, or otherwise. Hence, the study reported in this article sets out to explore the possibilities of incorporating contextual features in the experimental design of one such social psychological measure, the Personalized Implicit Association Test (P-IAT; Olson & Fazio Reference Olson and Fazio2004). More specifically, we attempted to manipulate situational context while using the P-IAT. Despite a number of social psychological studies reporting the successful introduction of context features within the IAT paradigm, this study comes to the conclusion that including context in a linguistic version of the P-IAT is not straightforward, and further research or methodological improvement is warranted if sociolinguists intend to begin using the measure to study the influence of context on language attitudes.
Before describing the design of our study and reporting the results, we discuss previous sociolinguistic work on the context dependence of the social meaning of language variation. This is followed by a brief explanation of the P-IAT procedure and a short overview of the ways in which social psychologists have attempted to incorporate context into the design of the P-IAT. As a final part of this introduction, some background is provided about the language varieties and speech community that were part of the study, which allows us to frame the research questions and formulate hypotheses for the study.
CONTEXT AND THE SOCIAL MEANING OF LANGUAGE VARIATION
Many linguistic studies have provided evidence for the pivotal role of context in relation to the social meaning of language variation. When inspecting these studies, it becomes apparent that we can interpret context in its broadest sense, ranging from linguistic to situational context. Without attempting to provide an exhaustive typology of different types of context,Footnote 2 let us illustrate the breadth of context dependency in language attitudes by giving a few examples. First, it is well documented that various types of speaker information may affect expressions of attitudes towards a linguistic feature. Aspects like perceived social class, regional origin, profession, or gender of a speaker can impact attitudes towards that speaker's language (e.g. Campbell-Kibler Reference Campbell-Kibler2007, Reference Campbell-Kibler2009, Reference Campbell-Kibler2010; Nelson, Signorella, & Botti Reference Nelson, Signorella and Botti2016). In a recent study, Campbell-Kibler & McCullough (Reference Campbell-Kibler, McCullough, Prikhodkine and Preston2015) also demonstrated the relationship between physical features of a speaker and attitudes towards their speech: perceived accentedness was shown to influence how well participants thought a certain voice and face matched. A second type of context that plays a crucial role for the social meaning of language features is their linguistic context. The (bundles of) other linguistic features a variant co-occurs with may influence its social meaning (see e.g. Levon Reference Levon2007 on pitch range and sibilant duration in the perception of gender and sexual identity and Pharao, Maegaard, Møller, & Kristiansen Reference Pharao, Maegaard, Møller and Kristiansen2014 on the social meanings of /s/ in Danish depending on whether a variant co-occurs with features typical of Modern Copenhagen speech or typical of street language). Other varieties present during an interaction or varieties a hearer was previously exposed to can co-determine how a linguistic feature or variety is evaluated as well (e.g. Price, Fluck, & Giles Reference Price, Fluck and Giles1983; Abrams & Hogg Reference Abrams and Hogg1987; Walker, García, Cortés, & Campbell-Kibler Reference Walker, García, Cortés and Campbell-Kibler2014). A final type of context we mention here and the type that concerns the study described below is situational context (e.g. Giles & Ryan Reference Giles, Ryan, Ryan and Giles1982; Gallois & Callan Reference Gallois, Callan and Forgas1985; Cargile, Giles, Ryan, & Bradac Reference Cargile, Giles, Ryan and Bradac1994; Cargile Reference Cargile1997; Soukup Reference Soukup2013a,Reference Soukupb). Situational context has many facets, but one that is often highlighted in relation to language attitudes is the degree of formality of a situation. Street, Bradt, & Lee (Reference Street, Bradt and Lee1984), for instance, report that speakers are rated differently for competence in informal conversation compared to a more formal job interview. Similarly, Creber & Giles (Reference Creber and Giles1983) demonstrate that a formal (school) vs. informal (youth club) situational context influences status evaluations of a regional variety of English and received pronunciation (RP). Note that the different types of context mentioned above co-occur in interaction. As a result, trying to tease them apart and studying the influence on attitudes for each type of context separately will always be difficult, and to a certain extent a nonecological undertaking.
Despite the plentiful evidence available on the context dependency of language attitudes, quantitative experimental language attitude research is criticized—mainly from a qualitative, constructionist point of view—for disregarding the crucial role of interactional context (Soukup Reference Soukup2013b). Many studies present participants with stimuli that are devoid of any context: either stimuli are so short that linguistic context is limited, or no information on the speaker or situational context are provided, or both. One explanation for this is that experimental designs are often restrictive and make the inclusion of contextual information challenging. Alternatively, including contextual elements may introduce confounds or additional variation in the outcome of the experiment that is difficult to control. Yet if one aims to study the social meaning of language variation in a more ecologically valid way,Footnote 3 attempts should be made to include contextual features into the experimental design (see e.g. Pantos & Perkins Reference Pantos and Perkins2012 for their explicit attitude measurement; Vandekerckhove & Cuvelier Reference Vandekerckhove, Cuvelier, Cuvelier, du Plessis, Meeuwis and Teck2007; Labov, Ash, Ravindranath, Weldon, Baranowski, & Nagy Reference Labov, Ash, Ravindranath, Weldon, Baranowski and Nagy2011; Soukup Reference Soukup2013b).
From a theoretical point of view, how can contextual influence on the social meaning (and perception) of language be explained? To offer an answer to this question, we need an account of how language usage gets stored mentally, including the social and contextual information that was available during usage situations. One such account is exemplar theory (e.g. Pierrehumbert Reference Pierrehumbert2001; Foulkes & Docherty Reference Foulkes and Docherty2006; Hay, Nolan, & Drager Reference Hay, Nolan and Drager2006). Exemplar models of language are based on the idea that language is stored in the brain in the form of exemplars that are built on past experience. Every time linguistic input is encountered, traces of that input are stored in the brain and more abstract categories are derived from these traces. New input can alter the existing representation and old traces can erode, if not frequently activated (Squires Reference Squires2013). These cognitive representations of language not only store detailed information about the form and denotational meaning of a linguistic token, they also include knowledge about the social context it was encountered in (Foulkes & Docherty Reference Foulkes and Docherty2006). Hence, these representations comprise a network of associations between various social meanings of linguistic features and knowledge about the different types of context they occurred in. A linguistic feature presented in one context may then activate different social meanings compared to when it is presented in another context, depending on how frequently a person has encountered that feature in different social settings. So for instance, as reported by Creber & Giles (Reference Creber and Giles1983), the social meaning of RP in terms of status increased when the variety was presented in a formal context compared to when it was presented in a more informal situation. Conversely, starting from the social context rather than the linguistic information, contextual cues are drawn on by speakers in speech perception. For instance, Staum Casasanto (Reference Staum Casasanto, Love, McRae and Sloutsky2008) shows how people use social information about speaker ethnicity they have stored to resolve ambiguity following from potential d/t deletion in speech perception. To sum up, exemplar theory predicts that the encounter of a linguistic feature may activate social knowledge, and social cues may activate certain linguistic tokens (Squires Reference Squires2013).
INCORPORATING CONTEXT IN THE IAT
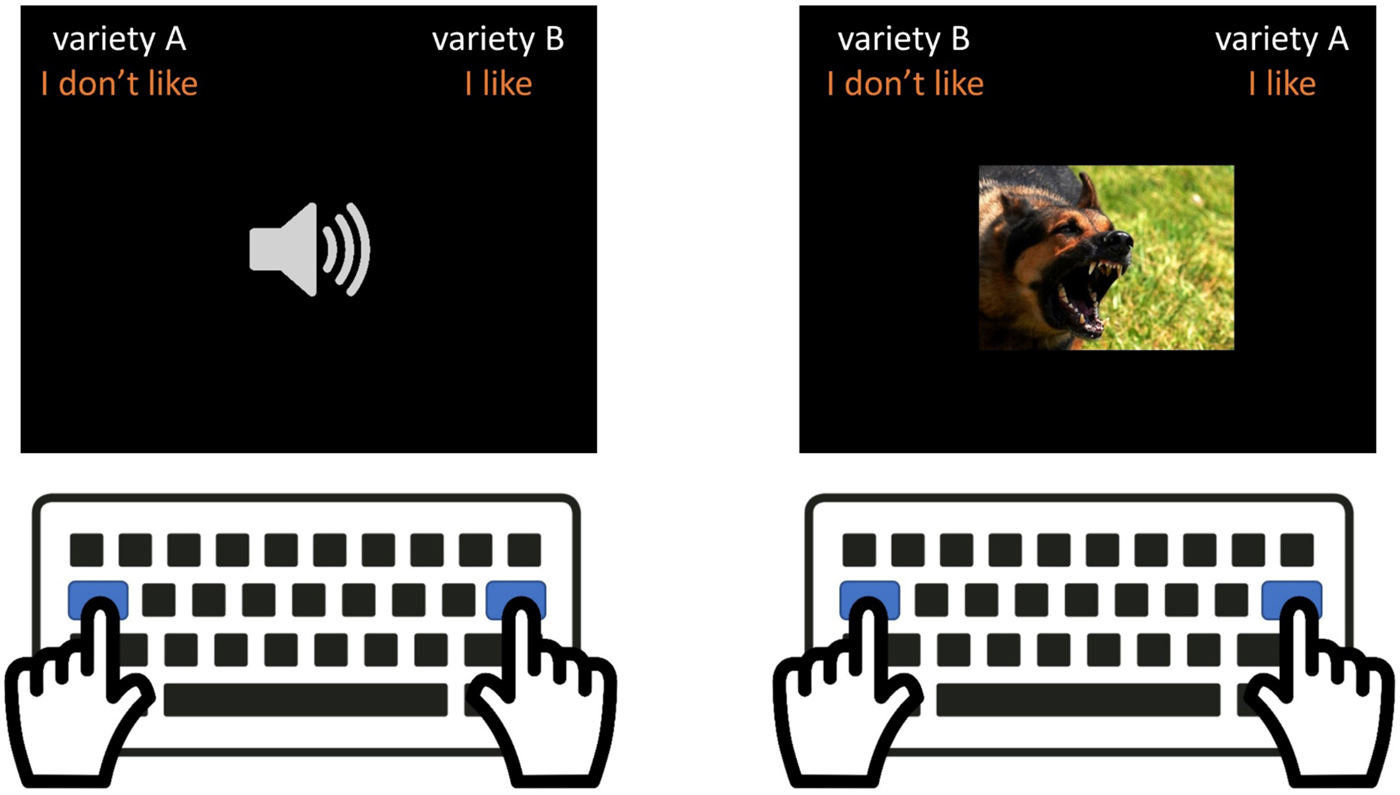
Before discussing the incorporation of context cues into the IAT, let us briefly explain how the measure works. The IAT is a reaction-time-based categorisation task that aims to measure the association between two binary concepts: a target concept representing the attitude object (e.g. two language varieties: variety A vs. variety B) and an attribute object representing some evaluative dimension (e.g. valence: good vs. bad). Participants are asked to categorise stimuli representing one of these four categories (e.g. audio stimuli representing either of the varieties and positive and negative pictures) using only two response keys. Hence each response key has two meanings, depending on whether a target or attribute stimulus has to be categorised. The meaning of these response keys is indicated by labels in the top corners of the screen (see Figure 1). The trials in the IAT are grouped in different blocks depending on how the target and attribute categories are mapped onto the response keys. Halfway through the experiment, the mapping of the response keys is reversed. If at first the left key corresponded to ‘variety A’ and ‘I don't like’ in our example and the right key to ‘variety B’ and ‘I like’, then in the second half of the experiment ‘variety B’ and ‘I don't like’ will be mapped onto the left key and ‘variety A’ and ‘I like’ onto the right key.Footnote 4 If the mapping of target and attribute categories onto the response keys corresponds to a participant's attitudes, they will be able to respond faster than if this is not the case. For instance, a participant who prefers variety A over variety B will be able to react faster when both stimuli representing variety A and positive images are to be categorised using the same response key (cf. the right pane in Figure 1). Hence, by comparing reaction times between the trials with different key mappings, one can establish how strongly participants associate the target and attribute categories. Note that in this description we have used the personalized version of the IAT (P-IAT), which uses attribute labels like ‘I like’/‘I don't like’ rather than ‘good’/‘bad’, because this is the version of the IAT that was used in the study reported below (Olson & Fazio Reference Olson and Fazio2004).Footnote 5
Schematic representation experimental blocks P-IAT.

In the section above, we have illustrated the non-negligible role of context for language attitudes and argued that context should be an integral part of language attitude experiments. Yet, the new methods to study language attitudes that have been imported from social psychology into linguistics make the inclusion of context in experimental designs challenging. These methods include affective priming (AP) (Fazio, Sanbonmatsu, Powell, & Kardes Reference Fazio, Sanbonmatsu, Powell and Kardes1986; Speelman et al. Reference Speelman, Spruyt, Impe and Geeraerts2013) and the Implicit Association Test paradigm (IAT) (Greenwald, McGhee, & Schwartz Reference Greenwald, McGhee and Schwartz1998; Redinger Reference Redinger2010; Pantos & Perkins Reference Pantos and Perkins2012). Both methods are reaction-time-based implicit attitude measures. Implicitness refers to the fact that these methods aim to measure attitudes under automatic circumstances. Automaticity comprises multiple features: unintentionality, resource-independence, uncontrollability and unconsciousness (all or some of which can be present; Gawronski & De Houwer Reference Gawronski, De Houwer, Reis and Judd2014). One important aspect of the implicit character of these methods is the availability of time (De Houwer, Teige-Mocigemba, Spruyt, & Moors Reference De Houwer, Teige-Mocigemba, Spruyt and Moors2009). Participants should have limited time to process the stimuli if the circumstances under which the attitudes are measured are to qualify as automatic. In order to ensure this, stimuli used in AP and the IAT have to be as short as possible. For linguistic stimuli, this means one is limited to short words (written or spoken), as participants need to be able to process them in a matter of milliseconds rather than seconds. As indicated above, this does not only restrict the possibility to measure associations with longer linguistic features (e.g. syntactic structures or discourse-level variables), it also restricts the options for including context in these methods. If there were ways to bring context into the design of these social psychological attitude measures, that would make them more attractive tools for sociolinguists aiming to study the social meaning of language variation in a more ecological way or for those specifically interested in investigating the impact of certain contextual cues on language attitudes.
Turning to the field of origin of these implicit measures, what is known about the relation between attitudes and context there? Social psychologists do not fully agree on the theoretical models of the cognitive status of attitudes. Some believe attitudes are stored in memory and retrieved when an attitude object is encountered (e.g. Fazio Reference Fazio2007). Others take a constructionist perspective and theorize attitudes as constructed online (e.g. Schwarz Reference Schwarz2007). In this view, external contextual input is more important when evaluating an attitude object than information stored in memory (Albarracín, Wang, Li, & Noguchi Reference Albarracín, Wang, Li, Noguchi, Crano and Prislin2008). Strong versions of this constructionist model have even argued that no information needs to be retrieved from memory at all and that each time an attitude object is encountered, the evaluation is constructed from scratch (e.g. Schwarz & Bohner Reference Schwarz, Bohner, Tesser and Schwarz2001). Still other psychologists take a more nuanced position and try to combine the memory-based and the constructionist perspective on the cognitive status of attitudes by recognizing the importance of memory, as well as that of external contextual input and online processing (e.g. Gawronski & Bodenhausen Reference Gawronski and Bodenhausen2006). Despite these different views and the different approaches they entail to explaining the relationship between context and attitudes, psychologists do generally recognise the fact that attitudes are subject to contextual influence (Gawronski & De Houwer Reference Gawronski, De Houwer, Reis and Judd2014). In that light, researchers have explored the context sensitivity of methods like AP and the IAT.
A considerable number of studies have shown that it is possible to manipulate context while using the IAT (Ferguson & Bargh Reference Ferguson, Bargh, Wittenbrink and Schwarz2007; Gawronski & Sritharan Reference Gawronski, Sritharan, Gawronski and Payne2010). These successful context manipulations can be divided into two categories: (a) experiments where context is evoked before participants take the IAT, and (b) experiments where context is brought in during the IAT procedure itself, either by manipulating the stimuli, or by including context cues in another part of the IAT procedure. The majority of studies that have manipulated context using the IAT fall in the (a) category. Within this group of studies, there is, however, still considerable variation in the way in which context cues are presented. Some studies present participants with visual materials, like pictures (Dasgupta & Greenwald Reference Dasgupta and Greenwald2001) or video fragments (Wittenbrink, Judd, & Park Reference Wittenbrink, Judd and Park2001). The latter study dealt with prejudice against Black people and asked its participants to watch a video presenting Black people in two different settings. One showed a family gathering, the other depicted a graffitied inner-city scene. Participants were then asked to produce a text about the video they saw, before starting an IAT measuring racial attitudes. Other studies had respondents listen to different types of music (Rudman & Lee Reference Rudman and Lee2002), read a text (Foroni & Mayr Reference Foroni and Mayr2005), or fill out a survey (Steele & Ambady Reference Steele and Ambady2006) to evoke particular contexts. Even instructing participants to imagine certain scenarios or qualities before starting the IAT worked to activate contextual cues (e.g. Blair, Ma, & Lenton Reference Blair, Ma; and Lenton2001, but see Gawronski & Bodenhausen Reference Gawronski and Bodenhausen2005 for some nuance). Bohner, Siebler, Gonzalez, Hayes, & Schmidt (Reference Bohner, Siebler, Gonzalez, Haye and Schmidt2008), for instance, asked binational individuals to actively think about one of their identities before completing an IAT measuring associations with both their identities. Their results showed that making one of the participants’ identities more salient, by having them think about it, influenced the outcome of the IAT (albeit only for male respondents). Finally, characteristics of people present in the experimental setting can also function as contextual cues. Lowery, Hardin, & Sinclair (Reference Lowery, Hardin and Sinclair2001) manipulated the experiment leader's ethnicity in the context of a racial attitude IAT, and reported reduced prejudice against Black people when participants interacted with a Black experimenter compared to a White one. Richeson & Ambady (Reference Richeson and Ambady2001) showed that the anticipated role in interaction (in terms of hierarchy) with someone of another ethnicity could function as a contextual cue before completing the IAT. Social role was also evoked in a study by Uhlmann & Swanson (Reference Uhlmann and Swanson2004), but they employed an aggressive video game to allow participants to assume a specific role.
The second group of studies (b) includes context cues in some part of the IAT procedure itself, rather than presenting them beforehand. Some studies have successfully manipulated how participants interpret the target category by carefully selecting the target stimuli. Mitchell, Nosek, & Banaji (Reference Mitchell, Nosek and Banaji2003) relied on additional information about the individuals who made up the target categories ‘Black’ and ‘White’ in their ethnic prejudice IAT: they used well-liked Black and disliked White persons as representatives of the two categories respectively. Similarly, Govan & Williams (Reference Govan and Williams2004) used specific target stimuli to redefine the target categories in their flower/insect, Black/White and plant/animal IATs. Gschwendner, Hofmann, & Schmitt (Reference Gschwendner, Hofmann and Schmitt2008), by contrast, did not manipulate the stimuli in their experiment. Rather, they chose to display a background picture evoking different contexts in an anxiety IAT and a racial attitude IAT. A study combining context manipulation (a) before and (b) during the IAT is Wittenbrink et al. (Reference Wittenbrink, Judd and Park2001). In addition to their video and writing task in anticipation of the IAT, they also showed snippets of the video that participants watched beforehand at random intervals during the IAT.
A final note on context and the IAT relates to the IAT's structure. Requiring a binary target and attribute category (for variations of the measure offering an alternative structure, see e.g. the overview presented in Teige-Mocigemba et al. Reference Teige-Mocigemba, Klauer, Sherman, Gawronski and Payne2010), the IAT already contextualises its target categories in the sense that attitudes to these categories are measured relative to one another. An illustration of this is found in Houben & Wiers (Reference Houben and Wiers2006). This study used IATs to measure associations with alcohol and found that alcohol associations varied depending on what was chosen as the contrasting second target category (soda vs. animals): participants’ negative associations with alcohol were significantly smaller when the contrasting target category was ‘animals’ than when the alternative was ‘soda’.
In the study below, we use a personalized version of the IAT, the P-IAT, rather than the traditional IAT. Although most studies reported above have used traditional IATs or other variants than the P-IAT, there is no reason to suspect that the P-IAT would behave any differently regarding the introduction of contextual cues.
BACKGROUND AND RESEARCH QUESTIONS
In this article, we set out to measure attitudes towards two varieties of Belgian Dutch in different situational contexts. The varieties under study are standard accented Belgian Dutch (SBD) and a variety of Colloquial Belgian Dutch (CBD), namely Limburg accented Dutch.Footnote 6 The situational contexts chosen for the study are formal vs. informal settings. To understand this choice of varieties and situations, some background on language variation in Dutch-speaking Belgium is required. The stratificational structure of Dutch in Belgium can be described as a diaglossic situation, to use Auer's (Reference Auer, Delbecque, Van der Auwera and Geeraerts2005) classification (Geeraerts & Van de Velde Reference Geeraerts, Van de Velde, Hinskens and Taeldeman2013; Ghyselen Reference Ghyselen2016; Geeraerts Reference Geeraerts and De Sutter2017). There is a continuum with the local base dialects on one end and SBD on the other. CBD is to be situated on the continuum between the two extreme ends. This variety includes features of all linguistic levels that may co-occur in different combinations, and that differ in their degree of colloquiality. This makes it difficult to delineate the variety and allows it to move closer to either end of the continuum (toward the SBD pole in the case of fewer and less colloquial features or toward the dialect pole in the case of many or highly colloquial/regional features; Geeraerts & Van de Velde Reference Geeraerts, Van de Velde, Hinskens and Taeldeman2013; Geeraerts Reference Geeraerts and De Sutter2017). CBD is also characterised by regionally flavoured accents (Geeraerts & Van de Velde Reference Geeraerts, Van de Velde, Hinskens and Taeldeman2013). Given that the P-IAT limits the length of the stimuli that can be used, it was decided to use two-syllable words that were recorded in the accents representing the two varieties under study. Hence, the linguistic features included in the stimuli were restricted to phonetic and intonational features.
Previous research on language production has linked the varieties discussed above to a continuum of situational settings and frames reaching from highly informal on the side of the local dialects, to strictly formal at the end of the standard variety (Plevoets Reference Plevoets2008; de Caluwe Reference De Caluwe2009; Geeraerts & Van de Velde Reference Geeraerts, Van de Velde, Hinskens and Taeldeman2013; Van Hoof Reference Van Hoof2013; Van De Mieroop, Zenner, & Marzo Reference Van De Mieroop, Zenner and Marzo2016). Additionally, there is some perception research that points in the same direction: Lybaert (Reference Lybaert2014) found that the participants she interviewed about their perception of SBD, CBD, and dialect generally indicated they thought SBD was the variety par excellence for formal situations, particularly for news broadcasts. CBD was associated with informal situations, although there was more variation in participants’ responses here. Multiple respondents explicitly dismissed its use in highly formal contexts like news broadcasts on TV or radio. Regional dialect was only deemed suitable in the most informal and private settings. In a similar vein, Delarue & Lybaert (Reference Delarue and Lybaert2016:254) report that Flemish school teachers say they try to use SBD in formal settings (e.g. giving instructions), but prefer using CBD in more informal interactions with their pupils. Building on exemplar theory (cf. supra), we can explain this link between production and perception: if speakers regularly encounter a variety in a certain situational context, they will store traces of this contextual information alongside other information about the variety and hence will come to associate the variety and situational context. Based on this, we expected participants in our study to link the two varieties under scrutiny more strongly with positive valence when they are presented in their respective situational contexts.
The concrete situations that were chosen to represent formal and informal contexts in our study were TV news broadcasts and socialising (having food or drinks) with friends and family. Note that some linguists (e.g. De Caluwe Reference De Caluwe2009) believe that CBD is entering domains that used to be the exclusive territory of SBD. Yet, the situational context that all researchers seem to agree is immune to this supposed invasion is the TV newscast. In Flanders, SBD is strongly associated with TV and radio news, especially with the news on VRT, the Flemish public broadcasting company, which is notorious for monitoring its newscasters’ language (Grondelaers, Van Hout, & Van Gent Reference Grondelaers, van Hout and van Gent2016). No deviation from SBD is accepted in this context in Flanders: also local channels aim for the most regulated form of SBD. As mentioned above, evidence of this link was also found in Lybaert (Reference Lybaert2014) where participants of different ages identified TV news as the context par excellence where they expect the purest form of SBD. As a result, we decided that TV newscasts would be the situational context that most strongly evokes a formal setting that is related with SBD.
Based on the above, the following research questions were formulated.
(i) Can we find evidence that SBD is positively evaluated in formal situations and CBD in informal situations?
(ii) Is it possible to measure these context-dependent language attitudes using the P-IAT?
(iii) What is the most efficient way to implement situational context in the P-IAT?
In order to formulate an answer to these questions, a study was carried out that included an implicit measurement of attitudes towards SBD and CBD in a formal vs. informal context using the P-IAT, as well as an explicit attitude measurement involving the same varieties and contexts. This second measurement was included to serve as a point of comparison to assess the results obtained in the P-IAT. In order to get a better understanding of how situational context can best be included in a P-IAT, contextual cues were incorporated in two different ways (for details see Method below). Given there was no reason to assume a discrepancy between implicit and explicit attitudes, we expected to find positive attitudes towards SBD in the formal context and positive attitudes towards CBD in the informal context. As for the type of context cues, the study was of an explorative nature and no specific hypotheses were formulated as to which way of including the context cues would be the most successful. Note that in order to control for in- or out-group biases (as reported, for instance, by Rosseel et al. Reference Rosseel, Speelman and Geeraerts2018), it was decided to only recruit participants from the Limburg region of Belgium whose regional variety represented CBD in this study.
METHOD
Participants
In total, 161 participants took part in the study. All were students in higher education recruited at the University of Leuven who spent most of their childhood and teenage life in Limburg, the easternmost province of Flanders. The sample was roughly balanced for gender and age (55% female; M age = 20.96). One participant was removed from the analyses, as they did not complete all tasks in the experiment. Additionally, nine participants were removed from the sample due to the high number of mistakes they made during the P-IAT (i.e. >20%; Greenwald, Nosek, & Banaji Reference Greenwald, Nosek and Banaji2003; Gawronski, Deutsch, & Banse Reference Gawronski, Deutsch, Banse, Klauer, Voss and Stahl2011).
Design and procedure
Participants first completed two P-IATs that measured their positive/negative associations with Limburg-accented speech, their own regional variety of Dutch, compared to SBD. The two P-IATs were manipulated for formality of context: one test contained pictures suggestive of informal settings, while the other evoked formal situations. The order of presentation of the two contexts was controlled between participants: half started with the informal context, the other half with the formal context. Additionally, we tested two ways in which pictures were used to represent situational context: displaying a background picture throughout the categorisation tasks of the P-IAT (cf. Gschwendner et al. Reference Gschwendner, Hofmann and Schmitt2008) versus alternating the different blocks of the P-IAT with short sequences of multiple pictures evoking the same situational contexts.Footnote 7 The type of context presentation was a between-subject manipulation as well. After completing the two P-IATs, participants were asked to fill out a brief questionnaire containing both explicit attitude rating scales and basic demographic questions. This last set of questions allowed us to make sure the sample was more or less homogeneous in terms of gender, age, and regional background. Finally, respondents were fully debriefed about the study.
The experiments were completed individually in quiet, dimly lit rooms on laptops with 1366 x 768 resolution screens using Affect 4.0 (Spruyt, Clarysse, Vansteenwegen, Baeyens, & Hermans Reference Spruyt, Clarysse, Vansteenwegen, Baeyens and Hermans2010). For the auditory stimuli in the P-IATs, a Jabra UC VOICE 150 MS Duo headset was used. Explicit attitude ratings and the questionnaire collecting demographic information were completed on paper.
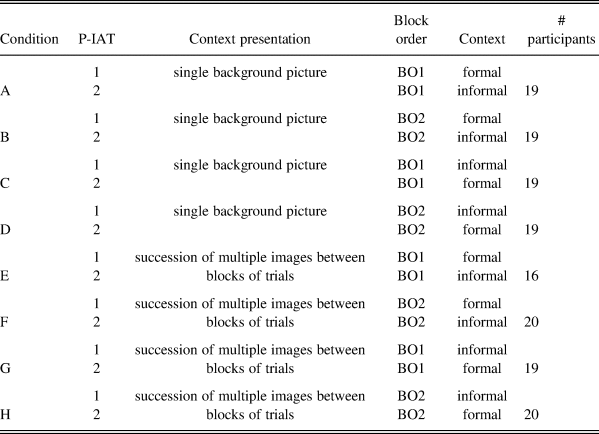
The design of the experiment, including participant numbers, is summarised in Table 1. Note that there are eight different conditions (A-H) in the experiment as a result of counterbalancing for three aspects. Two were already mentioned above: (i) context order (under ‘context’ in Table 1) and (ii) type of context presentation. A third variable that was controlled for is block order. It is known that the (P-)IAT produces larger effects if the congruent block precedes the incongruent block, hence block order was controlled for between participants (Teige-Mocigemba et al. Reference Teige-Mocigemba, Klauer, Sherman, Gawronski and Payne2010). The two block orders are presented in Table 1 as BO1 (i.e. response key mapping in the first experimental block: SBD/positive – CBD/negative) and BO2 (i.e. response key mapping in the first experimental block: CBD/positive – SBD/negative). Note that the type of context (formal vs. informal) was a within-subject manipulation.
Experimental design with participant numbers.

Materials
The P-IAT requires two types of stimuli: (i) target stimuli that represent the target concept (i.e. language variety) and (ii) attribute stimuli representative of the attribute concept (i.e. valence). Hence, we needed target stimuli for both the regional and the standard variety, and positively and negatively valenced attribute stimuli.
For the target category, we used a set of auditory stimuli. To be suitable, the words we selected as stimuli had to meet a number of criteria regarding length, frequency, semantics, and phonetic structure. First, the P-IAT requires its stimuli to be short in order not to diminish the automatic character of the associations it measures. Hence we limited the length of the target stimuli to two syllables. Second, we avoided words with a low frequency (no words with under fifty occurrences per million words). Then, regarding semantics, the target words had to be neutral (average ratings between 3.5 and 4.5 on a seven-point rating scale) and not refer to the situational contexts under study, in order to avoid confounds with either the attribute concept or the context factor respectively. For both frequency counts and information on valence, norm data collected by Moors, De Houwer, Hermans, Wanmaker, Van Schie, Van Harmelen, De Schryver, De Winne, & Brysbaert (Reference Moors, De Houwer, Hermans, Wanmaker, van Schie, Van Harmelen, De Schryver, De Winne and Brysbaert2013) were consulted. Finally, the stimuli needed to contain phonemes that have a distinctive realisation in the Limburg regiolect compared to SBD, as well as to other regional varieties in Belgium. A list of phonetic variables that meet this criterion was compiled using modern pronunciation manuals that aim to teach their readers how to mask their regional accent (Van Maele Reference Van Maele1984; Huybrechts, Decoster, Goeleven, Lembrechts, Manders, & Zink Reference Huybrechts, Decoster, Goeleven, Lembrechts, Manders and Zink1998, Reference Huybrechts, Decoster, Goeleven, Lembrechts, Manders and Zink1999; Timmermans Reference Timmermans2008; Fraeters & Van Avermaet Reference Fraeters and Van Avermaet2010). In total, 203 words with up to three loci for regional pronunciation and satisfying all other criteria were collected.
All 203 words were recorded by five male speakers from different parts of Limburg, who still lived in the area or had spent most of their life there. Each speaker produced both a regional and a standard realisation of every word. For the regiolect guise, they were instructed to speak as if they were talking to someone from Limburg, but not from their own locality, while for the SBD guise they were asked to produce a standard pronunciation aiming for the speech of news anchors on TV or radio. They were not instructed about any specific variables in order to obtain speech samples that were as naturally sounding as possible.
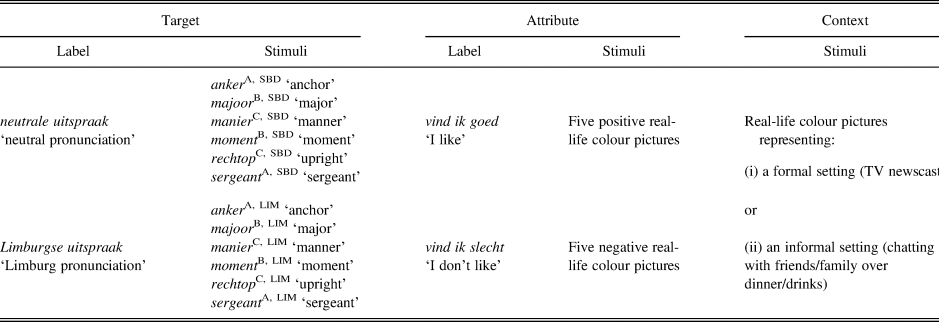
Out of the recordings, an initial selection of words containing maximally regional/standard variable realisations was made by the first author. This first selection of stimuli was subsequently rated by a sample of five nonlinguistically trained listener-judges on how recognisable they were as either Limburg accented or standard accented speech. Stimuli from three speakers were discarded, either because the listener-judges commented on the speaker's quality of voice or because the distinction between their two guises was not clear enough to the untrained ear. Based on those ratings, six words, produced by three different speakers, were selected as target stimuli (see Table 2).
Stimulus set.

A produced by speaker A, B produced by speaker B, C produced by speaker C,
SBD realised in the SBD guise, LIM realised in the regional guise
As discussed above, SBD and CBD form a continuum. As a result, it is crucial to guarantee that the target stimuli adequately and univocally represent both varieties. The strategy for selecting the stimuli outlined above combines production (linguistic variables that have clearly distinct realisations in both varieties) and perception criteria (recognition pretest by laypeople to ensure this was the case). This guaranteed that the target stimuli were immediately recognisable for participants as representing one of the two varieties and hence easy to categorise.
The set of attribute stimuli consisted of five positive and five negative real-life colour photographs. They were selected from a set of pictures for which norm data on valence had been collected in previous studies (Spruyt, Hermans, De Houwer, & Eelen Reference Spruyt, Hermans, De Houwer and Eelen2002). All pictures measured 410 x 308 pixels.
For the stimuli used to prime situational context, we selected a set of real-life pictures representing either a formal (TV news) or an informal context (socializing with friends and family). In order to avoid unwanted effects due to associations with certain Belgian news anchors or TV channels, we used pictures of foreign news anchors and broadcasting studios that participants were unlikely to be familiar with, but that were highly recognisable as TV news settings for our Belgian participants. All logos and headlines were removed from the stimuli to make them look as generic as possible. For the informal setting, pictures of friends and family gathering for drinks or dinner were used. For each situational context, sixteen pictures were selected. As indicated above, context was primed in two ways in the experiment: for half of the participants the sixteen context pictures were displayed between the blocks of the P-IAT; for the other half, one picture was used as a backdrop during all blocks. In the former condition, each picture was displayed for 800 ms with a 100 ms interval between pictures.
The explicit attitude measurement was carried out using two types of seven-point semantic differential scales (see the appendix). On the one hand, participants were presented with a relative rating task in which they had to indicate which variety they preferred in each of the two contexts (rating scales a in the appendix). This rating scale was designed to mimic the relative nature of the P-IAT as closely as possible. On the other hand, we provided two absolute rating scales, so participants could evaluate each variety separately in both contexts (rating scales b and c in the appendix). The motivation for including these additional absolute rating scales was to give participants the opportunity to express, for instance, positive attitudes towards both varieties, which is impossible in the forced-choice task implied in the relative rating scales.
Analysis
Reaction times recorded in the P-IATs were used to calculate D scores using the D6 algorithm (Greenwald et al. Reference Greenwald, Nosek and Banaji2003; Martin Reference Martin2015). D scores are average difference scores between the experimental blocks that take into account individual differences in speed and add a penalty for incorrect responses. In the results below, positive D scores indicate a preference for SBD while negative scores indicate a stronger association between the regional variety and liking. When the D score equals zero, that is, when participants reacted equally fast in both experimental blocks, there is no association in either direction or the association between target and attribute categories is equally strong.
To measure the effect of context, we calculated a difference score between the D scores in participants’ formal and informal P-IAT (Econtext = Dfor – Dinf). In other words, we compared participants’ relative preference for standard vs. Limburg-accented speech in the formal context (Dfor) with the relative preference for standard vs. Limburg-accented speech in the informal context (Dinf). As explained above, positive values of Dfor and Dinf indicate a preference for SBD vs. the regional variety in the formal and informal context respectively. Positive Econtext scores then represent higher D scores in formal contexts compared to informal contexts and indicate behaviour that aligns with what we hypothesize. Negative Econtext scores indicate the opposite and a score equalling zero means no effect of the context manipulation at all. Positive Econtext scores can stem from three possible scenarios: (i) the respondent has a relative preference for the regional variety in the informal context and shifts towards a preference for SBD in the formal context; (ii) the respondent has an overall preference for the regional accent in both contexts, but that preference diminishes in the formal context; and (iii) the respondent has an overall preference for SBD, but that preference is stronger in the formal context. All three scenarios are considered together here and regarded as the hypothesized context effect. The reason why we are not distinguishing between the three scenarios in the analysis is that they are defined in reference to a D score of zero. This is, however, not an absolute benchmark or neutral reference point, hence it should be approached with some caution.
RESULTS
Implicit attitude measurement
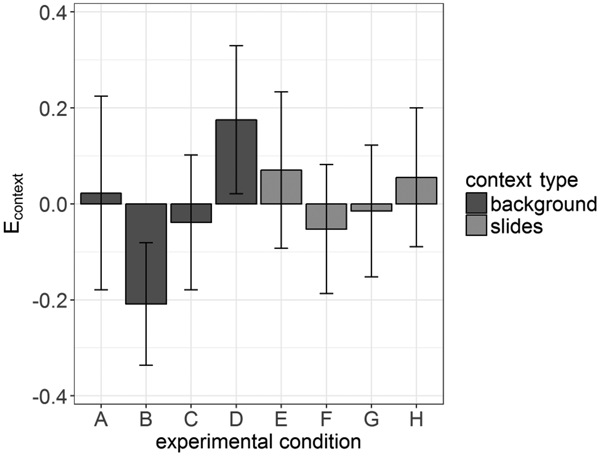
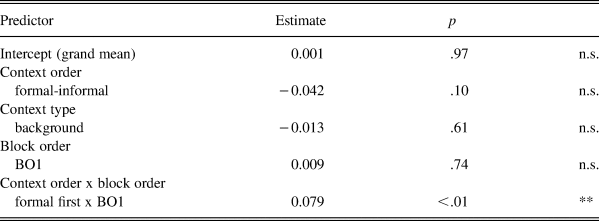
The mean Econtext scores per condition are visually summarised in Figure 2. In order to establish whether a context effect was measured and whether there were any mediating factors in the design, a linear regression model was built with the difference score between the formal and informal P-IAT (Econtext) as the response variable and context type (background vs. slides), context order (formal-informal vs. informal-formal), block order (BO1 vs. BO2) and the interaction between the latter two as fixed effects (see Table 3).Footnote 8 As sum coding was used in the model, the intercept reflects the grand mean. The fact that the intercept is not significant indicates that no overall context effect could be observed. Furthermore, the type of context presentation did not have a significant effect either.
Mean difference scores (Econtext = Dfor – Dinf) plotted per experimental condition (see Table 1 for an overview of the conditions). Positive scores indicate behaviour in line with the hypotheses. Negative scores indicate the opposite trend.

Summary of the linear regression model with difference scores between the formal and informal P-IAT (Econtext) as the response variable. Positive difference scores indicate behaviour in line with the hypotheses. Negative scores indicate the opposite pattern.

Model statistics: Adjusted R² = .056; F = 3.22, p = .015
significance codes: 0 ‘***’ .001 ‘**’ .01 ‘*’ .05 ‘.’ .1 ‘n.s.’ 1
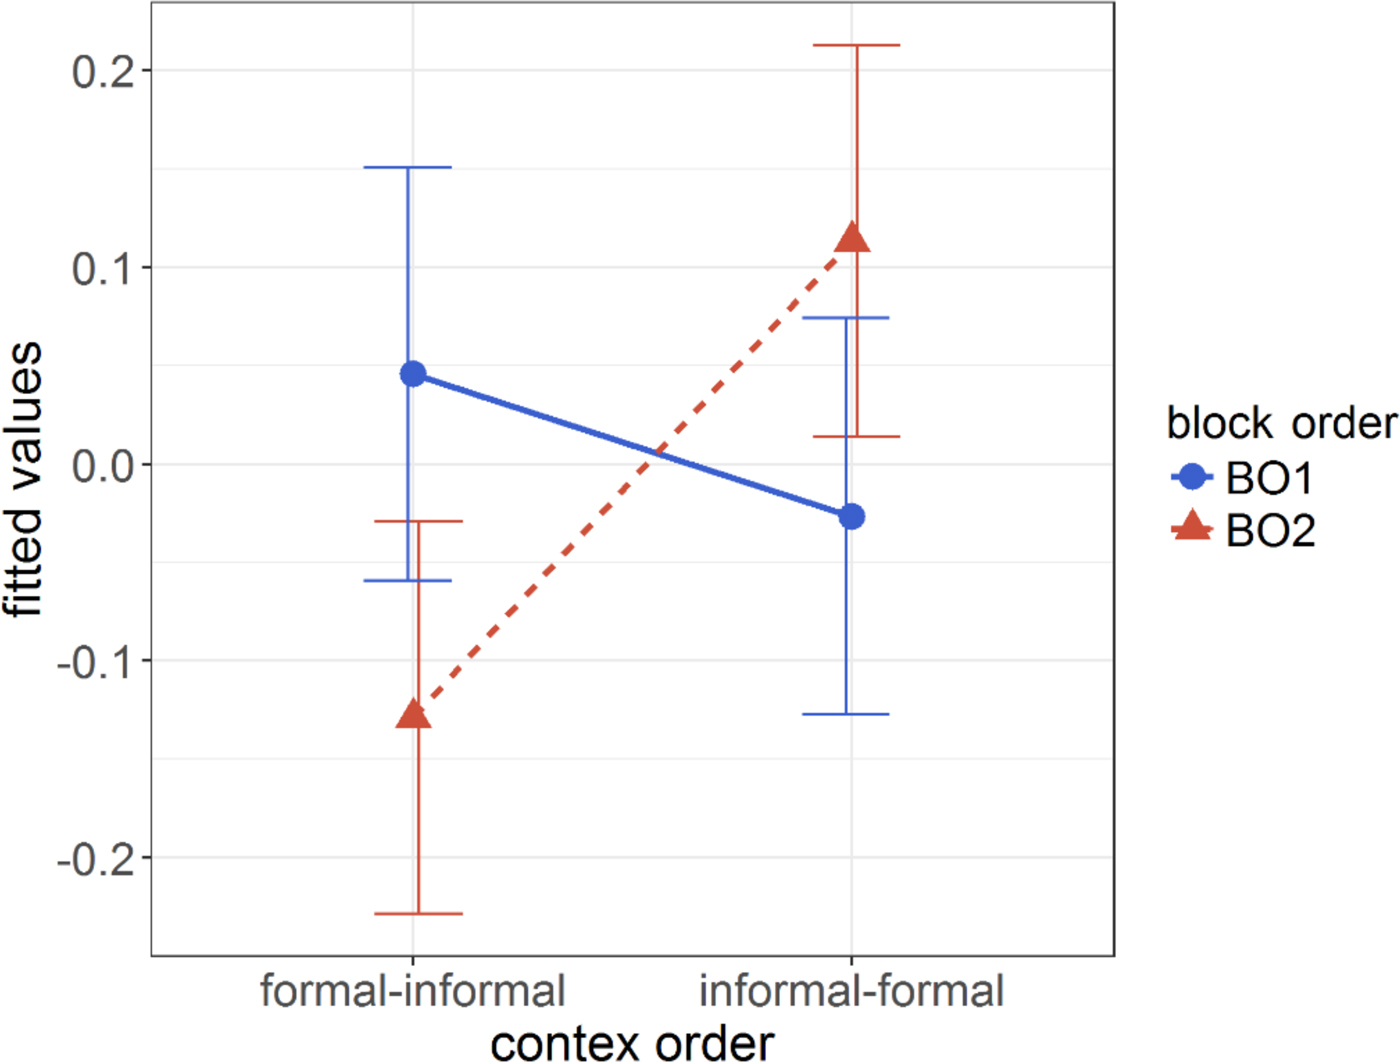
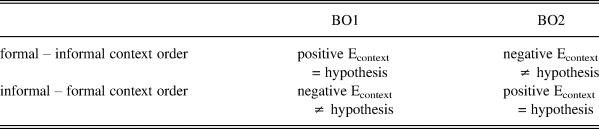
The regression model shows a significant interaction between context order and block order. Mean positive difference scores, which indicate participants behave as predicted by our hypothesis (i.e. that formal contexts increase preference for SBD and informal contexts increase preference for the regional variety), are only observed when block order 1 (BO1) is combined with formal-informal context order or when block order 2 (BO2) occurs with informal-formal context order (see Figure 3 for a visualisation of the interaction effect; alternatively, the interaction is also visible in Figure 2 and summarised in Table 4). This pattern of block orders and context orders corresponds to the cases where the combination of block order and the context offered in the first P-IAT aligns with our hypothesis. As explained above, the IAT is known to produce larger effects if the first block is the congruent block, that is, the block that is in agreement with a participant's attitudes. In this experimental design, block order 1 (BO1) is the congruent block order for participants who prefer SBD over the regional variety. According to our hypothesis, this situation particularly matches formal contexts. Conversely, block order 2 (BO2) starts with the congruent block if the Limburg accent is preferred over the standard one, which we predicted to be particularly the case in informal contexts. In other words, we do observe the predicted context effect, but only if all factors in the experimental design create the most favourable conditions to do so.
Effects plot showing the interaction of context order and block order.
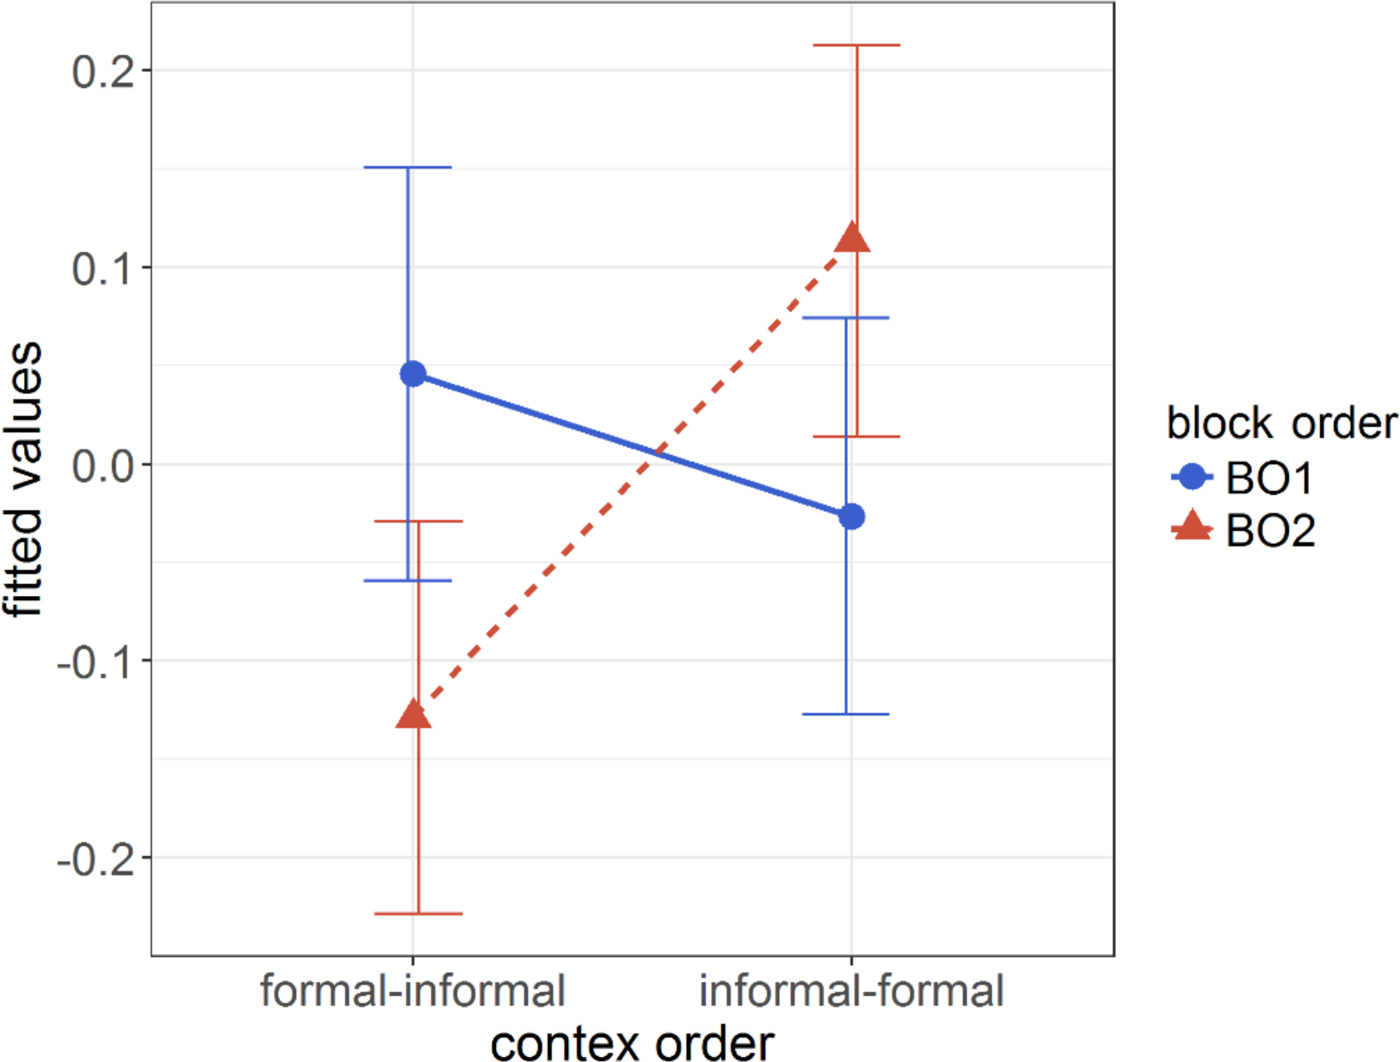
Summary of the interaction between context order and block order in the regression model presented in Table 3.

BO1: first experimental block has SBD/positive and CBD/negative key mapping
BO2: first experimental block has CBD/positive and SBD/negative key mapping
In order to make sure a potential context effect was not masked by fatigue or practice effects due to the participants having to complete two subsequent P-IATs, we analysed the data of the first P-IAT separately. This means the experimental design was reinterpreted from a within-subject context manipulation to a between-subject one. No evidence was found to suggest that that was the case.
Explicit attitude measurement
Prior to the analysis of the explicit attitude measurement, we discarded the data obtained from participants who we suspected may have misinterpreted the rating task. These participants showed discrepancies in their ratings on the relative and absolute scales that seemed to indicate that they confused the ‘negative’–‘positive’ labels on either end of the absolute scales. This suspicion was further backed by the fact that a few participants apologized for handing in a rather messy form after completing the experiment, as they had corrected their answers after misreading the scales. Of course this is a post hoc interpretation and we cannot be certain it is correct. Thus, we concluded it would be safer not to include the data in question in the analysis. This lead to the exclusion of the data provided by twenty-three participants. Additionally, one participant forgot to complete the explicit rating task, leaving a total of 128 participants for this analysis.
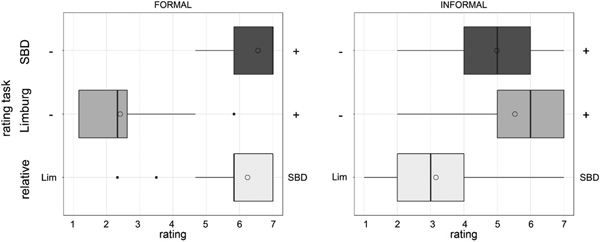
As explained above, both the SBD and Limburg accent were rated for formal and informal contexts in two ways: (i) comparing both varieties on a relative seven-point rating scale and (ii) evaluating each variety separately on an absolute seven-point rating scale (see the appendix). Contrary to the implicit measurement, the explicit rating task shows a clear context effect, both for the relative and absolute rating scales (see Figure 4). When asked to rate both accents compared to each other, participants strongly preferred the standard accent in formal contexts (M = 6.27, SE = 0.08) and showed a slight preference for the regional accent in informal contexts (M = 3.14, SE = 0.14, cf. the bottom row of boxplots in Figure 4). A paired t-test with Bonferroni correction indicates that this context effect is significant and substantial (t(127) = −22.34, p < .001, r = .89).
Boxplots summarising the results from the absolute (two upper boxplots) and relative (bottom boxplot) rating tasks in formal (left plot) and informal (right plot) contexts. Lower scores on the relative scales indicate a preference for the regional accent, higher scores for the standard accent. For the two absolute scales, lower scores correspond to more negative evalutations of the respective varieties, higher scores to more positive ones.

Turning to the absolute ratings of each variety separately, we can observe a different pattern in the formal and informal context (see the upper two rows of boxplots in Figure 4). In a formal context, SBD is viewed very positively (M = 6.54, SE = 0.05), while the regional variety is evaluated extremely negatively (M = 2.44, SE = 0.11). Again this is a large and significant effect (t(127) = −34.13, p < .001, r = .95) that is in line with what we predicted to find. In the informal context, the regional accent receives the highest mean score (M informal = 5.51, SE = 0.12 vs. M formal = 4.98, SE = 0.12, t(127) = −3.11, p < .01, r = .27). However, the standard accent is rated quite positively as well, which does not align with what we hypothesized.
Correlation analysis implicit-explicit attitude measurement
To study the correlation between the implicit and explicit attitude measurement, Spearman's rho was computed and tested per experimental condition for each explicit rating scale with the D score of the corresponding P-IAT. For instance, for condition A, we first calculated the correlation coefficients between each of the three rating scales (two absolute and one relative) in the formal context and the D score of the first P-IAT, which corresponded to the one presenting the formal context in this condition. Next, we calculated the correlation between each of the three informal explicit rating scales and the D scores for the second (informal) P-IAT.
Overall, the correlations between the two types of measurements were weak to moderate and the majority were not statistically significant. Hence, it is hard to draw any conclusions or make generalizations about the relationship between the implicit and explicit attitude measurements. However, there was a trend for the relative explicit ratings and the absolute explicit ratings of SBD to be positively correlated with the D scores, while the explicit rating of the regional accent tended to be negatively correlated with the implicit measure. In other words, the implicit and explicit evaluations point in the same direction: a stronger explicit preference for the standard accent was associated with a stronger implicit preference for this variety and similarly for the regional variety. This was the case regardless of context. Note though that these are mere trends, as in most cases the correlations were not strong or significant.
DISCUSSION
Why did we find a context effect in the explicit attitude measurement, but only one in interaction with context order and block order in the implicit attitude measurement? In this section we discuss two potential avenues for explaining the results reported above. First, possible methodological issues are raised, followed by a suggestion to review the hypothesis we started out with. As a final part of this section, we briefly reflect on the implications of our results for the interpretation of the sociolinguistic situation in Belgium against the backdrop of the current (de)standardization debate in the European context.
The absence of a context effect in the P-IAT experiments may be the result of methodological choices in the experimental design. One locus for such issues are the experimental stimuli. Although we did some preliminary testing on the selection of stimuli representing the formal and informal context, it is possible these were not suitable for evoking the desired contexts. For instance, we deliberately avoided pictures of Belgian news studios for the formal context in order to avoid biasing the results due to confounding associations with certain newsreaders or TV channels. Yet, the alternative of using foreign news studios may not have led to the evocation of the formal context we hypothesized the participants would associate with SBD. On the side of the informal stimuli, we aimed to evoke situations where participants interact with local friends and family during drinks or dinner. However, some participants may have activated experiences of informal contexts with friends from other regions or family that lives in a different area of the country. In those cases, the use of a regional accent that does not match the accent of the interlocutors may not necessarily be viewed positively, despite the informality of the situation. Other possibilities are that the way of presenting the stimuli was not optimal and as a result the desired contexts were not activated. Maybe context is better evoked using stimuli of a different modality (e.g. the theme tune of the TV news). Or perhaps a more successful approach is to present the context through a separate task preceding the experiment rather than by showing pictures during the P-IAT. That way participants may be forced to actively engage with the situational contexts under study, which would rule out the possibility that some participants ignored the context pictures as they were not relevant for the task.Footnote 9 Having participants engage more actively with the contextual stimuli may also lead them to evoke personal experiences that could help to activate the desired situational contexts. An approach like this would be more similar to the method employed in Wittenbrink et al. (Reference Wittenbrink, Judd and Park2001, cf. above).
Besides issues with the contextual stimuli, we can also wonder whether the linguistic stimuli may have influenced the outcome of the study. Future research could, for instance, replicate the study using a local dialect rather than CBD as a contrast category for the standard variety. As local dialects are situated further down the linguistic continuum, they may generate a starker contrast with SBD regarding contextual use. However, using a local dialect entails practical problems that threaten the feasibility of the study. If the colloquial variety is to represent the participant's own variety, as was the case in this study, one has to take into account that a local dialect is not part of every participant's repertoire and that there is considerable variation between these dialects. The advantage of CBD, as used in this study, is that it can be assumed to be part of the repertoire of the entire respondent group targeted here and that it covers a larger territory. A final methodological consideration is the possibility that the context of the experiment itself (a university setting) played a role and influenced participants in different ways.Footnote 10
A second way to explain the absence of a context effect is that our initial hypothesis was too coarse to capture the more fine-grained reality of the social meaning of the language varieties under study. We suspect there may be an asymmetry in the context effect. It could be the case that participants are ambivalent to both varieties in both contexts. The regional variety allows the speaker to better express their identity, yet it is not very ‘proper’, while the standard does offer the potential to sound more competent/prestigious, but may come across as boring or lacking any individuality. Yet, this ambivalence may be stronger in the informal context than in the formal context where the standard is almost exclusively viewed positively. This situation can clearly be observed in the outcome of the explicit measurement where SBD was perceived positively as well as CBD in the informal context.
In addition, the context manipulation may have a different impact on participants with a different degree of ‘norm sensitivity’. It could be the case that people who care more about what is expected by a prescriptivist perspective on language variation where each variety is strictly confined to its own domain, are more susceptible to the context cues in the experiments. This mindset can also be interpreted as a form of ambivalence: these participants hold both positive and negative attitudes towards a variety (depending on whether it is used in the appropriate context). Psychological research on ambivalence has found that ambivalent people tend to draw more on contextual cues, as these may help them to resolve their ambivalence in a specific situation (Petty & Briñol Reference Petty, Briñol, Petty, Fazio and Briññol2009). This supports our hypothesis about the mediating role of norm sensitivity. Unfortunately, our study did not include a measure of norm sensitivity. Our best option to get a first idea of whether norm sensitivity/ambivalence does indeed mediate the context effect in our P-IATs was to take the explicit ratings as a proxy. Participants were divided in three groups based on how much their absolute explicit ratings diverged for each variety between the two contexts. The first group consisted of nonambivalent participants (difference score between the absolute ratings in each context of 0 or 1). The second set of participants were highly ambivalent (ratings that are four or more points apart between the formal and informal setting). The third group of participants lies in between these two: they are ambivalent to some extent, but not as outspoken and the second group. Using these criteria, each participant received a qualification as not/moderately/highly ambivalent for the regional variety and not/moderately/highly ambivalent for SBD.Footnote 11
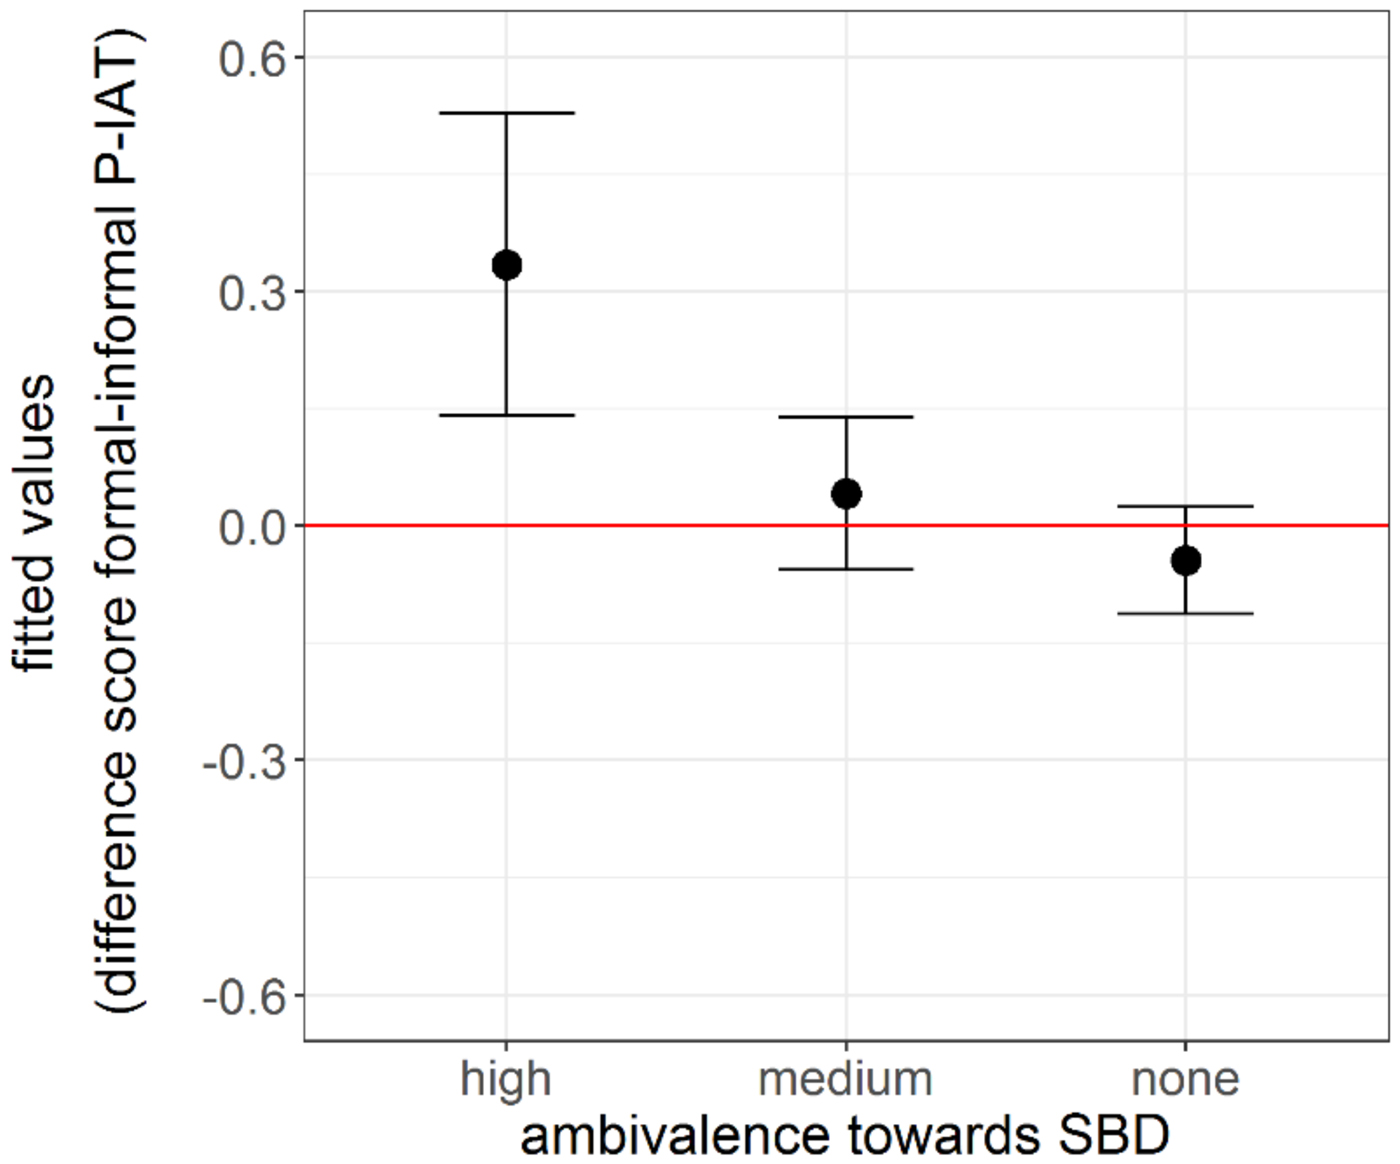
Ambivalence to the regional variety does not seem to have an impact on the context effect in the P-IATs. Ambivalence towards the standard variety, however, mediates the context effect as expected: participants who are highly ambivalent towards SBD exhibit the predicted context effect, while the other groups do not (see Figure 5). Adding ambivalence towards SBD and Limburg-accented speech to the regression model for the implicit measurement shows a significant main effect for ambivalence towards SBD, but not towards the regional variety. Ambivalence towards SBD contributes significantly to the model (F = 7.79, p < .001) and its addition improves the amount of variance explained by the model from adjusted R 2 = .04 to adjusted R 2 = .15. Note though that the group of participants that are classified as highly ambivalent is rather small (N = 10). Hence some caution is warranted regarding the observations reported above and more research on the relationship between language attitudes and ambivalence is needed before drawing any conclusion.
Effects plot showing the context effect (Econtext, i.e. the difference score between the formal and informal P-IAT) for participants with different degrees of ambivalence towards SBD.

Given that our experimental design was based on an initial hypothesis that may have been too crude, it is possible that we were not able to measure any asymmetric context effects. It may be necessary to refine the experimental design, so we can test what we think could be a more accurate version of our hypothesis. One way of improving the design could be to include a baseline context in addition to a formal and informal context. This baseline would have to be neutral regarding situational formality. Measuring attitudes in this condition would then provide a benchmark against which the impact of adding a formal or informal context to the experiment can be described more precisely. Note though, that operationalizing a neutral context may not be straightforward and that the addition of a third context type requires a more complex experimental design. That is to say, completing three P-IATs in a row may well be too exhausting for participants. Additionally, several measures for norm sensitivity should be introduced as well, since norm sensitivity may influence the extent to which participants take into account contextual cues as well as determine whether context is an important mediating factor in their attitude towards a regional vs. standard accent. Something also worth considering is that the IAT paradigm may not provide the most suitable methods to study context effects on the social meaning of language variation. Although, of course, our experiment can in no way prove that the IAT is insensitive to context—and previous social psychological work has shown that it is sensitive to context—the study does give an indication that it is not straightforward to successfully study the influence of situational context on language attitudes within the IAT paradigm.
As a final consideration about why we could only find a context effect on implicit attitudes in interaction with context order and block order, it is of course possible that situational context has no influence on these attitudes, hence making it impossible to measure it. However, taking into account a number of studies linking the production of Dutch language variation to situational context (see above), combined with our own results for the explicit measurement that show a clear context effect,Footnote 12 this is not a likely explanation. Yet, perception research on this topic could certainly benefit from more insights into current production patterns: Is there still a strict distinction between the use of regionally and standard accented speech in different informal and formal settings? Is there evidence for the often heard statement that nonstandard usage is creeping into contexts that used to be the sole domain of the standard variety? This would allow research on the social meaning of language variation to be more confident/specific in building hypotheses and designing suitable experiment designs. Specifically from the perspective of exemplar theory, production research on the co-occurrence of language and certain contextual features could contribute to a better understanding of which associations we can expect between language and social meaning. Likewise, production research on this topic could benefit from more studies into the social meaning of language variation that take into account situational or other types of contexts in that these studies may provide explanatory potential for certain patterns of variation and change.
After discussing the context effects in our study with a focus on its methodological implications, let us now turn to what it tells us about the sociolinguistic situation in Belgium and, more precisely, the position of SBD and CBD in the linguistic landscape there. How can this study (and other attitudinal studies) bear on the ongoing discussion about the vitality of the latter variety which would pose a threat to the former's position as the standard variety? Prior work (e.g. Grondelaers & Speelman Reference Grondelaers and Speelman2013) has suggested that Flanders is characterised by a strong standard language ideology (SLI) entailing highly positive attitudes towards SBD that are situated ‘on the surface’ of sociolinguistic awareness. These attitudes are combined in a dual value system with positive evaluations of CBD which are to be found ‘deep down’. This division of attitudes on two levels is sometimes compared to the Danish situation where Kristiansen and colleagues have documented similar trends for Standard Danish and the Modern Copenhagen variety (e.g. Grondelaers & Kristiansen Reference Grondelaers and Kristiansen2013). In the Danish situation, the unconsciously offered positive evaluations of the Modern Copenhagen variety are invoked to explain its vitality. A similar dynamic is sometimes suggested for SBD and CBD: the fact that prestige evaluations of the standard variety are only superficial, while the colloquial variety is valued on a deeper level is then put forward as an explanation for why CBD could potentially encroach on SBD.
We believe, however, based on results from this study and other attitudinal experiments, that this scenario may not be a likely explanation for the standardization dynamics in the Belgian context, or put more cautiously, that the Flemish scenario cannot simply be equated with the Danish situation. First, as the results of our explicit measurement show, a SLI is indeed still alive and kicking in Flanders: SBD is considered a good choice no matter the situation. Yet, that SLI is present at more levels of sociolinguistic knowledge than assumed by prior studies. Previous P-IAT experiments, demonstrated a strong overall preference for the standard variety in different regional groups in Flanders (see Rosseel et al. Reference Rosseel, Speelman and Geeraerts2018). Second, positive associations with CBD are to be found on both the implicit and explicit level as well. The explicit measurement reported above indicated positive evaluations for CBD, albeit only in informal situations. Explicit rating tasks in other studies found more general positive associations with CBD as well (Rosseel Reference Rosseel2017). Interestingly, the positive evaluations of CBD showed a much stronger and clearer effect in the explicit measurement in those studies than in the implicit one (a Relational Responding Task in this case).
The results mentioned above are only a few pieces of a much larger puzzle that also needs evidence from production studies, but they seem to suggest that the SLI in Flanders—in the sense of one formal register serving as a cultural and linguistic reference point in a stratificational continuum—is strongly engrained on both the implicit and explicit level and that CBD enjoys positive evaluations on both levels too (be they evaluations of a different nature; see Rosseel Reference Rosseel2017). It is an open question what this means for potential processes of (de)standardization of SBD and CBD, but the least we can say at this point is that the Danish scenario, that is, ‘deep’ (interpreted here as implicit) positive evaluations of CBD fuelling its spread, does not seem to hold. These observations also show that we should be cautious not to extrapolate the dynamics of one speech community to another.
CONCLUSION
The Personalized Implicit Association Test (P-IAT), a method relatively new to sociolinguistic research, presents linguistic stimuli void of context: participants only receive labels for the language varieties or variants under study and very brief auditory (or written) exemplars representing these varieties or variants. Given the crucial influence of context cues on the perception and evaluation of language variation (e.g. Campbell-Kibler & McCullough Reference Campbell-Kibler, McCullough, Prikhodkine and Preston2015), this study aimed to explore the potential of the P-IAT to incorporate contextual cues by introducing situational context into the experimental design. We hypothesized that Limburgish participants would prefer their own regional variety in informal settings, but standard accented speech in formal contexts. Regardless of whether the visual context cues were presented during the P-IAT trials or in between blocks of trials, a context effect was found only in interaction with context order and block order. An explicit attitude measurement, by contrast, confirmed the hypothesis, but showed very positive attitudes towards both the regional and the standard accent in informal contexts. Multiple explanations for the absence of an overall context effect in the P-IATs can be put forward. First, there may have been issues in the experimental setup, which prevented the actual activation of the situational contexts that we aimed to evoke. Second, our initial hypothesis may have been too crude. More production research on the link between situational context (and other types of context) and Dutch language variation will hopefully provide useful input to base more fine-grained hypotheses on in the future. Finally, ambivalence and norm sensitivity were discussed as potential sources of individual variation between participants’ performance on the P-IATs. We strongly suggest that both factors be taken into account in future research on the influence of context cues on (Belgian Dutch) language variation.
To conclude, we would like to encourage sociolinguists to continue the exploration of new attitude measures like the P-IAT and their potential for measuring language attitudes in context, and, more generally, to try and include context features in their experiments on language attitudes, however challenging that may be, in order to obtain results that are more ecologically valid and tell us more about how language attitudes function in society. In addition, more research on how social meaning of language variation interacts with any type of contextual information will further add to our understanding of sociolinguistic cognition.
APPENDIX: DIRECT RATING TASK
1.
a. Hoe sta je tegenover de accenten die je in het experiment gehoord hebt, in een informele situatie (bv. aan tafel of tijdens een avondje uit met vrienden of familie)?
‘How do you feel about the accents you heard in the experiment in an informal situation (e.g. during dinner or a night out with friends or family)?’
Kleur een bolletje: hoe dichter bij een accent, hoe positiever je dat accent vindt.
‘The closer to an accent you tick off the O, the more positive you feel about that accent.’
Limburgs accent O O O O O O O neutraal accent
‘Limburg accent’ ‘neutral accent’
b. Hoe sta je tegenover een Limburgs accent (zoals gehoord in het experiment) in een informele situatie (bv. aan tafel of tijdens een avondje uit met vrienden of familie)?
‘How do you feel about a Limburg accent (as heard in the experiment) in an informal situation (e.g. during dinner or a night out with friends or family)?’
negatief O O O O O O O positief
‘negative’ ‘positive’
c. Hoe sta je tegenover een neutraal accent (zoals gehoord in het experiment) in een informele situatie (bv. aan tafel of tijdens een avondje uit met vrienden of familie)?
‘How do you feel about a neutral accent (as heard in the experiment) in an informal situation (e.g. during dinner or a night out with friends or family)?’
negatief O O O O O O O positief
‘negative’ ‘positive’
2.
a. Hoe sta je tegenover de accenten die je in het experiment gehoord hebt, in een formele situatie (bv. tijdens het tv-journaal)?
‘How do you feel about the accents you heard in the experiment in a formal situation (e.g. during the TV news)?’
Kleur een bolletje: hoe dichter bij een accent, hoe positiever je dat accent vindt.
‘The closer to an accent you tick off the O, the more positive you feel about that accent.’
Limburgs accent O O O O O O O neutraal accent
‘Limburg accent’ ‘neutral accent’
b. Hoe sta je tegenover een Limburgs accent (zoals gehoord in het experiment) in een formele situatie (bv. tijdens het tv-journaal)?
‘How do you feel about a Limburg accent (as heard in the experiment) in a formal situation (e.g. during the TV news)?’
negatief O O O O O O O positief
‘negative’ ‘positive’
c. Hoe sta je tegenover een neutraal accent (zoals gehoord in het experiment) in een formele situatie (bv. tijdens het tv-journaal)?
‘How do you feel about a neutral accent (as heard in the experiment) in a formal situation (e.g. during the TV news)?’
negatief O O O O O O O positief
‘negative’ ‘positive’