INTRODUCTION
As world population has grown and food demand has increased, a need for greater agricultural production and intensification of existing production systems has arisen (FAO 2015). However, such intensification has environmental consequences, such as increased emission of greenhouse gases (GHG) that are implicated in global climate change. Increasing demand for beef is expected to increase enteric methane (CH4) emissions, which contribute a proportion of 0·18 of global non-CO2 emissions, with an estimated 22% global increase from 2005 to 2030 (US EPA 2012). At the same time, ruminant meat production remains an economically and environmentally important part of maintaining the health of rangelands and marginal lands in extensive agricultural systems, particularly in developing nations. However, the feed provided by these ecosystems produces more enteric CH4 per unit of feed digested (Eckard et al. Reference Eckard, Grainger and De Klein2010; Sayre et al. Reference Sayre, Carlisle, Huntsinger, Fisher and Shattuck2012; Gerber et al. Reference Gerber, Mottet, Opio, Falcucci and Teillard2015). Therefore, it is important to balance both human economic and food security needs with long-term environmental impacts, requiring a careful analysis of both current models of beef performance and the impacts of mitigation methods.
Impacts of mitigation strategies can be evaluated using mechanistic models that represent biological processes involved in GHG emissions and overall animal productivity. Mechanistic models use mathematical equations to represent biological systems as an integration of processes at lower levels (such as organs) to predict higher-level processes and outputs (such as at the whole-animal level). A number of dynamic, mechanistic models of cattle production exist, such as MOLLY (Baldwin Reference Baldwin1995) and COWPOLL (Dijkstra et al. Reference Dijkstra, Neal, Beever and France1992; Mills et al. Reference Mills, Dijkstra, Bannink, Cammell, Kebreab and France2001). In the 1990s, AusBeef (Nagorcka et al. Reference Nagorcka, Gordon, Dynes, McNamara, France and Beever2000; Nagorcka & Zurcher Reference Nagorcka and Zurcher2002; Nagorcka Reference Nagorcka2004a , Reference Nagorcka b ), was developed for simulating beef production founded on the digestive and metabolic processes in MOLLY (Baldwin Reference Baldwin1995) with new additions that included differences in particle size. More recently, Hegarty (Reference Hegarty2016) linked the AusBeef rumen model with AusFarm (Herrmann Reference Herrmann2013) a whole-farm systems model. A description of overall model structure and schematic of the AusBeef rumen model indicating feedback loops is reported in the appendix of Dougherty et al. (Reference Dougherty, Kebreab, Evered, Little, Ingham, Hegarty, Pacheco and McPhee2017). Sensitivity analysis studies on MOLLY (Baldwin et al. Reference Baldwin, France and Gill1987a , Reference Baldwin, Thornley and Beever b , Reference Baldwin, France, Beever, Gill and Thornley c ; Bateman et al. Reference Bateman, Hanigan and Kohn2008; Hanigan et al. Reference Hanigan, Palliser and Gregorini2009, Reference Hanigan, Appuhamy and Gregorini2013; Gregorini et al. Reference Gregorini, Beukes, Waghorn, Pacheco and Hanigan2015) have been conducted to identify and evaluate influential parameters and their effects on model outputs, but such a study has not yet been conducted on a model optimized for beef cattle production such as AusBeef.
Sensitivity analysis involves a group of methods used to evaluate model behaviour under different circumstances and identify parameters that are influential for given model outputs under given input conditions, providing a quantifiable analysis of the model's sensitivity to changes to its internal parameters (Saltelli et al. Reference Saltelli, Ratto, Andres, Campolongo, Cariboni, Gatelli, Saisana and Tarantola2008). Sensitivity analysis allows for the examination of model behaviour by examining trends in output values when the values of internal parameters are varied over their potential range of values, as well as the impact of parameter interactions on model outputs. Identification of the parameters that most influence model outputs allows researchers to prioritize data collection and model refinement efforts. Sensitivity analysis also assists in model selection and refinement by identifying non-influential parameters for later selection and removal, particularly in cases where overparameterization is suspected. For mechanistic models such as AusBeef, this process of refinement and parameter removal must be balanced with the need to maintain mechanistic representation of the biological system being modelled.
The objectives of the present study were to perform local and global sensitivity analyses on CH4 production relevant parameters within the AusBeef model for beef production (Nagorcka et al. Reference Nagorcka, Gordon, Dynes, McNamara, France and Beever2000; Nagorcka & Zurcher Reference Nagorcka and Zurcher2002; Hegarty Reference Hegarty2016; Dougherty et al. Reference Dougherty, Kebreab, Evered, Little, Ingham, Hegarty, Pacheco and McPhee2017) to determine which parameters were most sensitive and examine overall model behaviour. The sensitivities of the parameters were evaluated against four CH4-related outputs, for two concentrate-based and two forage-based diets.
MATERIALS AND METHODS
The following CH4-related outputs were evaluated: (i) acetate to propionate ratio (Ac : Pr), (ii) energy from absorbed volatile fatty acids (MJ/day; EVFA), (iii) microbial protein outflow rate (g/day; MiPrt) and (iv) CH4 production (DMP, g CH4/day).
Methane-related outputs (i)–(iii) were selected due to their mechanistic linkages to CH4 production (iv) as well as their relevance to beef cattle production. The acetate : propionate ratio (Ac : Pr) was chosen because both acetate and propionate production influence ruminal hydrogen (H2) supply and therefore, H2 available for methanogenesis, but also because acetate is the predominant volatile fatty acid (VFA) on forage-rich diets, while propionate levels increase on higher-concentrate diets, allowing for a check of model behaviour relative to expected values when comparing forage-based with concentrate-based diets (McAllister et al. Reference McAllister, Okine, Mathison and Cheng1996). Energy from absorbed VFA was chosen because VFA are the major source of observed energy for cattle (Nafikov & Beitz Reference Nafikov and Beitz2007) and VFA production impacts rumen H2 supply. The MiPrt was chosen because microbial growth can decrease or increase ruminal H2 supply, depending on nitrogen source and because microbial protein is the major source of dietary protein for ruminants, particularly on diets with lower levels of protein in the feed. The parameter is also important from a biological standpoint (Dewhurst et al. Reference Dewhurst, Davies and Merry2000).
The analysis involved parameters in the rumen sub-model of AusBeef that are fixed internal model parameters and part of the internal code of the rumen sub-model, rather than user-editable feed or animal characteristics. The analyses were conducted on 305 rumen model parameters.
Data input for simulation
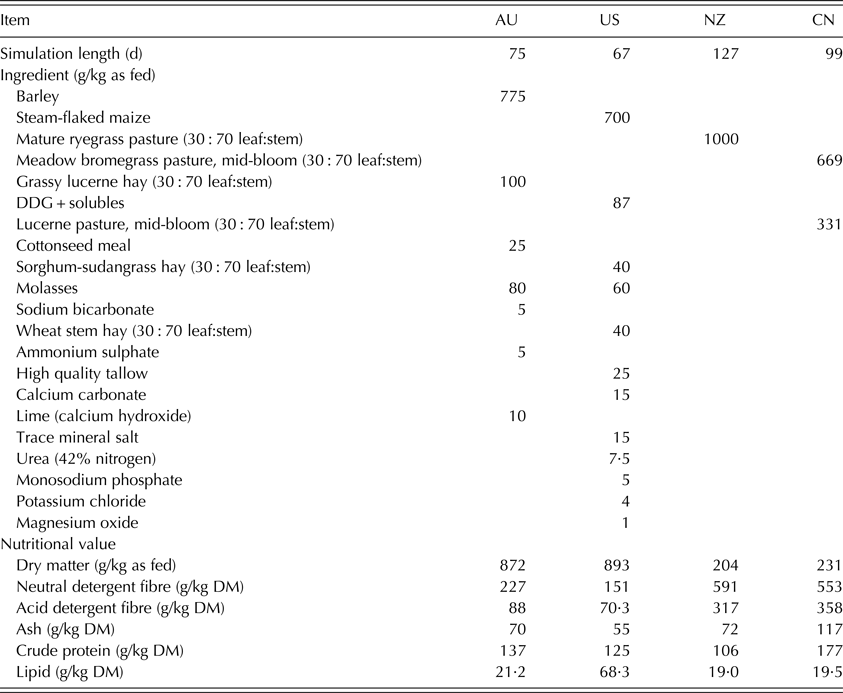
Four diets were used to evaluate the sensitivity of the parameters associated with the CH4-related outputs as mentioned above: (i) a barley-based feedlot diet representative of Australian systems (AU; Greenwood et al. Reference Greenwood, Siddell, Walmsley, Geesink, Pethick and McPhee2015), (ii) a maize-based feedlot diet representative of northern California systems (US; unpublished data from UC Davis beef feedlot), (iii) a New Zealand mature ryegrass pasture diet (NZ; Jonker et al. Reference Jonker, Muetzel, Molano and Pacheco2016) and (iv) a Canadian bromegrass-based pasture diet (CN; Boadi et al. Reference Boadi, Wittenberg and McCaughey2002). The feed compositions are reported in Table 1. All simulated animals were Angus steers, with no hormone implant, initial age of 18 months, initial live weight 400 kg, assuming 4% shrunk body weight at arrival and a frame score of 6·5 and a body condition score of 3·5 on a 1 to 5 scale. Each simulation was run until a final market weight of 550 kg was reached, assuming ad libitum feeding.
Description of Australia (AU), North America (US), New Zealand (NZ) and Canada (CN) diets used in the present study

DM, dry matter.
Statistical analysis
The statistical analysis consisted of: (i) a local sensitivity analysis to examine overall patterns of model behaviour when parameter values were varied one at a time; (ii) global sensitivity analysis I, to examine both the independent impacts of parameters and the presence of non-linear interactions (Saltelli & Annoni Reference Saltelli and Annoni2010); and (iii) global sensitivity analysis II, to examine model robustness, which simultaneously varied all parameters and examined changes in output. The R statistical software (R Core Team 2016) was used for the analysis.
Local sensitivity analysis
Local sensitivity analysis was run on 305 parameters within the rumen model, which were assumed to be independent. A series of C++ wrappers and functions for each analysis were developed to interface AusBeef with R. Local sensitivity analysis was performed using the sensFun function in R (Soetaert & Petzoldt Reference Soetaert and Petzoldt2015) (Eqn (1)). This function calculated sensitivities by perturbing each of the 305 rumen model parameters, one at a time, by a user-defined amount, which was 0·001. This created a matrix, {S
ij
} where the ith row represented the output and the jth column represented the parameter and (∂y
i
/∂Θ
j
) represents the change in output i, ∂y
i
, due to the change in parameter j, ∂Θ
j
. Each term was created by calculating the difference in the output v. an unchanged state, as shown in Eqn (1), where the change in output variable y
i
, i = 1,…,4 with respect to a change in parameter Θ
j
, j = 1,…,305 was multiplied by a scaling factor for each output and parameter, in this case the original unchanged values, represented by the term (∆Θ
j
/∆y
i
). Sensitivities were then normalized to
 $\widetilde{{S_{ij}}}$
by dividing each sensitivity by the square root of the summed squared sensitivity values (Eqn (2)).
 $$S_{ij} = {\rm} (\partial y_i/\partial \Theta _j) \times (\Delta \Theta _j/\Delta y_i)$$
 $$\widetilde{{S_{ij}}} = S_{ij}/\sqrt {\mathop \sum \limits_{\,j = 1}^{305} S_{ij}^2} $$
Each value was normalized with respect to its original value, removing the impact of original units and parameter values on the resulting sensitivity. The sensitivities of different parameters were then ranked and used as an indicator of how sensitive the model was to perturbations in the parameter value. An S i of 1 indicates a parameter more influential to the model for a given diet and output combination than a parameter with a S i of 0·1, which in turn is more sensitive than a parameter with a S i of 0·01 and where S i close to or >1 is considered particularly sensitive (Thompson et al. Reference Thompson, Sainz, Strathe, Rumsey and Fadel2014). This allows for the comparison of parameters whose initial values may differ by large amounts without distorting the final sensitivity results.
Sensitivities were calculated from average daily outputs for each day of the simulations (75, 67, 127 and 99 days, for AU, US, NZ and CN diets, respectively). Sensitivities of interest for analysis were ones whose mean absolute value over the last 10 days of simulation was non-zero. The averages of the sensitivity values over the final 10 days of each simulation run are reported. The absolute values of these normalized sensitivities,
 $\widetilde{{\vert S_{ij}}}\vert$
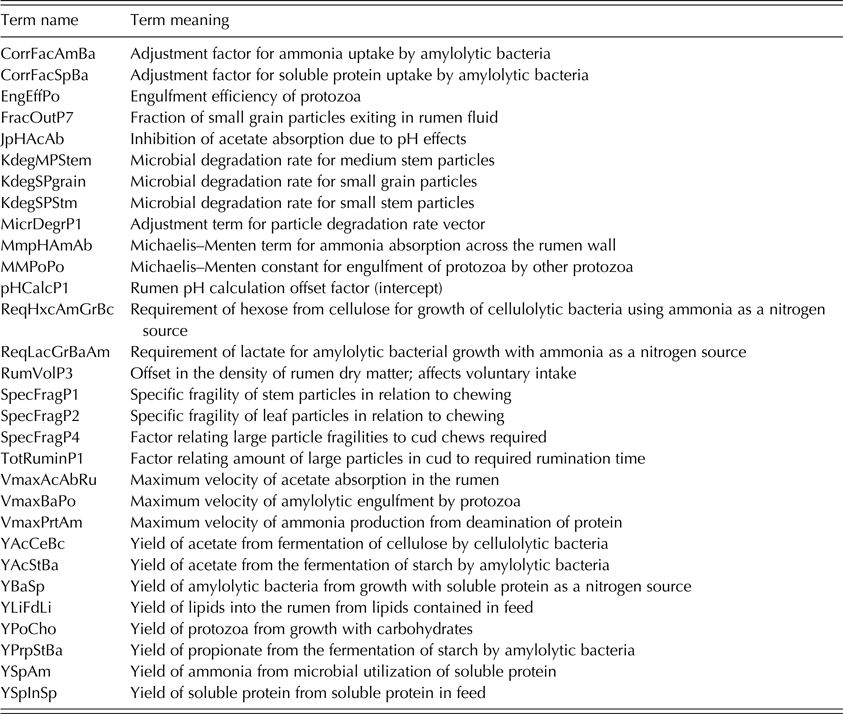
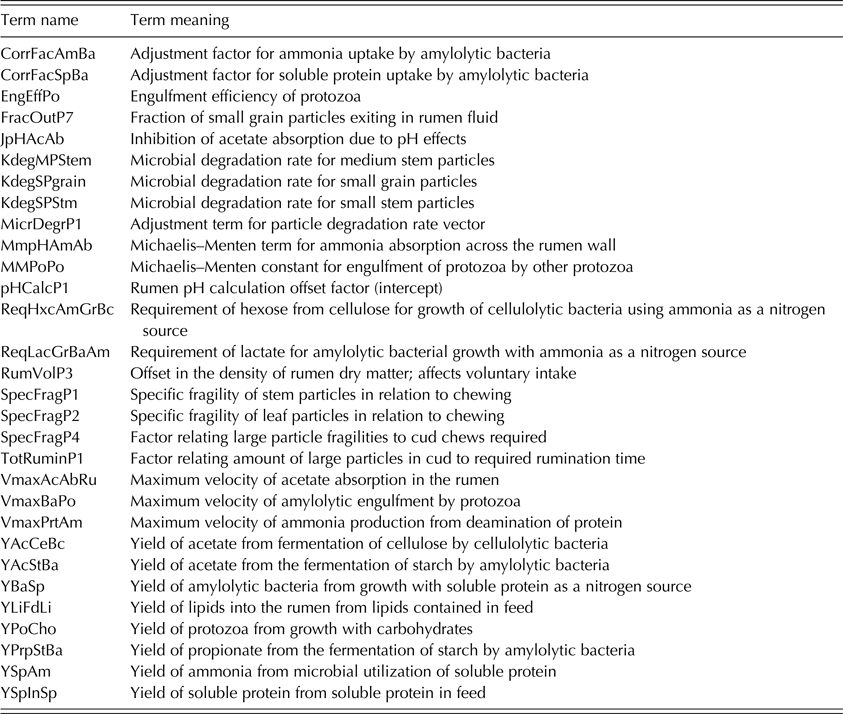
, greater than 0 were ranked by diet and output and compared to find commonalities across diets and outputs. A glossary of model terms used in the sensitivity analysis is reported in Table 2.
Glossary of model terms used in sensitivity analysis
Global sensitivity analysis I
Twenty parameters were identified from the local sensitivity analysis and chosen for use in global sensitivity analysis I based on the number of times each parameter appeared in the top 20 parameters for each diet/output combination, the magnitude of |S i | across diets and outputs and known biological relation to outputs of interest as described in the literature. These parameters were analysed to examine both the independent impacts of these parameters as well as the presence of non-linear interactions.
The analysis was conducted using the fast99 function in R (Pujol et al. Reference Pujol, Iooss, Janon, Boumhaout, Da Veiga, Delage, Fruth, Gilquin, Guillaume, Le Gratiet, Lemaitre, Nelson, Monari, Oomen, Ramos, Roustant, Song, Staum, Touati and Weber2016). Parameters were assumed to be distributed independently and uniformly with boundaries of ±10% of the baseline model parameter value, as has been used in prior global sensitivity analyses of dynamic, mechanistic models (Thompson et al. Reference Thompson, Sainz, Strathe, Rumsey and Fadel2014) and the model was run 2000 times per diet/output combination. For each of the four outputs of interest, (AC : Pr, EVFA, MiPrt and DMP), the fast99 function conducted the following functions: (i) calculated the independent effect of each parameter; (ii) calculated the independent effects of other parameters; (iii) calculated non-linear interactions; (iv) created a sensitivity index based on independent effects and non-linear interactions; and (v) summed the sensitivity indices created in (iv) to generate the total-order sensitivity. Interactions were considered in terms of raw numeric value, interaction (raw) and as a percentage of total effect, interaction (%). The function was limited to running one diet/output combination at a time. The sensitivity results of the top parameters (i.e., parameter with the highest sensitivity index) were ranked for each category within each diet/output combination for independent effect, total effect, non-linear interactions and non-linear interactions (% total effect).
Global sensitivity analysis II
A matrix was created where all 305 parameters used in the local sensitivity analysis were varied simultaneously. The parameter values were drawn from a random uniform distribution with boundaries ±10% relative to the unchanged initial parameter value within the model and assumed to be independent. This simulated matrix was run 100 times for each diet and the mean of each output over the last 10 days of simulation was compared with the baseline output with unchanged parameter values. Parameter boundaries were then set to ±25% relative to the initial parameter value and the matrix was generated again and rerun. Output values were expressed as a percentage of the baseline and a density plot was generated.
RESULTS
Local sensitivity analysis
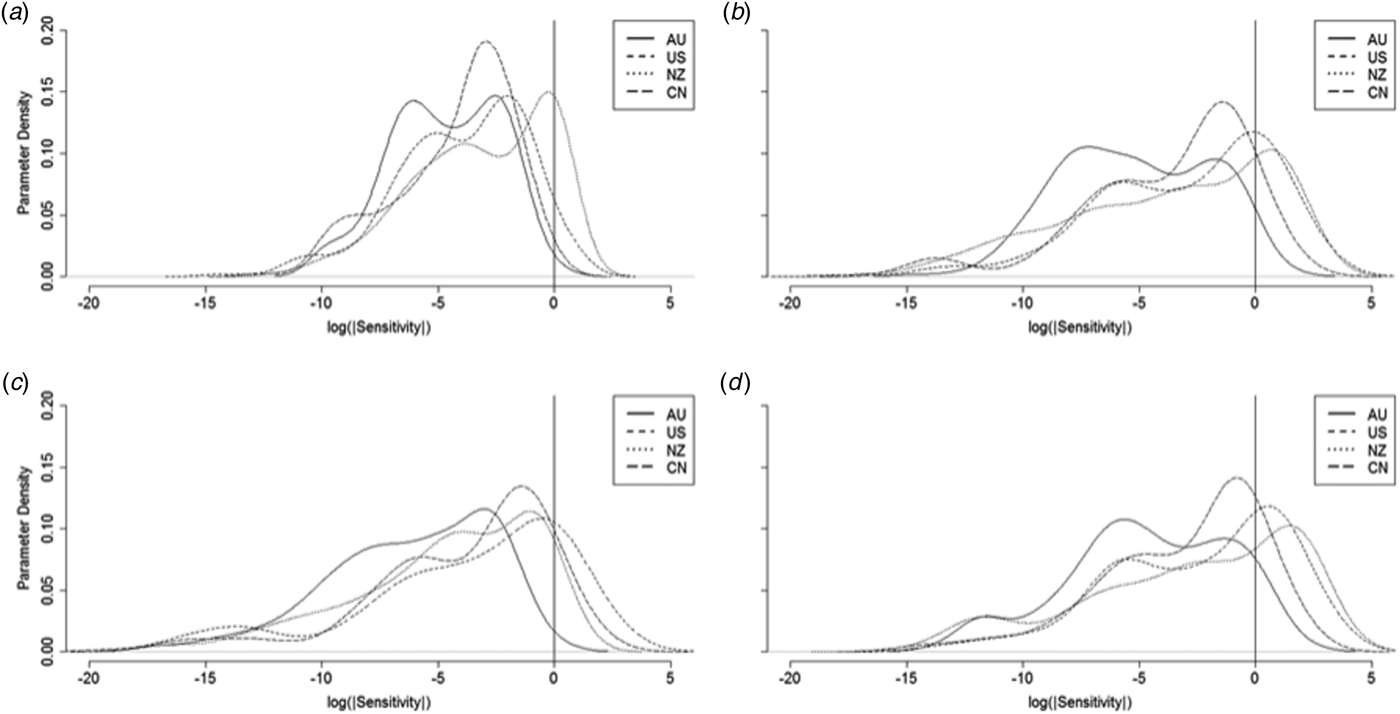
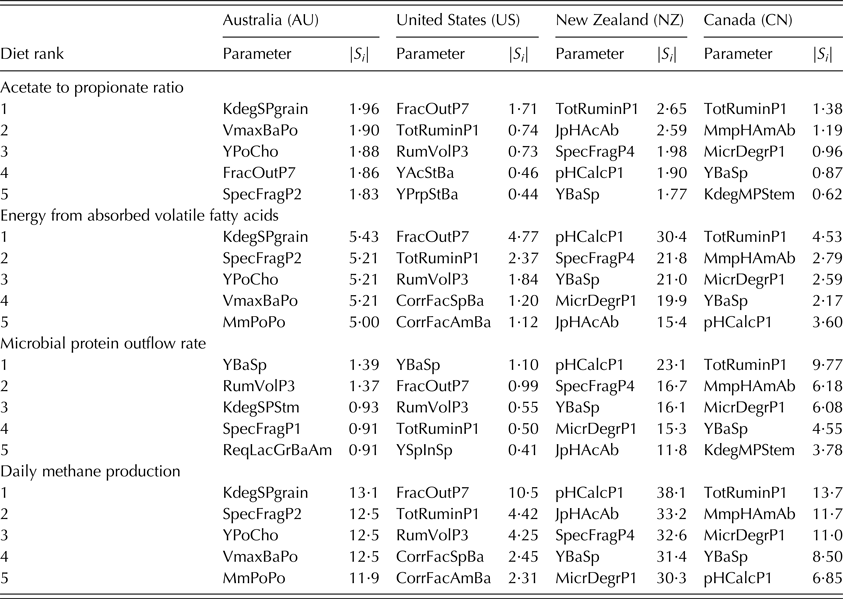
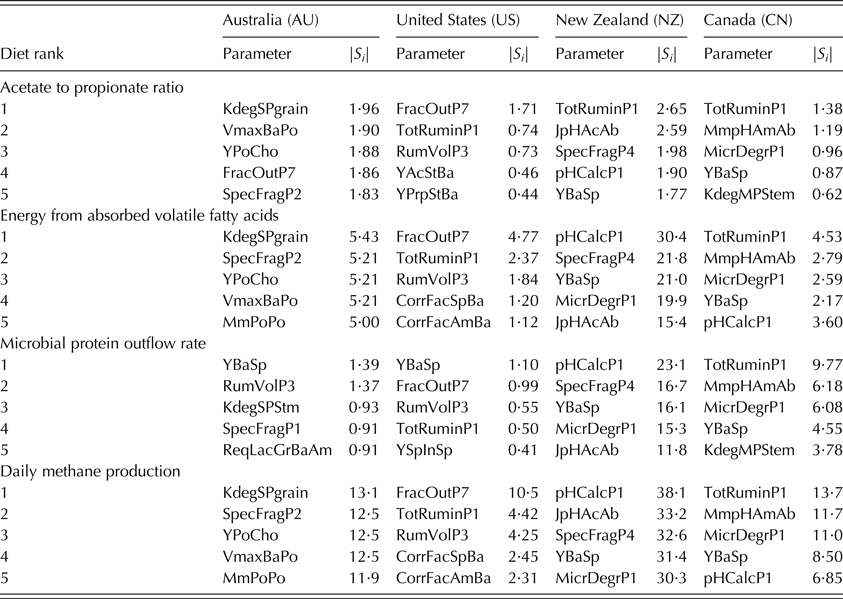
Overall, local sensitivity analysis produced a large number of parameters with normalized sensitivities close to zero and few parameters with sensitivities >1, the largest five of which are reported for each combination of diet and output (Table 3). Highly sensitive parameters across multiple diet and output combinations included terms involving protozoal engulfment, physical and microbial particle degradation, pH calculation and microbial yields. The densities of the local sensitivities were plotted against the log-transformed absolute value of the sensitivities (Fig. 1), where a log value <0 indicates a sensitivity between 0 and 1 and a log value >0 indicates a sensitivity >1. Log transformation was used to produce a normalized distribution that displayed local sensitivities graphically in an accessible manner. The distribution of local sensitivities is reported graphically (Fig. 1) to illustrate the overall local sensitivity value patterns by diet and output and to demonstrate diet-specific differences in sensitivities. For all combinations of diet and output, the majority of parameters had normalized |S i | between 0 and 0·01. For the Ac : Pr ratio, the AU diet had the highest mean sensitivity; however, the NZ diet had the largest range and highest maximum sensitivity. For EVFA, the US data showed the smallest variance of sensitivity values and range of sensitivities, while the NZ data had the highest maximum sensitivity, variance and mean sensitivity. For MiPrt, the US data had the smallest range, variance and mean sensitivity. The NZ diet had the highest variance and range of sensitivities and the AU data were closer to the US data in distribution, while the CN and NZ diets had similar distributions. For DMP, 31, 5·9, 27 and 13% of parameters had normalized |S i | > 1 for AU, US, NZ and CN diets, respectively, the highest total number as well as the highest amount for each diet. The NZ dataset had the widest range and greatest variance, while the US had the smallest range and variance.
Distributions of densities of local sensitivities of (a) Acetate to propionate ratio, (b) Energy from absorbed volatile fatty acids, (c) Microbial protein outflow rate, (d) Methane production, for Australia (AU), United States (US), New Zealand (NZ) and Canada (CN) diets. Values to the left of zero indicate normalized sensitivities between 0 and 1, values to the right of zero indicate normalized sensitivities >1. *Y-axis values indicate the height of the probability density function for the log of a parameter's local sensitivity. A higher y-value indicates that parameters are relatively more likely to have a given local sensitivity.

List of the top five sensitive parameters and their sensitivities (|Si|) for each diet and output combination in local sensitivity analysis
Overall, 196 parameters, a proportion of 0·64, had non-zero sensitivities across all diets and measures, indicating a high conservation of sensitivity across measures. However, only 47 out of 305 parameters, a proportion of 0·15, had a normalized |S i | > 0·01 across all diets and measures and eight parameters with normalized |S i | > 0·1 across all diets and measures, a proportion of 0·026. No parameters had a normalized |S i | > 1 across all diets and measures and the model was non-sensitive to 36 parameters across all diets/measures, a proportion of 0·12.
Global sensitivity analysis I
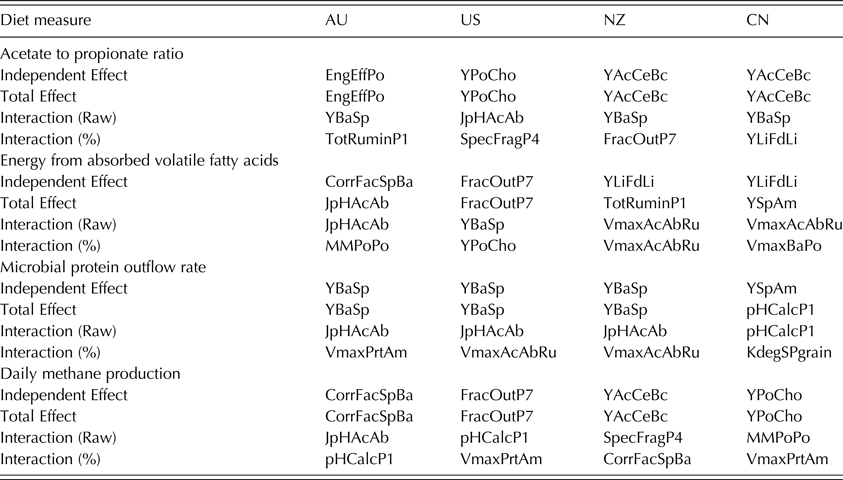
The 20 parameters and the meanings of the terms evaluated are reported in Table 2 and the results of global sensitivity analysis I are reported in Table 4.
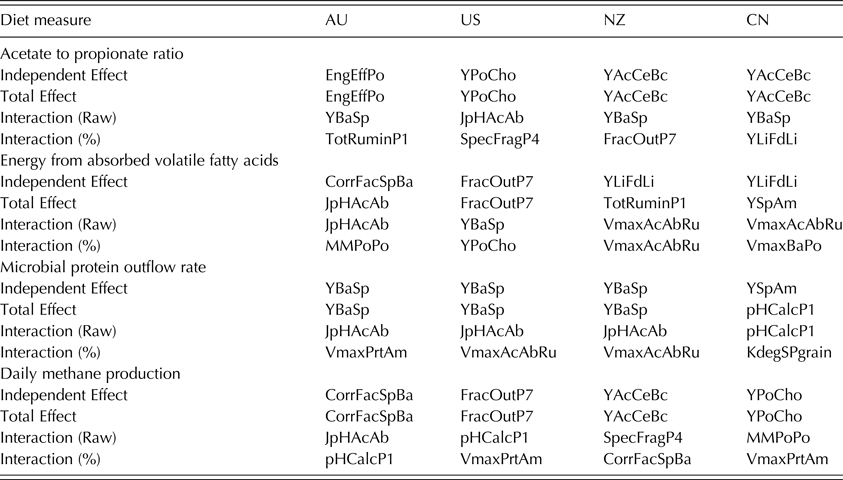
Top parameters for each diet/output combination for global sensitivity analysis I, for Australia (AU), United States (US), New Zealand (NZ) and Canada (CN) diets
Acetate : propionate ratio
The forage-based NZ and CN diets showed high independent and total effects for YAcCeBc but the greatest amount of raw interaction was from YBaSp, which was also true for the AU diet. For the AU diet, EngEffPo, had the largest independent and total effects and for the US diet, YPoCho had the largest independent effect and the largest total effect.
Energy from absorbed volatile fatty acids
The yield of lipids to the rumen from lipids entering in feed, YLiFdLi, had the greatest independent effect for both the CN and NZ diets and both diets had the most raw interaction due to VmaxAcAbRu. For the US diet, FracOutP7 had the greatest independent and total effect, while JpHAcAb had the greatest total effect and raw interaction for the AU diet.
Microbial protein exiting the rumen
For the AU, US and NZ diets, the greatest independent and total effects came from YBaSp and the greatest amount of interaction came from JpHAcAb. VmaxAcAbRu had the highest percentage of interaction for the US and NZ diets. For the CN diet, pHCalcP1 had the greatest total effect and raw interactions, but overall, the CN diet followed trends seen in the other three diets.
Methane production
For the AU diet, CorrFacSpBa had the highest amount of independent and total sensitivity, while FracOutP7 had the highest independent and total effect for the US diet. The NZ diet had the highest independent and total effect due to YAcCeBc and YPoCho had the highest independent and total effects for the CN diet.
Global sensitivity analysis II
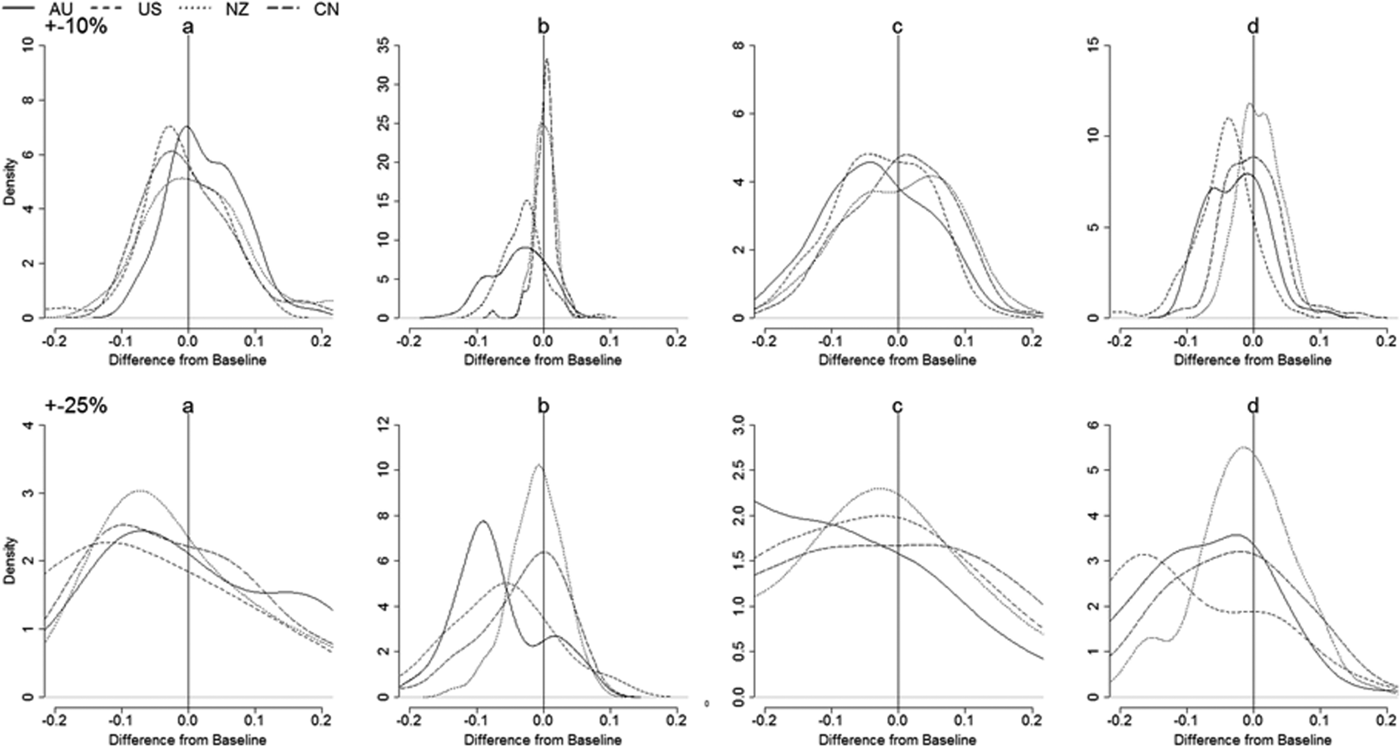
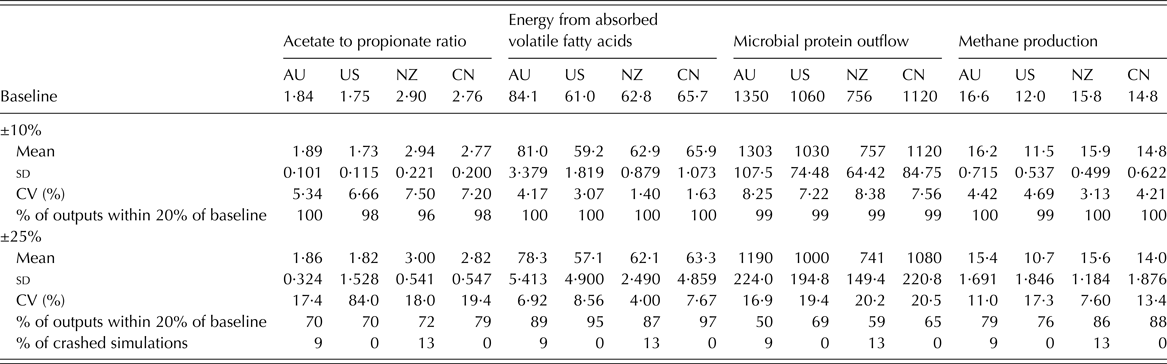
In the global sensitivity analysis II, the potential parameter value boundaries were set at ±10% of initial parameter values and then at ±25%. Figure 2 and Table 5 show the variation in each output for each feed, as well as the distribution of outputs in relation to the baseline value.
Density distribution of global sensitivity II of output values relative to the difference from the baseline for (a) Acetate to propionate ratio, (b) Energy from absorbed volatile fatty acids, (c) Microbial protein outflow rate, (d) Methane production, for Australia (AU), United States (US), New Zealand (NZ) and Canada (CN) diets. Parameter boundaries are ±10% and ±25% of the initial parameter value, respectively. *Y-axis values represent the height of the probability density function for model outputs relative to an unchanged baseline. A higher y-value indicates that parameter values were relatively more likely to have a given value relative to the baseline.

Summary of baseline and output variation statistics (n = 100) across each diet and output measure for ±10% and ±25% of baseline, for Australia (AU), United States (US), New Zealand (NZ) and Canada (CN) diets
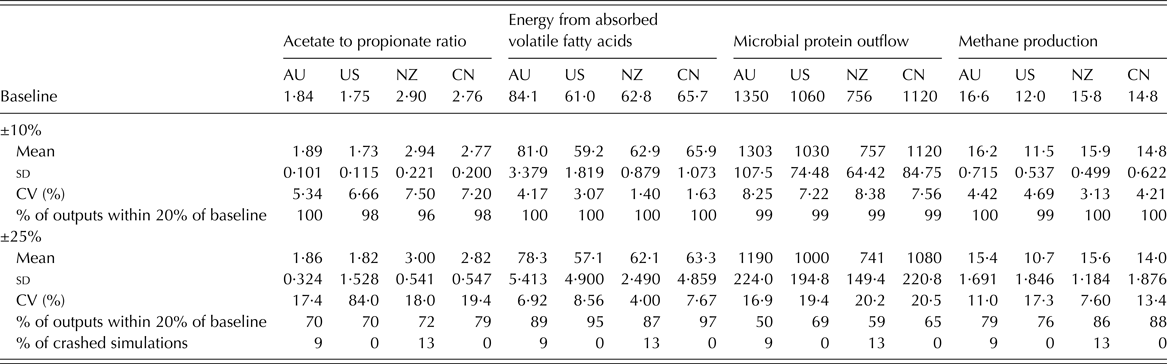
CV, coefficient of variation (%).
When parameter value boundaries were set at ±10% of their original value, the proportion of output values within ±20% of the baseline was at least 0·96 for all diets and outputs. However, when parameter value boundaries were extended to ±25% of their original value, the proportion of output values within ±20% of the initial baseline value was 0·5–0·97. After boundaries were set to ±25% of the original parameter values, the model was unable to reach a solution nine times out of 100 for the AU diet and 13 times out of 100 of the time for the NZ diet as some internal combination of parameters exceeded realistic levels, preventing the model from reaching a steady-state solution and causing the model run to exit prematurely without returning output values. Increasing the boundaries of permissible parameter values led to an increase in coefficient of variation and a decrease in the percentages of output values within ±20% of the baseline value.
For Ac : Pr, forage-based diets had greater coefficients of variation (CV) and standard deviation (s.d.) than concentrate-based diets. For EVFA, forage-based diets had smaller s.d. and CV than concentrate-based diets, but all four diets had 100% of outputs within ±20% of the baseline when boundaries were set to ±10% of the original value. For MiPrt, there were no diet-specific patterns observed in the data. When DMP was examined, concentrate-based diets had greater CV than forage-based diets.
Although the specific patterns were observed for s.d. and CV for each diet type when boundaries were set to ±10% of the original value, these were not present when boundaries were set to ±25% of the baseline. The percentage of output values within ±20% of the baseline value also decreased when boundaries were expanded, with MiPrt displaying the largest decrease. For Ac : Pr and DMP, concentrate-based diets had the lowest percentage of output values within ±20% of the baseline.
DISCUSSION
The sensitivity analyses examined overall model behaviour and parameters of importance for four CH4-relevant outputs using two concentrate-based and two forage-based diets. The diets were chosen to create a 2 × 2 study where each diet category had one diet from North America and one from Australia or New Zealand, to reflect a common situation within each of these production systems, realizing that even within one country or region not all production systems are the same. Both the local sensitivity and the global sensitivity analysis II examined all 305 internal rumen parameters, while global sensitivity analysis I analysed a sub-set of 20 parameters chosen with criteria discussed previously. The model's behaviour was examined with respect to the underlying biological drivers by examining the model's sensitivity to internal parameters such as microbial yield terms or maximum absorption rates, which are inherent to the model and not user-editable. Model behaviour between and within diet types was also analysed for diet-type-specific patterns in sensitivity and output variance. While forage-based diets tended to have lower energy content than concentrate-based diets, as evidenced by simulation time needed to reach market weight, simulation length needed to reach market weight was consistent within diet types. This allowed for some control for energy available to the animal within diet type.
Local sensitivity analysis
Across diets and measures, the model was weakly sensitive to a majority of parameters and highly sensitive to a small sub-set. Several parameters appeared in the top five list of more than one diet/output combination, such as KdegSPgrain, MMPoPo, TotRuminP1, pHCalcP1, YBaSp and RumVolP3. This result is in agreement with known rumen biology. Although microbial biological function involves dozens of enzyme-catalysed reactions, a large portion of these reactions are controlled by a much smaller number of reactions acting as control points (Van Lingen et al. Reference Van Lingen, Plugge, Fadel, Kebreab, Bannink and Dijkstra2016).
The forage-based diets had consistently greater maxima for EVFA and MiPrt. This could be because the model was originally developed for concentrate-based feedlot diets and behaved differently for forage-based diets, as reported by Dougherty et al. (Reference Dougherty, Kebreab, Evered, Little, Ingham, Hegarty, Pacheco and McPhee2017). Therefore, for forage-based diets, small changes in internal parameter values led to greater downstream impacts on model outputs. In the case of EVFA and DMP for the AU diet, the ranking of the top five most sensitive parameters was the same and three of the top five parameters related to protozoa. The relative importance of protozoal terms could be explained by the fact that protozoal populations tend to increase on higher-concentrate diets (Brown et al. Reference Brown, Ponce and Pulikanti2006). For both forage-based diets, YBaSp had a high |S i | for all measures. The NZ diet had the lowest dietary protein and CN, the greatest, which could be due to changes in the contribution of microbial protein to overall protein supply to the animal. Another possible explanation could be that this sensitivity is due to the use of a feedlot-optimized model to predict performance on forage-based diets.
The NZ data had consistently high maximum sensitivity values compared with the other diets, while the US diet showed lower maximum sensitivities overall. The magnitudes of sensitivities appeared to be related to diet type, as the CN diet also had relatively high maximum sensitivities and the AU diet sensitivities were intermediate to the other diets but closer to the US diet. It may also indicate that pasture-based diets were more sensitive to changes in parameter values due to some aspect of the feed characteristics or how forages are represented in the model.
Parameters with normalized local |S i | = 0 across all diets for a given measure ranged from 38 (MiPrt) to 48 (Ac : Pr), with the model being insensitive to 36 parameters across all diets and measures. While the current analysis was limited by the model outputs and diets chosen and therefore cannot be fully generalized to model behaviour under all situations, there were some surprising findings in this list. For example, terms involving valerate production, yields of ATP and yields from protozoal fermentation all were insensitive across multiple diets and measures. The insensitivity of valerate terms reflects the fact that valerate production is relatively small compared with that of other VFA (Lascano & Heinrichs Reference Lascano and Heinrichs2009).
Global sensitivity analysis I
For models that contain non-linear equations such as Michaelis–Menten equations, it is important to examine the contribution of non-linear interactions to model behaviour, which is not possible using local sensitivity analysis (Saltelli & Annoni Reference Saltelli and Annoni2010). Many biological reactions are non-linear in nature, but not all sensitivity analysis methods are capable of identifying non-linear interactions between parameters. Therefore, analysis that could quantify the extent to which non-linear interactions influenced model output was chosen, though this method has the drawback of not identifying which sets of parameters were interacting with each other. Overall, for outputs that displayed less interaction, such as Ac : Pr and EVFA, the most sensitive individual term in global sensitivity analysis I contributed more to the overall sensitivity than for outputs with more interaction, such as MiPrt and DMP, regardless of whether first order, total order, or non-linear interactions were being examined. When average contributions by diet type were compared, forage diets had higher average contributions for Ac : Pr and DMP, while concentrate diets had higher average contributions for MiPrt and EVFA, indicating further diet-specific patterns of sensitivity regardless of the interaction level.
Acetate : propionate ratio
Protozoal terms had the largest independent and total effects for concentrate-based diets. For the AU diet, EngEffPo predominated, possibly due to the effect of protozoal predation on microbial population size and therefore VFA production, as represented in AusBeef (Dougherty et al. Reference Dougherty, Kebreab, Evered, Little, Ingham, Hegarty, Pacheco and McPhee2017). The US diet had the largest influence from YPoCho, possibly due to the effect of protozoal starch sequestration and use for growth, also modelled in AusBeef (Hegarty Reference Hegarty2016; Dougherty et al. Reference Dougherty, Kebreab, Evered, Little, Ingham, Hegarty, Pacheco and McPhee2017). For both the AU and US diets, TotRuminP1 had the highest amount of interaction when expressed as a per cent of total effects. This likely reflects the relationship between large particles in cud and rumination time required, which influences particle degradation and nutrient utilization by ruminal microbes (Ehle et al. Reference Ehle, Murphy and Clark1982).
For the NZ and CN diets, YAcCeBc had the largest total and independent effect, likely because forage-based diets typically have higher levels of cellulose than concentrate-based diets (McAllister et al. Reference McAllister, Okine, Mathison and Cheng1996). In general, the majority of the sensitivity of these measures was from independent effects. Protozoal terms such as YPoCho, EngEffPo and VmaxBaPo were relatively important across all four diets, which is in agreement with the reported effect of protozoa as a contributor towards influencing VFA production by impacting microbial population size (Veira Reference Veira1986).
Energy from absorbed volatile fatty acids
For the AU diet, the largest total effect and largest interaction effect came from JpHAcAb, possibly because acetate absorption is pH-dependent and therefore any changes to this effect would change energy from acetate absorption and therefore overall EVFA (Gabel et al. Reference Gabel, Aschenbach and Müller2002). For the US diet, FracOutP7 had the highest total and independent effects, likely due to the relationship between particle retention time and microbial utilization of nutrients (Dewhurst et al. Reference Dewhurst, Davies and Merry2000). It is interesting that YLiFdLi had the highest independent effect for forage-based diets, particularly because the NZ diet had the lowest lipid content of the diets evaluated. The greatest amount of interaction for the NZ and CN diets came from VmaxAcAbRu, likely because the maximum velocity of acetate absorption influences energy available to the animal, but in turn is influenced by microbial growth v. VFA production and by rumen pH, all of which are represented in the AusBeef model (Hegarty Reference Hegarty2016).
When compared with Ac : Pr, EVFA had significantly more non-linear interaction, particularly for forage-based diets. The forage-based diets also exhibited greater degrees of interaction and relative importance for VmaxAcAbRu, likely because acetate is the predominating VFA for forage-based diets (McAllister et al. Reference McAllister, Okine, Mathison and Cheng1996). As acetate is a major VFA regardless of diet, it is also understandable that JpHAcAb also had a high degree of interaction across all diets (McAllister et al. Reference McAllister, Okine, Mathison and Cheng1996). The NZ and CN diets had higher total sensitivities for EVFA than the concentrate-based AU and US diets, with interactions between parameters forming the majority of the forage-based diets’ sensitivities. This reflects known biology regarding the complexity of production and absorption of energy from VFA in the rumen, as well as the different equations for forage-based v. concentrate-based diets.
The yield of lipids from lipids in feed, YLiFdLi, was important across all four diets, which is intriguing given the lower lipid levels of forage-based diets. It is also interesting that the AU diet, with 21·2 g lipid/kg as-fed, had the least sensitivity to YLiFdLi. This could indicate that as the AU diet is representative of Australian feedlot systems and therefore included the grain and lipid levels the model was initially developed to represent, extending the model to represent grain-based diets with significantly higher levels of lipid, or to lower-lipid forage-based diets, would change model behaviour such that the sensitivity of YLiFdLi was greater than for the type of diet the model was initially developed to represent.
Microbial protein exiting the rumen
For all diets except the US diet, YBaSp had both the largest independent effect and largest total effect, which is understandable, as the growth of amylolytic bacteria increases the amount of microbial protein and therefore the amount of microbial protein potentially available to the animal. The largest amount of interaction for these three diets came from JpHAcAb, possibly related to the inverse biological relationship between microbial protein formation and VFA production (Leng Reference Leng1991). This could also explain the finding that VmaxAcAbRu had the highest percentage of interaction for the US and NZ diets. Similar to Ac : Pr, the majority of terms for MiPrt were comprised primarily of independent effects with few parameters having high sensitivities. The yield of ammonia from microbial utilization of soluble protein, YSpAm, was more sensitive for forage-based diets than concentrate-based diets, despite the differing protein levels in the two forage-based diets, with the CN diet having the greatest crude protein content and the NZ diet having the lowest crude protein of all diets examined. This could indicate that some further refinement is needed in AusBeef's ability to represent all-forage diets, or that soluble protein deamination has a very large impact on microbial protein production in forage-based diets, regardless of the diet's crude protein level.
Methane production
Methane production had many terms with a large amount of interaction, as was seen for EVFA. The majority of important terms were those related to processes that affect ruminal H2 balance, such as microbial activity and yields, or VFA production. As expected given the predominance of acetate as a major VFA on forage-based diets, YAcCeBc had a higher sensitivity for forage-based diets as opposed to concentrate-based diets (McAllister et al. Reference McAllister, Okine, Mathison and Cheng1996). CorrFacSpBa was more sensitive for concentrate-based diets than forage-based diets, regardless of diet protein level, which may be related to the fact that amylolytic bacteria predominate over cellulolytic bacteria under these circumstances (McAllister et al. Reference McAllister, Okine, Mathison and Cheng1996).
The high degree of interactions present in methanogenesis and energy from absorbed VFA indicates the need for a mechanistically representative model of rumen function, which was recognized by Baldwin & Black (Reference Baldwin and Black1979) and colleagues more than 40 years ago, as later represented in MOLLY (Baldwin Reference Baldwin1995). As in the local analysis, terms involving pH, protozoal activity and particle degradation were all fairly sensitive, with Michaelis–Menten terms, maximum velocities and pH terms displaying overall high degrees of interaction.
Global sensitivity analysis II
Global sensitivity analysis II was conducted to examine model robustness, which simultaneously varied all parameters and examined changes in output with regard to potential different ‘true’ parameter values. The results of global sensitivity analysis II show model output stability when parameter value boundaries were limited to ±10% of the original model value, but relative stability declines when boundaries were extended to ±25% of the original model value. Additionally, the model exited prematurely nine times out of 100 for the AU diet and 13 times out of 100 for the NZ diet, indicating that parameter values for those model runs were not realistic on those occasions. This could be because some of the 305 internal parameters are exponents, so even a small change in exponent value could lead to the model becoming unable to reach a steady state solution.
When parameter value boundaries were set at ±25% of the initial value, the per cent of output values within ±20% of the initial baseline value decreased, with forage-based diets having a higher percentage of outputs within the boundaries than concentrate-based diets. This could indicate that forage-based diets have a higher tolerance to multiple simultaneous changes in parameter values, even when the boundaries of the changes correspond to a relatively high amount of potential error in the internal parameter estimate. This is further evidence of diet type-specific differences in model behaviour, as forage-based diets had consistently high maximum sensitivities for both the local and global sensitivity analysis I results. This could also indicate that forage-based diets have a smaller number of highly important parameters and are then largely insensitive to changes in the rest of the model parameters. Conversely, the concentrate-based diets appear to be less robust in terms of output variance than forage-based diets and were also weakly to moderately sensitive to the majority of parameters for the local sensitivity analysis, suggesting that the cumulative effect of multiple changes in parameters at once leads to a wider range of output variance than forage diets.
There also appears to be an inverse relationship between the range of output values relative to the baseline in global sensitivity analysis II and the relative amount of interactions present in global sensitivity analysis I. It was observed that outputs that displayed relatively little interaction in global sensitivity analysis I and which had the single most sensitive parameter contributing to a larger amount of the total-order sensitivity for each output display a wider range and higher CV in global sensitivity analysis II, yet lower maximum local sensitivities as compared with outputs where more interactions were present, suggesting that it is not as simple as a few highly influential parameters driving model output variance and sensitivity patterns. Future model analysis could investigate this relationship as part of overall model refinement and assessment under different conditions.
CONCLUSION
The influential model parameters identified in the present study were interpreted using current knowledge of major drivers of biological processes. The global and local sensitivity analyses indicate that the model's underlying mechanistic representations appear to reflect the current understanding of rumen biology, validating the model's potential utility. The local sensitivity analysis identified that the model is weakly sensitive to the majority of parameters and highly sensitive to a small sub-set, indicating parameters that should be targeted for future research to update parameter values. Parameters of interest for future updates include growth of amylolytic microbes from soluble protein, the inhibition of acetate absorption due to pH effects, the yield of acetate from the fermentation of cellulose by cellulolytic microbes, protozoal predation, protozoal growth from carbohydrates, terms involving particle exit and degradation rates and the maximum rate of acetate absorption across the rumen wall.
The model was sensitive to different parameters for forage-based diets compared with concentrate-based diets, reflecting the different pathways and microbial groups that are known to be important for each diet type. Within global sensitivity analyses I and II and local sensitivity analysis, EVFA and DMP exhibited more non-linear interaction between parameters. They also showed less variance in output values when parameter values were simultaneously varied, as well as higher maximum local sensitivities, reflecting the complex nature of these processes and suggesting that a mechanistically representative model for these outputs is warranted to ensure accurate modelling of the reactions involved in these processes.
The insensitivity of the model to protozoal fermentation in the local sensitivity analysis may indicate that protozoal fermentation affects the model to a lesser extent than bacterial fermentation. This is at odds with current literature, therefore future studies may investigate the effects of protozoa on rumen dynamics, perhaps by representing defaunation and its effects on VFA concentration (Newbold et al. Reference Newbold, De La Fuente, Belanche, Ramos-Morales and McEwan2015). More generally, the high level of model sensitivity to the yield of lipids from lipids in feed, even for low-lipid diets, could indicate that the model's representation of lipids may require further refinement. Because this study focused on internal model parameters, future work could examine model output sensitivity to user-editable characteristics such as animal age and weight, or feed composition and intake and an examination of the downstream effects of such changes on similar outputs as well as overall protein and energy availability are also warranted. Overall, the list of sensitive parameters determined in the present study provides a basis for updating parameter values in future research efforts.
The authors acknowledge funding from the Department of Agriculture, Fisheries and Forestry, ‘Filling the Research Gap’ round 2 and partial funding was provided by the Sesnon Endowed Chair Program at the University of California, Davis as well as the James Beard Foundation National Scholars Program. The earlier development of AusBeef for feedlots was partially funded by the Commonwealth Scientific and Industrial Research Organization and Meat and Livestock Australia and Grains Research and Development Corporation. David Pacheco was funded by the Ministry for Primary Industries, New Zealand in support of the objectives of the Global Research Alliance on Agricultural Greenhouse Gases. The authors also thank Dr Caitlin Rottler for her assistance with graphical analysis in R. Research was conducted at University of California, Davis, 1 Shields Avenue, Davis, CA 95616 USA.