Introduction
The identification of biological and neuropsychological markers that can predict cognitive decline at the preclinical stage is an important area of research. Studies conducted with the Cambridge Cognitive Examination (CAMCOG) have reported variable results as regards which subscales might discriminate between diagnostic categories and predict cognitive decline.
Global CAMCOG scores obtained the best diagnostic accuracy in differentiating between normal patients, those with mild cognitive impairment (MCI), and patients with Alzheimer's disease (AD) (Heinik and Shaikewitz, Reference Heinik and Shaikewitz2009), and were better at discriminating between AD and MCI patients than between MCI and normal individuals (Nunes et al., Reference Nunes2008). The subscales that best discriminated between dementia and non-dementia were Memory, Orientation, and Attention/Calculation, whereas Abstraction, Language, and Perception presented the highest discrepancies among studies (Lozano-Gallego et al., Reference Lozano-Gallego, Vilalta-Franch, Llinàs-Reglà and López-Pousa1999; Nielsen et al., Reference Nielsen, Lolk, Andersen, Andersen and Kragh-Sørensen1999; Schmand et al., Reference Schmand, Walstra, Lindeboom, Teunisse and Jonker2000; Williams et al., Reference Williams, Huppert, Matthews and Nickson2003).
In the conversion from normal aging to MCI, one longitudinal study reported a greater decline associated with older age and the subscales Language (expression) and Memory (learning), which were predictors of the conversion time (Oulhaj et al., Reference Oulhaj, Wilcock, Smith and Jager2009). As regards predicting the conversion from MCI to AD, there is a broader consensus over the predictive value of the Orientation and Memory subscales and the global CAMCOG score at baseline, but greater disagreement in relation to the Language, Perception, Abstraction, and Attention/Calculation subscales (Cabranes et al., Reference Cabranes2004; Marcos et al., Reference Marcos2006; Armas, Reference Armas2009; Gallagher et al., Reference Gallagher2010). These discrepancies could be due to the influence of socio-demographic factors such as age or education, if the samples studied were heterogeneous with respect to these variables. At all events, it would clearly be helpful to clarify that subscales are indeed able to identify at baseline those patients who are subsequently most likely to suffer cognitive decline, as well as those subscales that show the greatest decline from a longitudinal perspective.
The main hypothesis of the present research was that it would be possible, at baseline, to identify differential elements in the CAMCOG subscales that could be used to predict cognitive decline, especially in subjects with MCI. This is relevant since the overall score has been shown to be a poor discriminator. Consequently, the study objectives were to identify, in a sample of AD, MCI, and normal aging subjects who were homogeneous in terms of socio-demographic variables: (1) the CAMCOG subscales with the highest discriminating capacity at baseline in terms of predicting cognitive decline in AD and MCI; (2) the effect of age, schooling, gender, and depression on baseline subscale scores; and (3) the subscales that show the greatest decline over a five-year period in AD and MCI.
Methods
Design and sample population
A case-control longitudinal study was carried out with patients who had been seen as outpatients at the Memory and Dementia Assessment Unit (UVAMID) of the Santa Caterina Hospital in Girona, Spain and who had undergone neuropsychological assessment over five consecutive years.
Patients were diagnosed on the basis of standard clinical criteria for each group (AD and MCI), independently of their CAMCOG results. They were then classified, according to their final diagnosis, as patients with AD, patients with MCI converted to AD (MCI-Ad), and patients with stable MCI (MCI-St). Those with AD met DSM-IV-TR criteria (American Psychiatric Association, 2001), while probable AD patients were classified according to the NINCDS-ADRDA criteria (McKhann et al., Reference McKhann, Drachman, Folstein, Katzman, Price and Stadlan1984). Patients with MCI met the European AD Consortium (EADC) criteria for MCI (Portet et al., Reference Portet2006):
1. cognitive complaints coming from the patients or their families;
2. the reporting of a decline in cognitive functioning relative to previous abilities during the past year by the patient or informant;
3. cognitive disorders as evidenced by clinical evaluation (impairment in memory or in another cognitive domain);
4. absence of major repercussions on daily life (the patient may, however, report difficulties concerning complex day-to-day activities);
5. absence of dementia.
The control group (CTR) was drawn from an epidemiological field study on the prevalence of dementias in a rural area of the province of Girona, Spain (Vilalta-Franch et al., Reference Vilalta-Franch, López-Pousa and Llinàs-Reglà2000; López-Pousa et al., Reference López-Pousa, Vilalta-Franch, Llinàs-Reglà, Garre-Olmo and Román2004). There were initially 141 CTR individuals without dementia, assessed over a period of five years. Of these, only those cases with complete neuropsychological test results were selected, resulting in a group of 112 individuals.
Patient data corresponded to the period between 1995 and 2009. The CTR data were obtained between 1990 and 1995. The final sample therefore consisted of four groups: AD (n = 121), MCI-Ad (n = 43), MCI-St (n = 66), and CTR (n = 112).
Measurements
Socio-demographic data
Data on the patients’ age, gender, marital status, and education were gathered in the hospital unit. For controls, data were derived from the Cambridge Mental Disorders of the Elderly Examination (CAMDEX; Roth et al., Reference Roth1986; Vilalta-Franch et al., Reference Vilalta-Franch, Llinàs-Reglà, Lopez-Pousa, Amiel and Vidal1990) that had been applied to all subjects in the epidemiological field study.
Instruments
The neuropsychological examination of patients and controls included the following tests:
1. Mini-Mental State Examination (MMSE). This is a brief cognitive test whose score ranges between 0 and 30, the cut-off for cognitive impairment being 21/22 (Folstein et al., Reference Folstein, Folstein and McHugh1975).
2. CAMCOG. This evaluates several cognitive functions and its total score ranges between 0 and 105–107 (the latter depending on whether the original or revised version is used). The lower the score the greater the cognitive impairment. The cut-off score for cognitive impairment in the Spanish population is 69/70 (Vilalta-Franch et al., Reference Vilalta-Franch, Llinàs-Reglà, Lopez-Pousa, Amiel and Vidal1990). The CAMCOG subscales are Orientation, Memory (learning, recent, and remote), Language (comprehension and expression), Attention/Calculation, Praxis, Perception, and Abstraction. The original version of the CAMCOG was applied to the control group (Roth et al., Reference Roth1986; Vilalta-Franch et al., Reference Vilalta-Franch, Llinàs-Reglà, Lopez-Pousa, Amiel and Vidal1990), whereas the revised version was administered to patients (Roth et al., Reference Roth, Huppert, Tym and Mountjoy1998; Lozano-Gallego et al., Reference Lozano-Gallego, Llinàs-Reglà, López-Pousa and Vilalta-Franch2000). When computing scores, one item from the Perception subscale (tactile recognition of coins) was eliminated from the original version as it does not form part of the revised CAMCOG.
3. Blessed Dementia Rating Scale (BDRS; Blessed et al., Reference Blessed, Tomlinson and Roth1968). Scores on the first two subscales of this instrument were used to evaluate deficits in activities of daily living (ADL) (A) and habits (B). The maximum deficit score for these subscales combined is 17 (A = 8; B = 9). The cut-off value for the Spanish population is 1.5 for the two subscales combined (A + B; Peña-Casanova et al., Reference Peña-Casanova2005).
4. CAMDEX-R Depression Scale. This has a maximum score of 27 and a cut-off value of 7/8 for the Spanish population (Vilalta-Franch et al., Reference Vilalta-Franch, Llinàs-Reglà, Lopez-Pousa, Amiel and Vidal1990).
Procedure
The research team was formed by clinicians with both neuropsychology training and clinical experience. The neuropsychological assessment of patients (AD, MCI-Ad, and MCI-St) was performed by the team of neuropsychologists from the hospital unit. In addition to diagnosis, a second inclusion criterion was having been assessed over a consecutive five-year period. In the epidemiological field study, the neuropsychological assessment of the control group was conducted in each participant's home.
During the five-year period, individuals with dementia (AD and MCI-St) underwent an average of 4.8 assessments (range 2–6), while those without dementia (MCI-St and CTR) had an average of 3.1 assessments (range 2–6).
Statistical analysis
An analysis was conducted of the CAMCOG subscale scores obtained by the four groups. Differences in mean scores were compared using the Kruskal-Wallis (χ2), Mann-Whitney U (z), and Wilcoxon (z) tests because none of the subscales fulfilled the criteria for normality (Kolmogorov-Smirnov and Shapiro-Wilks tests). In the multiple comparisons, Bonferroni correction was applied to the p values. The effect size (Cohen's d) was calculated whenever any differences were significant.
An analysis of the receiver operating characteristic (ROC) curves was also conducted to identify the subscales with the greatest predictive capacity, determined by comparing the baseline and final scores of the AD versus CTR groups and the MCI-Ad versus CTR groups.
Finally, a stepwise multivariate linear regression analysis was carried out, introducing as dependent variables the baseline scores on each subscale and as independent variables the subjects’ age, gender, years of schooling, and depression. The aim here was to identify the subscales most affected by these variables. Results were considered statistically significant at a p value of 0.05.
Results
Socio-demographic data
The mean age of the sample at baseline was 74.3 years (SD = 6.2), with men accounting for 31.3% (n = 107) and women 68.7% (n = 235). As regards education, 20.8% (n = 71) of the sample were either illiterate or had no formal schooling, 18.4% (n = 63) had received one to five years of education, 50.0% (n = 171) had attended school for six to eight years, and 10.8% (n = 37) had received more than eight years of education. There were no significant differences between the four groups in terms of age (χ2 = 1.7; p = 0.628), gender (χ2 = 1.6; p = 0.649), marital status (χ2 = 0.9; p = 0.810), or schooling (χ2 = 2.6; p = 0.441).
Clinical data
ADL/habits
The mean scores at baseline on the two subscales (A + B) of the BDRS were as follows: AD = 2.27 (1.4), MCI-Ad = 1.37 (1.0), MCI-St = 1.24 (1.0), and CTR = 0.34 (0.6). The corresponding mean scores at final assessment were AD = 5.95 (2.6), MCI-Ad = 4.18 (1.7), MCI-St = 2.46 (1.4), and CTR = 0.99 (1.1).
Subtypes of MCI
At baseline, the amnesic subtype (single and multiple domains) accounted for 90.7% of the MCI-Ad group and 80.3% of the MCI-St group, while the non-amnesic subtype (single and multiple domains) accounted for 9.3% of the MCI-Ad group and 19.7% of the MCI-St group. These subtypes were classified by taking into account, for each subscale, the deficit scores that were more than one standard deviation greater than the scores obtained by controls.
Depression
Application of the CAMDEX-R Depression Scale revealed the following percentages of depressed subjects in each group: AD = 33.1%, MCI-Ad = 44.2%, MCI-St = 57.6%, and CTR = 23.2%. However, the presence or absence of depression was not significantly related, in any of the groups, with baseline or final scores on the CAMCOG, or with the overall rate of cognitive decline.
Scores on the CAMCOG subscales
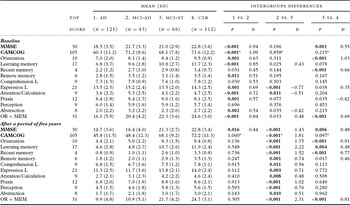
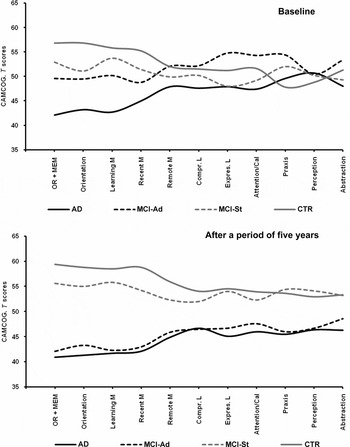
Table 1 shows the mean scores on the CAMCOG subscales at baseline and after five years. When presenting these results in Figure 1, T (10z + 50) scores are used so as to reflect better the relative differences between the four study groups.
CAMCOG subscale scores at baseline and after five years

AD = Alzheimer's disease; MCI-Ad = mild cognitive impairment converted to AD; MCI-St = mild cognitive impairment-stable; CTR = control group; OR + MEM = Orientation + Memory (learning and recent); L = Language; D = Cohen's d.
P = Mann-Whitney U; p value adjusted with Bonferroni correction for multiple comparisons ≤0.017. *ANOVA; p value adjusted with Bonferroni correction for multiple comparisons. Significant p values in bold.
CAMCOG subscale T scores at baseline and after five years. AD = Alzheimer's disease; MCI-Ad = mild cognitive impairment converted to AD; MCI-St = mild cognitive impairment-stable; CTR = control group; OR + MEM = Orientation + Memory (learning and recent); M = Memory; L = Language; Compr. = comprehension; Expres. = expression; Cal. = calculation.

At baseline, the AD group scored lower than the other three groups on all the subscales. The MCI-Ad group scored significantly higher than the MCI-St group on Language (expression) (z = −3.4; p < 0.001), Attention/Calculation (z = −2.5; p = 0.011), and Abstraction (z = −2.1; p = 0.035) and higher than the CTR group on Praxis (z = −3.0; p = 0.002). These higher comparative scores in the MCI-Ad group produce a confounding effect in the baseline assessment. The only variable on which the MCI-Ad group scored lower than the groups without dementia was Memory (learning), this being the case with respect to both the MCI-St group (z = 2.2; p = 0.025) and the CTR group (z = 4.0; p < 0.001). The MCI-St group scored lower than the CTR group on Orientation (z = 6.5; p < 0.001), Memory (recent) (z = 3.5; p < 0.001), and Language (expression) (z = 2.0; p = 0.038), but higher on Praxis (z = −2.1; p = 0.035).
The only subscales on which the baseline scores increased progressively from AD to MCI-Ad to MCI-St to CTR were Orientation and Memory (learning and recent). By grouping these subscales into a new variable, OR + MEM, it was possible to achieve a greater discrimination between the four groups: AD versus MCI-Ad (16.1 [5.9] vs. 20.4 [4.2]; z = 4.0, p = 0.001; d = 0.84); MCI-Ad versus MCI-St (20.4 [4.2] vs. 22.3 [3.6]; z = 2.1, p = 0.033; d = 0.48); and MCI-St versus CTR (22.3 [3.6] vs. 24.6 [3.0]; z = 4.1, p < 0.001; d = 0.69). A notable difference was also observed when comparing the baseline OR + MEM scores obtained by the MCI-Ad group (the most difficult to diagnose) with those of controls (20.4 [4.2] vs. 24.6 [3.0]; z = 5.5, p < 0.001; d = 1.15).
The difficulty in identifying differential scores at baseline decreased after five years. By the time of the final assessment, the groups tended to cluster into dementia (AD and MCI-Ad) and non-dementia (MCI-St and CTR), and all the subscales presented significant differences between these groups with and without dementia. The greatest difference continued to be on the combined OR + MEM variable: dementia versus non-dementia (10.2 [4.9] vs. 23.6 [3.8]; z = 15.1, p < 0.001; d = 3.05). Between the AD and MCI-Ad groups, there were no significant differences on any of the subscales, including OR + MEM: AD versus MCI-Ad (9.9 [4.8] vs. 10.9 [5.1]; z = 1.0, p = 0.305). Comparison of the MCI-St and CTR groups revealed that the significant differences found on OR + MEM at baseline were maintained after five years: MCI-St versus CTR (21.7 [4.2] vs. 24.7 [3.1]; z = 4.7, p < 0.001; d = 0.81).
ROC curves
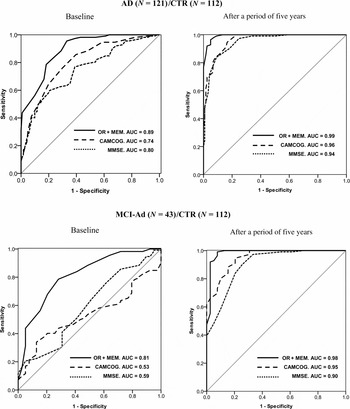
ROC curves were used to carry out a predictive analysis of the subscales, comparing both the AD and MCI-Ad groups with the CTR group (Figure 2 and Table S1, the latter published online as supplementary material attached to the electronic version of this paper at http://www.journals.cambridge.org/ipg).
ROC curves. Ability to predict cognitive decline in the AD and MCI-Ad groups in relation to the control group. AD = Alzheimer's disease; MCI-Ad = mild cognitive impairment converted to AD; CTR = control group; OR + MEM = Orientation + Memory (learning and recent); AUC = area under curve.

At baseline, the AD group had an area under the curve (AUC) above 0.70 on the subscales Orientation (AUC = 0.86), Memory (learning) (AUC = 0.84), and Memory (recent) (AUC = 0.77), while the highest AUC value corresponded to the combined variable OR + MEM (AUC = 0.89). Global scores on the MMSE (AUC = 0.80) and the CAMCOG (AUC = 0.74) showed an acceptable predictive capacity. In the final assessment, these subscales showed an excellent predictive capacity, with AUC values equal to or higher than 0.94.
Baseline results for the MCI-Ad group showed that the same subscales again had a predictive capacity, the AUCs being acceptable although slightly lower than those of the AD group: Orientation, AUC = 0.79; Memory (learning), AUC = 0.73; Memory (recent), AUC = 0.74; and OR + MEM, AUC = 0.81. Global scores on the MMSE (AUC = 0.59) and CAMCOG (AUC = 0.53) had no predictive capacity in the MCI-Ad group. In the final assessment, these subscales had an excellent predictive capacity, with AUC values above 0.94, the same as in the AD group.
Longitudinal improvement and decline
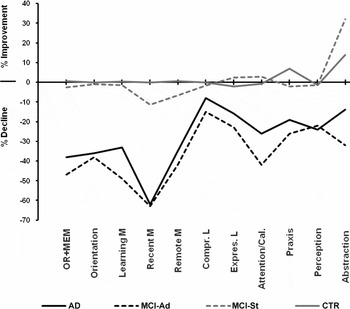
Figure 3 and Table S2 (the latter published online as supplementary material attached to the electronic version of this paper at http://www.journals.cambridge.org/ipg) show the improvement or decline produced between baseline and final scores, with an interval of five years. The AD and MCI-Ad groups showed a significant decline on all the subscales, most notably (>30%) on Orientation, Memory (learning, recent, and remote), and Attention/Calculation; moderately (20–25%) on Perception, Language (expression), Praxis, and Abstraction; and mildly (10%) on Language (comprehension).
Longitudinal changes after five years: Improvement and decline (%) on CAMCOG subscales. AD = Alzheimer's disease; MCI-Ad = mild cognitive impairment converted to AD; MCI-St = mild cognitive impairment-stable; CTR = control group; OR + MEM = Orientation + Memory (learning and recent); M = Memory; L = Language; Compr. = comprehension; Expres. = expression; Cal. = calculation.

In general, subscale scores in the MCI-St and CTR groups remained stable between the two assessment points. The MCI-St group showed a slight decline in recent memory (11.7%) and an improvement on the Abstraction subscale (32.6%), while the CTR group improved slightly on Praxis (6.7%).
Effect of age, education, gender, and depression on baseline subscale scores
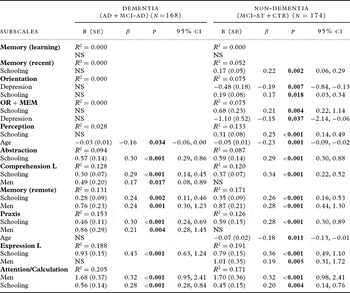
A multivariate linear regression analysis was performed in order to identify any subscales that were affected by these variables. The dependent variables were baseline scores on each of the subscales, while the independent variables were age, gender, years of schooling, and depression (see Table 2).
Influence of age, education, gender, and depression on CAMCOG subscale scores at baseline. Multivariate linear regression analysis

R 2 = coefficient of determination; B = unstandardized coefficient; SE = standard error; β = standardized coefficient; CI = confidence interval for B; NS = not significant.
In the groups with dementia, neither the Orientation nor Memory (learning and recent) subscale nor the OR + MEM variable was affected by age, gender, education, or depression. A higher educational level was associated with better performance on Abstraction, Language (expression and comprehension), Attention/Calculation, Praxis, and Memory (remote). Men performed better on Language (comprehension), Memory (remote), Praxis, and Attention/Calculation. Younger age was related to higher scores on Perception. Depression had no effect on any subscale.
The influence of age, education, and gender was greater in the groups without dementia. A higher educational level was associated with better performance on all the subscales except for Memory (learning). Men performed better on Memory (remote), Language (expression), and Attention/Calculation. Younger age was related to higher scores on Perception and Praxis. Depression had a negative effect on the Orientation subscale and on the OR + MEM variable.
Discussion
In the baseline assessment, the cognitive decline of patients with AD was already more apparent. The main difficulty was identifying those patients with MCI who would go on to develop dementia. In this context, the study presents relevant data for the differential diagnosis of patients with MCI-Ad. Global scores on the MMSE and CAMCOG produced AUC values with null specificity and sensitivity as regards identifying those patients with MCI who were most likely to convert to AD.
Some baseline scores of MCI-Ad patients were similar to those of the groups without dementia, although on some CAMCOG subscales they scored significantly higher (i.e. on Language [expression], Attention/Calculation, and Abstraction with respect to the MCI-ST group, and on Praxis with respect to the CTR group). These higher scores in the MCI-Ad group could, in the baseline assessment, make differential diagnosis difficult. In the ROC analysis, significant differences at baseline were only observed on the combined variable of OR + MEM (Orientation + Memory [learning and recent]), the AUC value being moderate but significant. The same finding was obtained after five years. These data are conclusive in terms of the predictive capacity of Orientation + Memory (learning and recent) at baseline, whereas scores on the subscales Memory (remote), Language, Abstraction, Attention/Calculation, and Praxis have no predictive value.
The analysis of independent variables showed that age, education, gender and depression had no influence on the baseline cognitive scores of the groups with dementia on the subscales Orientation and Memory (learning and recent) or on the OR + MEM variable. This finding suggests that the low initial score on these subscales is related more to the disease. By contrast, years of schooling and depression did have a greater influence in the groups without dementia and could explain the mild decline observed for scores on these variables.
Our findings differ from previous studies using the CAMCOG when it comes to the predictive capacity of the subscales Perception (Lozano-Gallego et al., Reference Lozano-Gallego, Vilalta-Franch, Llinàs-Reglà and López-Pousa1999; Marcos et al., Reference Marcos2006; Armas, Reference Armas2009), Memory (remote) (Nielsen et al., Reference Nielsen, Lolk, Andersen, Andersen and Kragh-Sørensen1999; Schmand et al., Reference Schmand, Walstra, Lindeboom, Teunisse and Jonker2000), Abstraction (Williams et al., Reference Williams, Huppert, Matthews and Nickson2003; Gallagher et al., Reference Gallagher2010), Attention/Calculation (Lozano-Gallego et al., Reference Lozano-Gallego, Vilalta-Franch, Llinàs-Reglà and López-Pousa1999; Nielsen et al., Reference Nielsen, Lolk, Andersen, Andersen and Kragh-Sørensen1999; Williams et al., Reference Williams, Huppert, Matthews and Nickson2003), and Language (Nielsen et al., Reference Nielsen, Lolk, Andersen, Andersen and Kragh-Sørensen1999; Oulhaj et al., Reference Oulhaj, Wilcock, Smith and Jager2009). Specifically, the present study showed that baseline scores on these subscales were highly influenced by education and, to a lesser extent, by gender and age, which could be the reason for the discrepancies. In the initial assessment of cognitive impairment, these variables would not only have an effect in terms of lower discriminant and predictive capacity but may also act as confounders, especially in those MCI patients with a higher educational level and who go on to develop dementia.
As regards longitudinal changes in subscale scores, the data indicate that patients with dementia show a greater decline in Orientation and Memory (learning, recent). The remaining variables either showed a mild decrease (Memory [remote], Attention/Calculation, Language [expression and comprehension], Praxis, and Abstraction) or an intermediate decline (Perception). These differences could be explained using Cattell and Horn's concepts of fluid and crystallized intelligence (Horn, Reference Horn, Craik and Trehud1982). The former subscales would align more with fluid intelligence (genetic mental ability) and they would tend to decline with older age or disease. Conversely, the latter subscales would be closer to crystallized intelligence (experiential mental ability) and would be significantly influenced by education, showing a stronger tendency toward stability.
The data suggest that in terms of diagnostic discrimination at baseline it would be useful, in the neuropsychological assessment, to complement the global scores on the cognitive assessment scales with information from the Orientation and Memory (learning and recent) subscales, or with specific neuropsychological tests that consider these aspects (Tabert et al., Reference Tabert2006; Dierckx et al., Reference Dierckx2009; Chapman et al., Reference Chapman2010; Lekeu et al., Reference Lekeu2010; Rami et al., Reference Rami, Bosch, Sanchez-Valle and Molinuevo2010). Moreover, even with the range of data obtained here, the neuropsychological assessment alone is insufficient for a full and accurate diagnosis at baseline. In this regard, the detection of an AD biomarker would seem to be essential to resolve diagnostic uncertainty in the initial presentation. Medial temporal lobe atrophy, levels of Aβ1–42 and tau proteins in cerebrospinal fluid, decreased blood flow in hippocampal regions, and reduced metabolism in bilateral temporo-parietal areas are documented as being the most powerful biomarkers (Dubois et al., Reference Dubois2007), albeit without achieving complete accuracy. At all events, the biomarker threshold needs to be clarified so as to differentiate pathological cognitive decline from the normal decline that can occur with aging. At present, therefore, the combination of biological markers and neuropsychological tests would seem to offer the most realistic solution as regards predicting the conversion of MCI to AD.
This study presents a number of limitations. First, there may be a selection bias in relation to patients with dementia, since the inclusion criterion of having neuropsychological assessments over a consecutive five-year period excluded several cases. Second, the educational level of the sample, drawn from a semi-rural context, is low, and scores on some of the subscales could vary in more highly educated populations. Third, although the results for the groups with dementia present a higher degree of certainty, the same cannot be said for the groups without dementia, and it is possible that some of the latter participants might go on to develop dementia. This aspect could be addressed through a longer follow-up, especially in the group with MCI-St. Fourth, although the MCI groups included no cases of psychotic disorder some of the patients had suffered a cerebrovascular accident (CVA; n = 7), a factor that could be relevant when comparing the present results with those of studies in which cases of CVA were excluded. Fifth, the number of MCI cases is too small to obtain totally conclusive results. Finally, there could be a bias related to the results in the control group, since data from controls were not collected during the same period as were the data relating to the other three study groups.
Conflict of interest
None.
Description of authors' roles
J.L. Conde-Sala was the principal investigator, designed the study, and wrote the paper. J. Garre-Olmo, J. Vilalta-Franch, and S. López-Pousa reviewed the methodological and statistical analysis. J. Llinàs-Reglà, O. Turró-Garriga, M. Lozano-Gallego, M. Hernández-Ferrándiz, and I. Pericot-Nierga contributed to the recruitment and diagnoses of patients, to the data collection and analysis at the Dementia Unit, Hospital de Santa Caterina, Salt, Spain. In addition, all authors reviewed drafts of the paper prior to publication.