Introduction
At the first retinal synapse, ON- and OFF-bipolar cells respond with opposite polarities to light-induced changes in synaptic glutamate, which is tonically released from photoreceptor terminals in the dark (Werblin & Dowling, Reference Werblin and Dowling1969; Bloomfield & Dowling, Reference Bloomfield and Dowling1985). ON-bipolar cells express a metabotropic glutamate receptor, mGluR6 (Nakajima et al., Reference Nakajima, Iwakabe, Akazawa, Nawa, Shigemoto, Mizuno and Nakanishi1993) that regulates the activity of a nonselective cation channel containing the transient receptor potential member 1 (TRPM1) subunit (Morgans et al., Reference Morgans, Zhang, Jeffrey, Nelson, Burke, Duvoisin and Brown2009, Shen et al., Reference Shen, Heimel, Kamermans, Peachey, Gregg and Nawy2009), via the heteromeric G protein, Go (Dhingra et al., Reference Dhingra, Lyubarsky, Jiang, Pugh, Birnbaumer, Sterling and Vardi2000). In the dark, activation of mGluR6 causes the cation channels to close and the ON-bipolar cells to hyperpolarize. The light-induced decrease in synaptic glutamate shuts off mGluR6 stimulation, thereby causing cation channels to open and generating the depolarizing light response of ON-bipolar cells.
Termination of G protein signaling cascades requires hydrolysis of bound GTP by the activated Gα subunit. In retinal rods, the rapid recovery of the photoresponse is inconsistent with the slow intrinsic rate of GTP hydrolysis by transducin and requires the action of a GTPase activating protein (GAP) complex. In rods, the GAP complex comprises Gβ5 and a member of the R7 subfamily of regulator of G protein signaling (RGS) proteins, RGS9 (He et al., Reference He, Cowan and Wensel1998). Rod photoresponses from transgenic mice lacking RGS9 show normal activation kinetics but a profoundly slowed deactivation time course (Chen et al., Reference Chen, Burns, He, Wensel, Baylor and Simon2000). RGS9–Gβ5 is tethered to the membrane via the anchoring protein, R9AP (Hu & Wensel, Reference Hu and Wensel2002). Rod photoresponses from R9AP-deficient mice also have a slowed deactivation that is indistinguishable from RGS9- or Gβ5-deficient mice (Keresztes et al., Reference Keresztes, Martemyanov, Krispel, Mutai, Yoo, Maison, Burns, Arshavsky and Heller2004), indicating that membrane anchoring of the RGS9–Gβ5 complex is essential for its stability and proper function.
In response to illumination of the retina, glutamate release from photoreceptor terminals is reduced, mGluR6 is no longer stimulated, Go is deactivated, and ON-bipolar cells depolarize within 100 ms (Berntson & Taylor, Reference Berntson and Taylor2000), which is substantially faster than the intrinsic rate of GTP hydrolysis by Go (Higashijima et al., Reference Higashijima, Ferguson, Smigel and Gilman1987; Lan et al., Reference Lan, Remmers and Neubig1998). Similar to the photoreceptor pathway, rapid inactivation of Go would seem to require a GAP complex to accelerate GTP hydrolysis.
RGS7, RGS11, and Gβ5 colocalize with mGluR6 and Go in the dendritic tips of ON-bipolar cells (Morgans et al., Reference Morgans, Weiwei Liu, Wensel, Brown, Perez-Leon, Bearnot and Duvoisin2007; Rao et al., Reference Rao, Dallman, Henderson and Chen2007; Cao et al., Reference Cao, Masuho, Okawa, Xie, Asami, Kammermeier, Maddox, Furukawa, Inoue, Sampath and Martemyanov2009). Additionally, R9AP forms a complex with RGS11 both in vitro (Martemyanov et al., Reference Martemyanov, Yoo, Skiba and Arshavsky2005) and in vivo (Morgans et al., Reference Morgans, Weiwei Liu, Wensel, Brown, Perez-Leon, Bearnot and Duvoisin2007; Song et al., Reference Song, Song, Wensel, Sokolov and Martemyanov2007). Furthermore, R9AP colocalizes with RGS11 and enhances the stability of RGS11–Gβ5 (Cao et al., Reference Cao, Masuho, Okawa, Xie, Asami, Kammermeier, Maddox, Furukawa, Inoue, Sampath and Martemyanov2009). Functionally, mice mutant for RGS11 have a delayed light response measured from the electroretinogram (ERG) b-wave (Chen et al., Reference Chen, Shim, Morhardt, Dallman, Krahn, McWhinney, Rao, Gold and Chen2010; Mojumder et al., Reference Mojumder, Qian and Wensel2009; Zhang et al., Reference Zhang, Jeffrey, Morgans, Burke, Haley, Duvoisin and Brown2010) and from patch-clamp recording of chemically simulated light responses of bipolar cells (Zhang et al., Reference Zhang, Jeffrey, Morgans, Burke, Haley, Duvoisin and Brown2010). In contrast, Cao et al. (Reference Cao, Masuho, Okawa, Xie, Asami, Kammermeier, Maddox, Furukawa, Inoue, Sampath and Martemyanov2009) reported no delay in patch-clamp recordings of light responses from bipolar cells of RGS11-deficient mice.
However, while RGS11 deficiency results in a reduction of R9AP in ON-bipolar cell dendritic tips, there is little reduction in overall retinal expression levels of R9AP, presumably because the vast majority of R9AP is found in the photoreceptors and is unaffected by deletion of RGS11 (Cao et al., Reference Cao, Masuho, Okawa, Xie, Asami, Kammermeier, Maddox, Furukawa, Inoue, Sampath and Martemyanov2009; Zhang et al., Reference Zhang, Jeffrey, Morgans, Burke, Haley, Duvoisin and Brown2010). In contrast, R9AP deficiency results in the complete absence of RGS11 from the retina (Cao et al., Reference Cao, Song, Okawa, Sampath, Sokolov and Martemyanov2008). In this report, using R9AP-deficient mice, we confirm that R9AP is localized to the dendritic tips of ON-bipolar cells and is necessary for the stability of RGS11–Gβ5. Furthermore, we examine the kinetics of light response in mice lacking R9AP using the ERG. We find that in addition to R9AP’s previously described role in the recovery of the photoreceptor light response (Keresztes et al., Reference Keresztes, Martemyanov, Krispel, Mutai, Yoo, Maison, Burns, Arshavsky and Heller2004), it also plays a role in regulating the kinetics of the ON-bipolar cell light response. In R9AP−/− mice, the ERG b-wave, which mostly reflects the responses of ON-bipolar cells to light, is delayed similarly to that reported in RGS11−/− mice (Chen et al., Reference Chen, Shim, Morhardt, Dallman, Krahn, McWhinney, Rao, Gold and Chen2010; Mojumder et al., Reference Mojumder, Qian and Wensel2009; Zhang et al., Reference Zhang, Jeffrey, Morgans, Burke, Haley, Duvoisin and Brown2010). The combined results suggest that the R9AP–RGS11–Gβ5 complex may be a GAP for Go in ON-bipolar cells.
Materials and methods
Animals
R9AP-deficient heterozygous mice were a generous gift from Vadim Arshavsky (Duke University) and Stefan Heller (Stanford University). They were generated using 129/SvJ embryonic stem cells and crossed with C57BL/6 mice (Keresztes et al., Reference Keresztes, Martemyanov, Krispel, Mutai, Yoo, Maison, Burns, Arshavsky and Heller2004). Wild-type (WT) and R9AP−/− mice were littermates from heterozygous matings. Mice were maintained and sacrificed in accordance with guidelines provided by the NIH and Oregon Health & Science University (OHSU) and conform to principles regarding the care and use of animals adopted by the American Physiological Society and the Society for Neuroscience. All experiments were reviewed and approved by the OHSU Institutional Animal Care and Use Committee.
Immunohistochemistry
Adult mice were euthanized with an overdose of pentobarbital. Preparation of retinal sections was carried out as previously described (Morgans et al., Reference Morgans, Weiwei Liu, Wensel, Brown, Perez-Leon, Bearnot and Duvoisin2007). Confocal images were acquired on an Olympus Fluoview1000 with a focal plane ≤1 μm. The following antibodies (and dilutions) were used in these studies: a rabbit polyclonal antibody (R4612) raised against full-length bovine RGS7 (1:1000) and a goat polyclonal antibody against a Gβ5 peptide (MATDGLHENETLASLKC; 1:1000) both produced by Bethyl Laboratories (Montgomery, TX; Morgans et al., Reference Morgans, Weiwei Liu, Wensel, Brown, Perez-Leon, Bearnot and Duvoisin2007); a rabbit polyclonal antibody raised against residues 248–471 of mouse RGS11 (1:1000–1:5000; Chen et al., Reference Chen, Eversole-Cire, Zhang, Mancino, Chen, He, Wensel and Simon2003); a goat polyclonal antiserum raised against R9AP (1:1000; Hu & Wensel, Reference Hu and Wensel2002); an affinity purified sheep polyclonal antibody against mGluR6 (1:100; Morgans et al., Reference Morgans, Ren and Akileswaran2006); and a mouse monoclonal antibody (clone MC5) against PKCα (1:5000; Sigma-Aldrich, St. Louis, MO).
HEK293 cell transfection
HEK293 cells were grown and transfected as previously described (Morgans et al., Reference Morgans, Ren and Akileswaran2006). Cells were transfected with 200–500 ng each of plasmids encoding RGS11, Gβ5, plus or minus R9AP. For immunoprecipitations (IPs), transfected cells were solubilized in IP buffer (1% NP40, 0.5% deoxycholate, 0.1% sodium dodecyl sulfate (SDS), 1 mm ethylenediaminetetraacetic acid (EDTA), 150 mm NaCl, 50 mm Tris, pH 8.0) by incubation on ice for 1 h and insoluble material was removed by centrifugation for 30 min at 20,000 × g. Aliquots of 0.5 ml extract containing 20 μg protein were precleared with 20 μl 50% protein A-sepharose beads and then incubated overnight at 4°C with another 10 μl beads in the presence or absence of 0.5 μl R9AP antiserum. The beads were washed twice with IP buffer, then with IP buffer without detergent, and finally subjected to SDS-polyacrylamide gel electrophoresis (PAGE) and western blotting for RGS11.
Immunoblotting
Two adult retinas each from WT and R9AP−/− mice were homogenized in a buffer containing 125 mm Tris, pH 6.8, 1% Triton X-100, 0.1% SDS, plus one Complete Mini-Protease Inhibitor Tablet (+EDTA) (Roche, South San Francisco, CA) per 10 ml, and the protein concentration was determined using the BCA reagent (Pierce, Rockford, IL). Ten micrograms of total protein from each extract was subjected to SDS-PAGE on a 4–12% gradient gel (NuPage; Invitrogen, San Diego, CA). After blotting onto Immobilon (Millipore, Billerica, MA), the membranes were treated with blocking reagent (Rockland Immunochemicals, Gilbertsville, PA) and the blots were incubated for 2–4 h with the appropriate dilutions of the primary antibodies (affinity purified anti-RGS7—1:5000; anti-RGS11 antiserum—1:20,000; anti-R9AP antiserum—1:10,000; and anti-Gβ5 antiserum—1:20,000). After three rinses in Tris-buffered saline containing 0.1% Tween-20, the blots were incubated with appropriate secondary antibodies, which were fluorescently tagged with Alexa680 or Alexa800 (1:10,000 dilution). Blot fluorescence was imaged on a LiCor Odyssey Infrared Imaging System (LiCor, Lincoln, NE).
Electron microscopy
Posterior eyecups were placed in chilled fixative containing 1% paraformaldehyde, 2.5% glutaraldehyde, 3% sucrose, and 0.01% calcium chloride in 0.1 m phosphate buffer (PB; pH 7.4) for 24 h. Postfixation was performed with 1% OsO4 in 0.1 m PB. The tissue was then dehydrated through graded ethanol solutions and propylene oxide before embedding in EM-bed 512 resin. Ultrathin sections (90 nm) were collected on copper grids and contrasted with uranyl acetate and lead citrate before viewing on a Tecnai 12 electron microscope using an operating voltage of 80 kV. Digital micrographs were acquired with an AMT 542 camera (Advanced Microscopy Techniques, Danvers, MA).
ERG recording
Six mice (three WT and three R9AP−/−) were dark-adapted overnight (>12 h) and prepared for recording under dim red light. Animal preparation and anesthesia for ERG were as previously described (Morgans et al., Reference Morgans, Zhang, Jeffrey, Nelson, Burke, Duvoisin and Brown2009; Zhang et al., Reference Zhang, Jeffrey, Morgans, Burke, Haley, Duvoisin and Brown2010). Full-field scotopic ERGs were recorded to flashes of increasing intensity [−4.5 to 2.2 log scotopic candela-s/metre2 (sc cd-s/m2)]. The interflash interval ranged from 3 s for the dimmest intensity up to 10 s for the flash intensity (−1.9 log sc cd-s/m2) that produced maximal b-wave amplitude for both WT and R9AP−/− mice. For higher flash intensities (−0.4 to 2.2 log sc cd-s/m2), the interflash interval ranged from 45 to 90 s for WT mice and 180–300 s for R9AP−/− mice. The longer interflash interval for R9AP−/− mice was necessary in order to achieve complete ERG recovery between successive bright flashes. ERGs were the averages of multiple responses varying from n = 15 for the dimmest flash to n = 2 for a −1.9 log sc cd-s/m2. For higher flash intensities, ERGs were recorded to a single flash. A flash intensity of 1 log sc cd-s/m2 is equivalent to approximately 2.7 log photoisomerizations (Lyubarsky et al., Reference Lyubarsky, Daniele and Pugh2004). ERGs were low-pass filtered (−3 dB) at 300 Hz for intensities lower than −0.4 log sc cd-s/m2 and at 1000 Hz for higher intensities. ERGs were amplified (2–10 k) and high-pass filtered (−3 dB at 0.3 Hz) before being sampled at 5 kHz with a 12-bit A/D converter and stored for off-line analysis.
ERG analysis
In order to study the kinetics of the rising phase of the ERG response, the rate of rise was calculated from the derivative of the filtered ERG (dERG(t)/dt) for flash intensities below −1.5 log sc cd-s/m2 before intrusion of the a-wave. For higher flash intensities, the derivative was calculated from the isolated P2 response after filtering (see Results). For both the ERG and the P2 responses, filtering involved digital isolation and subtraction of the oscillatory potentials. The oscillatory potentials (OPs) were digitally isolated with an anticausal Chebychev filter (−3 dB at 30 and 300 Hz) using Matlab routines written by one of the authors (B.G.J.). The lower cutoff of the band-pass filter was set at 30 Hz, which enabled isolation of all OPs but did not introduce distortion into the rising phase of the ERG response (see Fig. 5 in Results). The maximum rate of rise was obtained from the peak of the derivative.
To quantify photoreceptor kinetics, a P3 model was ensemble fit to the leading edges of bright flash ERG a-wave (Birch et al., 1995) recorded for flash intensities from 0.7 to 2.2 log cd-s/m2. For each flash intensity, the “leading edge” was determined to be all points with amplitude less than 80% of the a-wave peak. The 80% value was chosen to avoid the influence of postreceptoral components that may contribute to the a-wave near its peak (Robson & Frishman, Reference Robson and Frishman1999). During fitting, RmaxP3 was fixed at the maximal a-wave amplitude obtained and S and td were varied. The derived parameters were S ((sc cd-s/m2)−1s−2), the rod sensitivity parameter that scales flash intensity, td (ms), the delay due to the filter and finite duration of the flash, and RmaxP3 (μV), the maximal rod response.
Statistics
Latency and amplitude measurements of both the ERG b-wave and the rate of rise functions were compared using a repeated measures (intensity) analysis of variance testing for the main effect of mutation versus nonmutation. Bonferonni correction was used to account for multiple comparisons. The level of statistical significance was set at P < 0.05 before Bonferonni correction. Phototransduction parameters were compared using two-tailed student’s t-test.
Results
R9AP is expressed in ON-bipolar cell dendrites
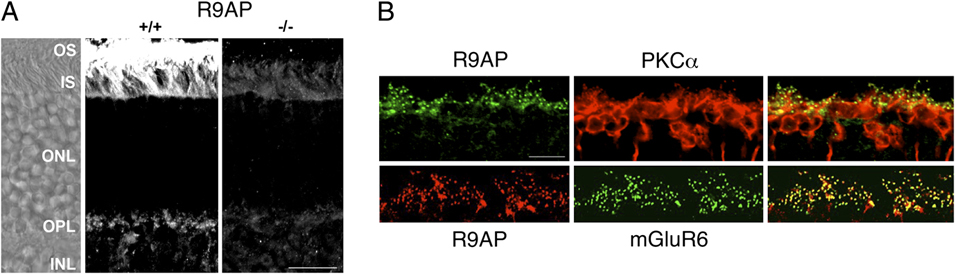
Immunofluorescent staining of R9AP in the mouse retina was detected as discrete puncta in the outer plexiform layer (OPL) in addition to the expected strong immunofluorescent staining in outer segments (Fig. 1A). Immunoreactivity was absent in the R9AP−/− retina demonstrating the specificity of the antibody. To determine whether R9AP was localized within ON-bipolar cell dendrites, mouse retinal sections were double labeled with either mGluR6 or PKCα, a marker of rod bipolar cells (Haverkamp et al., Reference Haverkamp, Grünert and Wässle2000). PKCα was distributed throughout bipolar cells, but R9AP was confined to the dendritic tips of the rod bipolar cell dendrites (Fig. 1B, top). Double labeling for R9AP and mGluR6 confirmed the colocalization of these two proteins in ON-bipolar cell dendritic tips (Fig. 1B, bottom).
R9AP is localized to the tips of ON-bipolar cell dendrites. (A) Vertical cryosections from WT (+/+) and R9AP-deficient (−/−) mouse retina were labeled for R9AP by immunofluorescence. Left panel: Nomarsky image of the +/+ retina section in the middle panel. OS, outer segments; IS, inner segments; ONL, outer nuclear layer; OPL, outer plexiform layer; INL, inner nuclear layer. The scale bar represents 10 μm. (B) Top row: Mouse retina section double labeled for R9AP (left, green) and PKCα (middle, red). Bottom row: OPL of a mouse retina section double labeled for R9AP (left, red) and mGluR6 (middle, green). Merged images are shown on the right; colocalization of the two antigens appears yellow. The scale bar applies to all panels and represents 10 μm.

In photoreceptors, proper assembly of the RGS9–Gβ5–R9AP complex is required for proteolytic stability of the individual components. Therefore, we examined the effects of R9AP deletion on the expression of potential binding partners Gβ5, RGS11, and RGS7 in the OPL. Genetic deletion of R9AP caused a dramatic reduction of Gβ5 and the total absence of RGS11 immunofluorescence in the OPL (Fig. 2B). In contrast, strong punctate RGS7 immunoreactivity was present in both WT and R9AP−/− retinal sections (Fig. 2B). There were no ultrastructural abnormalities detectable in electron micrographs from the OPL of R9AP−/− mice (Fig. 2C).
The R9AP−/− retina lacks RGS11 but has normal OPL ultrastructure. (A) Western blots of retinal extracts from R9AP +/+ and −/− littermates were probed for Gβ5, RGS7, RGS11, and R9AP. (B) Retina sections from R9AP +/+ and −/− littermates were labeled by immunofluorescence for Gβ5, RGS7, and RGS11. (C) Transmission electron micrograph showing normal ultrastructure of the OPL in the R9AP-deficient mouse. The examples show a rod spherule (left) and a cone pedicle (right) showing normal invagination of postsynaptic horizontal cell processes (H) and bipolar cell dendrites (B) at the ribbon synapses (arrowheads). Scale bar = 0.2 μm. (D) RGS11 western blot of lane 1: extract from cells transfected with RGS11, Gβ5, and R9AP precipitated with protein G-sepharose beads alone; lane 2: extract immunoprecipitated with an antibody to R9AP and protein G-sepharose beads; lane 3: total extract.

When total retinal expression levels were examined using immunoblots, R9AP and RGS11 were undetectable in retinal extract from R9AP−/− mice (Fig. 2A); RGS9 was also undetectable (data not shown). In comparison, the intensity of the RGS7 band appeared elevated in immunoblots from R9AP−/− mice. Gβ5L, which is expressed specifically in photoreceptor outer segments (Watson et al., Reference Watson, Aragay, Slepak and Simon1996), was undetectable in R9AP−/− mice as previously reported (Cao et al., Reference Cao, Song, Okawa, Sampath, Sokolov and Martemyanov2008). However, the expression of the short form, Gβ5S, was not reduced in the R9AP−/− retina (Fig. 2A), most likely reflecting its expression in the inner plexiform layer (Cao et al., Reference Cao, Song, Okawa, Sampath, Sokolov and Martemyanov2008), where it may be stabilized by interaction with other proteins. These combined results indicate that R9AP colocalizes with mGluR6 receptors in the dendritic tips of ON-bipolar cells and that R9AP is required for the stable expression of RGS11 and Gβ5 in the OPL, in agreement with a recent report (Cao et al., Reference Cao, Masuho, Okawa, Xie, Asami, Kammermeier, Maddox, Furukawa, Inoue, Sampath and Martemyanov2009).
Binding between R9AP and RGS11 was investigated by transfection of HEK293 cells with plasmids encoding RGS11 and Gβ5, plus or minus an R9AP plasmid. Coimmunoprecipitation of R9AP from extracts of the transfected cells followed by western blotting for RGS11 confirmed binding between RGS11 and R9AP (Fig. 2D).
Elimination of R9AP alters the ERG b-wave
To investigate the effect of genetic ablation of R9AP on the retinal light response, we compared ERGs from WT and R9AP−/− mice. Fig. 3A shows mean ERG waveforms from R9AP−/− and WT mice for select flash intensities covering the range used. The peaks of the ERG b-waves were significantly delayed (P < 0.04) in R9AP−/− mice on average (±s.e.) by 8.2 ± 1.8 ms for lower flash intensities (≤−1.5 log sc cd-s/m2; Fig. 3A, lower panel). There was also a trend for larger b-waves in these mice, although the increase was not significant (P = 0.5). Analysis of the ERG b-wave at higher flash intensities was completed after subtraction of the ERG a-wave (see below). WT and R9AP-deficient mice had essentially identical bright flash ERG a-waves (Fig. 3B); phototransduction parameters derived from the fit of a P3 model to the ERG a-wave were not significantly different between WT (RmaxP3 = −770 ± 61 μV, S = 1359 ± 315 ((sc cd-s/m2)−1 s−2) and R9AP−/− (RmaxP3 = −776 ± 44 μV, S = 1025 ± 69 ((sc cd-s/m2)−1 s−2) mice. The a-wave results indicate that the delay in the scotopic ERG b-wave of R9AP−/− mice reflects changes downstream of the photoreceptors. However, interpretation of the ERG b-wave delay with respect to ON-bipolar cell signaling is confounded by two factors. First, while the mouse ERG b-wave largely reflects ON-bipolar signaling, other retinal layers may also shape the waveform (Frishman, Reference Frishman, Ryan, Hinton, Schachat and Wilkinson2006). Second, recovery of the photoreceptor response is dramatically slowed in R9AP-deficient mice (Keresztes et al., Reference Keresztes, Martemyanov, Krispel, Mutai, Yoo, Maison, Burns, Arshavsky and Heller2004), which in turn may affect ERG b-wave kinetics. Since our primary purpose was to ascertain the role of R9AP in shaping the ON-bipolar cell light response, we analyzed the ERG results using two approaches designed to minimize these confounding factors.
R9AP deficiency slows the ERG b-wave. (A) Mean ERGs from WT (gray traces) and R9AP−/− (black traces) mice for a representative range of flash intensities. Numbers to the left of traces indicate flash intensities in log sc cd-s/m2. Note change of scale for flash intensities greater than 0 log sc cd-s/m2. (B) Mean ERGs to four high flash intensities shown over a shorter time base highlight the similarity in the ERG a-waves between WT (gray traces) and R9AP−/− (black traces) mice.

In the first approach, we analyzed the ERG over the flash intensity range for which the photoreceptors make little or no contribution to the massed ERG response. To establish the appropriate flash intensity range, we analyzed ERGs from TRPM1-deficient mice, which have no ERG b-wave (Morgans et al., Reference Morgans, Zhang, Jeffrey, Nelson, Burke, Duvoisin and Brown2009; Shen et al., Reference Shen, Heimel, Kamermans, Peachey, Gregg and Nawy2009). For TRPM1−/− mice, the amplitude of the ERG a-wave, generated by the photoreceptors, was less than 4% of overall ERG amplitude from their WT littermates for flash intensities below −2.5 log sc cd-s/m2 (Morgans et al., Reference Morgans, Zhang, Jeffrey, Nelson, Burke, Duvoisin and Brown2009). Fig. 4A shows the ERG (top trace) from a WT mouse in response to a −2.5 log sc cd-s/m2 flash. The high frequency oscillatory potentials superimposed on the ERG, generated within the proximal retina (Wachtmeister, Reference Wachtmeister1998), were digitally isolated (Fig. 4A, bottom trace) and subtracted from the ERG (see Methods). The kinetics of the resulting filtered ERG b-wave were not altered by OP removal (Fig. 4A, middle trace).
R9AP deficiency delays the onset of the rising phase of the ERG b-wave (A) ERG to a −2.5 log sc cd-s/m2 flash (top). Filtered ERG b-wave (middle) was obtained following digital subtraction of the OP’s (bottom) from the ERG. (B) Mean filtered ERG b-waves from WT (gray traces) and R9AP−/− (black traces) mice to a −2.5 log sc cd-s/m2 flash. Dotted lines show traces 1 s.e. either side of the mean. (C) The means of the derivatives of the filtered ERGs to the −2.5 log sc cd-s/m2 flash. The peak of the derivative (arrows) corresponds to the maximal slope of the rising phase of the filtered ERG b-wave. (D) Latencies to reach maximum slope as a function of flash intensity. Error bars, ±s.e.

Fig. 4B shows mean filtered ERG b-waves (solid lines) ± s.e.m. (dotted lines) from R9AP−/− and WT mice in response to a −2.5 log sc cd-s/m2 flash. Both the onset and the peak of the filtered ERG b-wave are clearly delayed in R9AP−/− mice. What is unclear from Fig. 4B is whether the delay in the peak of the filtered b-wave results solely from the delay in the onset of the rising phase of the ERG b-wave or whether there is also a decrease in the slope of the rising phase. In order to investigate this issue, the maximum rate of rise (i.e., maximal slope) of the filtered ERG was calculated from the derivative of the response (see Methods). Fig. 4C shows the means of the derivatives of the filtered ERGs for the −2.5 log sc cd-s/m2 flash. Derived parameters were the maximal slope of the rising phase of the ERG, defined by the peak of the derivative (arrows), and the latency to reach this maximal slope. Fig. 4D shows the latency to reach maximal slope plotted as a function of flash intensity. The latency to reach maximal slope of R9AP−/− mice was delayed on average (±s.e.) by 10.2 ± 0.6 ms in comparison with WT mice, although the difference did not reach statistical significance (P = 0.07). There was also no significant difference in maximum slope between R9AP−/− and WT mice (P = 0.38). The 10.2 ms delay in the time to reach maximal slope in the R9AP−/− mice, while not reaching significance, is similar to the 8.2 ms delay in the ERG b-wave in these mice (Fig. 3A). These results suggest that the delayed b-wave peak in the R9AP−/− mice results from a delay in the onset of the b-wave response and not from a decrease in the slope of the rising phase of the ERG b-wave.
While the above analysis eliminates or minimizes photoreceptor contribution to the rising phase of the ERG b-wave, it is possible that the delayed onset of the b-wave in R9AP−/− mice could be due to slowed photoreceptor recovery. To address this possibility, we used a second approach in comparing the ERG between R9AP−/− and WT mice. For this approach, we identified the ERG conditions for which the slowed rod recovery of the R9AP−/− mice did not alter the rising phase of the ERG b-wave. To achieve this aim, the following conditions were met for both WT and R9AP−/− mice: First, the flash intensity used was sufficiently bright to rapidly drive rods into saturation, which was maintained throughout the course of the b-wave. This light intensity would terminate release of glutamate from saturated photoreceptors, ensuring that the derived bipolar cell response is solely dependent on the rate of glutamate clearance from the synapse and/or the rate of shutoff of the mGluR6-mediated cascade. Under these conditions, all ON-bipolar cell responses should rise at the same rate. Second, photoreceptor and proximal retinal contributions were digitally isolated and subtracted from the ERG to derive the ON-bipolar cell response.
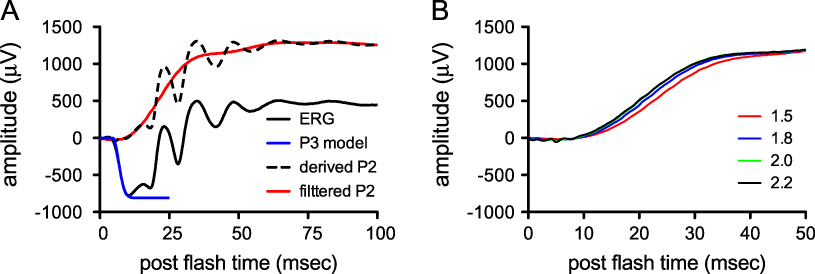
Fig. 5A shows the derivation of the bipolar cell contributions to the bright flash ERG using the conditions described above. The ERG of a WT mouse (Fig. 5A, solid black line) was recorded in response to a bright flash (1.8 log cd-s/m2). At this flash intensity, rods were driven rapidly into saturation, some 5–10 ms before the onset of the rising phase of the ERG b-wave in the WT and R9AP−/− mice, respectively (Fig. 3B). For this bright 1.8 log cd-s/m2 flash, rods stay saturated for >1 s (data not shown), thereby exceeding the time course of the b-wave (Fig. 3A).
Isolation of the P2 response. (A) ERG to a 1.8 log sc cd-s/m2 flash (solid black line); phototransduction P3 model fit to the leading edge of the ERG a-wave (blue line); postphotoreceptoral ERG after subtraction of P3 model fit (dashed black line); P2 response following digital subtraction of OPs (red line). (B) P2 responses from a WT mouse generated by flash intensities of 1.5, 1.8, 2.0, and 2.2 log sc cd-s/m2 (responses to highest 3 flash intensities overlap).

The photoreceptor contribution was removed by subtraction of the P3 model (Fig. 5A, blue line) to give the postreceptoral P2 response (Fig. 5A, dashed line). Subsequent digital filtering removed all oscillatory potentials without altering the kinetics of the rising phase of P2 (Fig. 5A, red line). The resulting P2 response represents the contribution of the bipolar cells to the rising phase of the ERG b-wave. P2 responses derived from four bright flash intensities (1.5, 1.8, 2.0, and 2.2 log cd-s/m2) all rose in parallel (Fig. 5B), indicating photoreceptors were saturated before onset of the b-wave.
Fig. 6A shows the mean derived P2 (solid lines) ± s.e. (dotted lines) from R9AP−/− and WT mice in response to a 1.8 log sc cd-s/m2 flash. This result provides further evidence that a delay in ON-bipolar cell signaling underlies the delayed rising phase of the ERG b-wave in R9AP−/− mice. Maximal P2 amplitude was significantly larger (P < 0.04) in R9AP−/− mice (mean ± s.e.: 1865 ± 176 μV) compared with WT mice (1225 ± 116 μV). As for dim flash intensities, the maximum slope of the rising phase of the P2 response and latency to this maximum slope were derived from the derivative of the P2 response (Fig. 6B). Fig. 6C shows the latency to reach maximal slope of the rising phase of the P2 response as a function of flash intensity. R9AP−/− mice were significantly delayed (P < 0.001) in comparison with WT mice. By comparison, there was no difference in maximum rate of rise of the P2 response between WT and R9AP−/− mice (P = 0.52). R9AP−/− mice were delayed on average (±s.e.) by 13.2 ± 0.5 ms in comparison with WT mice.
R9AP deficiency delays the onset of the rising phase of the bright flash P2 response. For all graphs, gray traces are from WT mice and black traces are from R9AP−/− mice. Dotted lines show traces 1 s.e. either side of the mean. (A) Mean P2 responses to a 1.8 log sc cd-s/m2 flash. (B) The means of the derivatives of the P2 response for a 1.8 log sc cd-s/m2 flash. (C). Latencies to reach maximum slope on the rising phase of the P2 response as a function of flash intensity. Error bars, ±s.e.

The two approaches used to minimize the confounding factors, stemming from nonbipolar cell contributions to the ERG b-wave and slower photoreceptor recovery in the R9AP-deficient mice, produced consistent results. Both approaches indicated a relatively constant delay in the time to reach the maximal rate of rise in R9AP−/− mice but no change in maximal b-wave slope. Additionally, the delay to maximal rate of rise is similar to the delay in the peak of the b-wave in the R9AP−/− mice. Thus, the delay in the ERG b-wave peak in R9AP−/− mice results from a delay in the onset of the ERG b-wave.
Discussion
Within the retina, R9AP is predominantly located in photoreceptor outer segments where it serves to anchor RGS9–Gβ5L to the disc membrane (Hu & Wensel, Reference Hu and Wensel2002; Lishko et al., Reference Lishko, Martemyanov, Hopp and Arshavsky2002). R9AP also stabilizes the expression of RGS9–Gβ5 (Keresztes et al., Reference Keresztes, Martemyanov, Krispel, Mutai, Yoo, Maison, Burns, Arshavsky and Heller2004) and dramatically increases the ability of RGS9–Gβ5 to stimulate transducin GTPase activity (Hu & Wensel, Reference Hu and Wensel2002; Lishko et al., Reference Lishko, Martemyanov, Hopp and Arshavsky2002; Baker et al., Reference Baker, Martemyanov, Shavkunov and Arshavsky2006). Genetic ablation of R9AP in mice dramatically slows recovery of the rod photoresponse (Keresztes et al., Reference Keresztes, Martemyanov, Krispel, Mutai, Yoo, Maison, Burns, Arshavsky and Heller2004). This slowed recovery is likely due to the concurrent loss of RGS9 and Gβ5 since mice lacking either of these proteins also have a delayed recovery of the light response (Chen et al., Reference Chen, Burns, He, Wensel, Baylor and Simon2000; Krispel et al., Reference Krispel, Chen, Simon and Burns2003).
Here, we confirm that, in addition to photoreceptors, R9AP is also located in the dendrites of ON-bipolar cells in the OPL where it colocalizes with mGluR6 in agreement with a previous report (Cao et al., Reference Cao, Masuho, Okawa, Xie, Asami, Kammermeier, Maddox, Furukawa, Inoue, Sampath and Martemyanov2009). Within the retina, RGS9 is not found outside the photoreceptors but the related proteins RGS7 and RGS11 are found in ON-bipolar cell dendrites (Morgans et al., Reference Morgans, Weiwei Liu, Wensel, Brown, Perez-Leon, Bearnot and Duvoisin2007; Rao et al., Reference Rao, Dallman, Henderson and Chen2007; Song et al., Reference Song, Song, Wensel, Sokolov and Martemyanov2007; Cao et al., Reference Cao, Masuho, Okawa, Xie, Asami, Kammermeier, Maddox, Furukawa, Inoue, Sampath and Martemyanov2009; Chen et al., Reference Chen, Shim, Morhardt, Dallman, Krahn, McWhinney, Rao, Gold and Chen2010; Mojumder et al., Reference Mojumder, Qian and Wensel2009; Zhang et al., Reference Zhang, Jeffrey, Morgans, Burke, Haley, Duvoisin and Brown2010). Coimmunoprecipitation studies indicate that both R9AP and Gβ5 form complexes with RGS11 in vivo (Morgans et al., Reference Morgans, Weiwei Liu, Wensel, Brown, Perez-Leon, Bearnot and Duvoisin2007; Song et al., Reference Song, Song, Wensel, Sokolov and Martemyanov2007; Cao et al., Reference Cao, Masuho, Okawa, Xie, Asami, Kammermeier, Maddox, Furukawa, Inoue, Sampath and Martemyanov2009), and pull-down assays indicate that glutathione S-transferase tagged R9AP and recombinant RGS11–Gβ5 interact in vitro (Martemyanov et al., Reference Martemyanov, Yoo, Skiba and Arshavsky2005). Immunological studies show that R9AP deficiency results in the total absence of RGS11, a substantial reduction in Gβ5 from the OPL, but an increase in RGS7 expression (Fig. 2 and Cao et al., Reference Cao, Masuho, Okawa, Xie, Asami, Kammermeier, Maddox, Furukawa, Inoue, Sampath and Martemyanov2009). In contrast, R9AP is not totally absent from the retina of RGS11-deficient mice (Cao et al., Reference Cao, Masuho, Okawa, Xie, Asami, Kammermeier, Maddox, Furukawa, Inoue, Sampath and Martemyanov2009; Zhang et al., Reference Zhang, Jeffrey, Morgans, Burke, Haley, Duvoisin and Brown2010) but instead is displaced from ON-bipolar cell dendritic tips and no longer anchored to the membrane (Cao et al., Reference Cao, Masuho, Okawa, Xie, Asami, Kammermeier, Maddox, Furukawa, Inoue, Sampath and Martemyanov2009).
These combined results indicate that R9AP is required for the stable expression of RGS11–Gβ5 in the OPL. Thus, within the retina, R9AP serves a common purpose for the stable expression and anchoring of RGS11–Gβ5 in ON-bipolar cells and RGS9–Gβ5 in photoreceptors. Human subjects with mutations in the gene encoding R9AP (Nishiguchi et al., Reference Nishiguchi, Sandberg, Kooijman, Martemyanov, Pott, Hagstrom, Arshavsky, Berson and Dryja2004; Cheng et al., Reference Cheng, Luu, Yong, Mathur, Aung and Vithana2007) have visual impairments that may therefore be attributed to slowing of both the rod recovery and the onset of the ON-bipolar cell light response.
ERG b-waves recorded from R9AP-deficient mice were indeed delayed by 10–13 ms, similar in magnitude to the delays reported for RGS11-deficient mice (Mojumder et al., Reference Mojumder, Qian and Wensel2009; Zhang et al., Reference Zhang, Jeffrey, Morgans, Burke, Haley, Duvoisin and Brown2010). The maximum rate of rise of the ERG response corresponding to the rate of ON-bipolar cell depolarization is not altered in either RGS11-deficient mice (Zhang et al., Reference Zhang, Jeffrey, Morgans, Burke, Haley, Duvoisin and Brown2010) or R9AP-deficient mice (Figs. 4 and 6). The similarities in the ERG results indicate that the RGS11- and R9AP-deficient mice are functionally equivalent. Two lines of evidence support the conclusion that the delay in the onset of the ERG b-wave in R9AP- and RGS11-deficient mice originates within the ON-bipolar cells. First, the delay in the onset of the ERG b-wave in RGS11-deficient mice remained after inner retinal contributions to the ERG were blocked by intravitreal injection of GABA (Mojumder et al., Reference Mojumder, Qian and Wensel2009). Second, patch-clamp recordings of chemically simulated light responses of rod bipolar cells, which bypass the photoreceptors, confirm a significant delay in the onset of the ON-bipolar cell response in mice deficient in RGS11 and with a deletion mutation in RGS7 (Zhang et al., Reference Zhang, Jeffrey, Morgans, Burke, Haley, Duvoisin and Brown2010). While Cao et al. (Reference Cao, Masuho, Okawa, Xie, Asami, Kammermeier, Maddox, Furukawa, Inoue, Sampath and Martemyanov2009) reported no delay in patch-clamp recordings of light responses from bipolar cells of RGS11-deficient mice, closer inspection of their fig. 9B suggests a small delay in the onset of the response from these mice. While ON-bipolar cell responses are delayed in both R9AP- and RGS11-deficient mice, the magnitudes of these delays (<25 ms) are far less than expected if RGS11–Gβ5–R9AP was the predominant GAP complex for Go in ON-bipolar cells. Instead, the delay in the onset of the ON-bipolar cell response in R9AP- and RGS11-deficient mice suggests a role for RGS11–Gβ5–R9AP in accelerating the early phase of Go inactivation and that additional RGS proteins may be involved.
An unexpected finding in our study was an increase in the P2 amplitudes to a bright flash in R9AP-deficient mice compared with the WT controls (Fig. 6). Larger P2 amplitudes in the R9AP-deficient mice are consistent with larger ERG b-wave amplitudes reported for RGS9-deficient mice (Lyubarsky et al., Reference Lyubarsky, Naarendorp, Zhang, Wensel, Simon and Pugh2001) and in mice deficient in RGS11, particularly when combined with a deletion mutation in RGS7 (Mojumder et al., Reference Mojumder, Qian and Wensel2009; Zhang et al., Reference Zhang, Jeffrey, Morgans, Burke, Haley, Duvoisin and Brown2010). The peak of the ERG b-wave/P2 response and the kinetics of the falling phase can be shaped by feedback mechanisms at the level of bipolar cell terminals (Kapousta-Bruneau, Reference Kapousta-Bruneau2000; McCall et al., Reference McCall, Lukasiewicz, Gregg and Peachey2002; Mojumder et al., Reference Mojumder, Qian and Wensel2009); therefore, further studies will be needed to identify the origin of the increased P2 amplitude in the R9AP-deficient mouse.
We have shown here that RGS11–Gβ5–R9AP affects the initial kinetics of the ON-bipolar cell light response but not the maximal rate of rise. GTP hydrolysis by Go would be expected to limit the kinetics of the ON-bipolar cell light response beyond the first 20 ms; thus, it is probable that an additional GAP protein is involved in this later phase. Other RGS proteins that could fulfill this role have been identified in gene profiling studies of fluorescently tagged ON-bipolar cells and include RGS7, RGS16, RGS19, and RET-RGS1 (Dhingra et al., Reference Dhingra, Sulaiman, Xu, Fina, Veh and Vardi2008). RGS7, for example, is colocalized with mGluR6, similar to RGS11 (Morgans et al., Reference Morgans, Weiwei Liu, Wensel, Brown, Perez-Leon, Bearnot and Duvoisin2007; Cao et al., Reference Cao, Song, Okawa, Sampath, Sokolov and Martemyanov2008; Mojumder et al., Reference Mojumder, Qian and Wensel2009), and its presence in ON-bipolar cell dendrites appears unaffected by the absence of R9AP (Fig. 2). Thus, it is possible that RGS7 can compensate for the lack of RGS11–Gβ5–R9AP complex in ON-bipolar cell dendrites.
Acknowledgments
Many thanks to Jacqueline Gayet for expert assistance with the mouse colony and Sue Aicher for assistance with the electron microscopy. This study was supported by National Institutes of Health grants EY09534 (R.M.D.), EY014700 and EY018625 (C.W.M.), MH067094 (R.L.B.), and RR000163 and an National Health and Medical Research Council Overseas Biomedical Research Fellowship (Australia) and an American Australian Association Fellowship (T.P.).