Introduction
In over one hundred years of research there has been limited scientific sampling of fishes in the Ross Sea, with few systematic surveys aimed at describing the community of fishes and how the community might be structured by environmental factors. Most of the sampling has been opportunistic or has been limited by resources or conditions. Sampling the Ross Sea for fishes presents numerous challenges, because the area is remote, the Ross Sea has a permanent ice zone in southern areas, and it is subject to seasonal pack ice which in some years can be extensive. Hence our knowledge of the fish fauna, and structure of fish communities, is limited.
Major studies of the Ross Sea fish fauna in recent decades include Eastman & Hubold (Reference Eastman and Hubold1999) who reported on 979 specimens from 20 bottom trawl stations from the south-western Ross Sea. They recorded a total of 47 species including four new species, and concluded that “even in relatively shallow water, knowledge of specific and intraspecific diversity in the Ross Sea fauna is incomplete”. Donnelly et al. (Reference Donnelly, Torres, Sutton and Simoniello2004) reported 45 species of benthic and pelagic fishes sampled from 41 midwater and six bottom trawl stations in the eastern Ross Sea, and found highest diversity between 450 and 500 m depth. Other historical fish sampling was summarized in Headland (Reference Headland1990) and Eastman & Hubold (Reference Eastman and Hubold1999).
A number of studies have investigated whether faunal composition in the Antarctic marine region may vary with latitude, but most have focused on benthic invertebrate communities (e.g. Cummings et al. Reference Cummings, Thrush, Norkko, Andrew, Hewitt, Funnell and Schwarz2006, De Domininco et al. Reference De Domininco, Chiantore, Buongiovanni, Ferranti, Ghione, Thrush, Cummings, Hewitt, Kroeger and Catteneo-Vietti2006, Thrush et al. Reference Thrush, Dayton, Cattaneo-Vietti, Chiantore, Cummings, Andrew, Hawes, Kim, Kvitek and Schwarz2006) and results are mixed (Cummings et al. this issue). Studies that have examined geographical and depth distribution of Ross Sea fishes include those of La Mesa et al. (Reference La Mesa, Cattaneo-Vietti and Vacchi2006) who compared site, depth, and diversity of plunderfishes (Artedidraconidae) using an Agassiz trawl at five sites spanning four degrees latitude from Cape Adare to Cape Russell at depths of 100–500 m. They reported that sampling site was the main factor affecting species composition with both north–south and depth related trends in the distribution of species. Vacchi et al. (Reference Vacchi, La Mesa and Greco2000) described species composition, abundance, depth distribution, and biology for fishes sampled down to 700 m using gill and trammel nets, longlines and traps in the area of Terra Nova Bay. They recorded 26 species with the highest diversity at the shallow end of the depth range.
In this paper we describe fish assemblages in the western Ross Sea (south of 71°S), and also from some of the islands and seamounts just to the north of it (65–68°S). The main aim was to improve our knowledge of fish species diversity and distribution, and to determine if community composition changed with latitude. In addition we examine a range of environmental factors in an attempt to establish key drivers for variation in fish assemblages with location. For these purposes we use data from surveys in 2004 and 2008 which were designed to sample a range of latitudes and depths to provide data on fish diversity, relative abundance, and distribution.
Materials and methods
Survey area
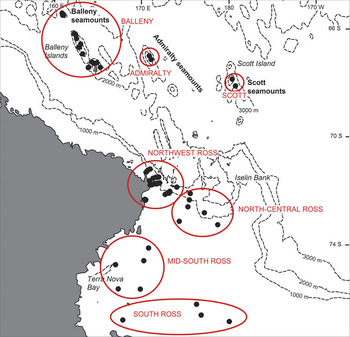
Sampling was carried out on two separate surveys of the biodiversity of the Ross Sea. The first (termed “BioRoss”) survey took place in January–March 2004, and sampling was carried out along a series of five transects at depths of 123–1165 m between Cape Adare and Cape Hallet in the north-west Ross Sea and on four separate locations aound the Balleny Islands (Mitchell & Clark Reference Mitchell and Clark2004). The second (termed “IPY-CAML”) survey was carried out in January–March 2008, and was designed to sample a wide range of habitats and depths from 150 m to 3554 m covering the shelf, slope, abyss, and seamounts in the Ross Sea (Hanchet et al. Reference Hanchet, Mitchell, Bowden, Clark, Hall and O’Driscoll2008). The sampling locations of the bottom trawl stations from both surveys are shown in Fig. 1.
Survey area, showing demersal trawl tow locations (black dots) and the initial area groupings.

Vessel and gear specifications
The RV Tangaroa is a 70 m long, 2000 GRT, stern trawler owned and operated by the National Institute of Water and Atmospheric Research (NIWA). She has only an ice-strengthened hull and so was restricted to areas where ice cover was light.
A number of biological sampling gear types were deployed during both surveys (epibenthic sleds, beam trawls and fish trawls). However, there were clear differences in the catch composition of each gear type and therefore only data from a large demersal fish trawl, which was deployed widely during the surveys, were used in the analyses presented. The NIWA rough bottom (orange roughy) net was deployed to sample demersal species between about 50 and 1990 m. This has a mouth width of 25 m, a headline height of 6 m, a codend of 60 mm mesh fitted with a 40 mm liner to retain smaller fish. The gear was set up in an identical fashion for both surveys, which included reducing the width swept by the trawl to about 80 m by reducing the lengths of the sweeps and bridles. SCANMAR sensors and a netsonde were attached to the doors and net to record doorspread and headline height respectively, and to determine bottom contact time. Standard tows were of 20 min. duration at a speed over the ground of c. 3 knots. Tows where there was gear damage that may have affected the catch were excluded from analysis (n = 7).
Catch sampling and identification
Catch samples were sorted at sea, identified to the lowest possible taxonomic level (OTU, operational taxonomic unit) and weighed on motion-compensating 100 kg Seaway scales to the nearest 0.1 kg. Species were identified following Gon & Heemstra (Reference Gon and Heemstra1990) supplemented by subsequently published taxonomic papers on Southern Ocean fishes (e.g. Schneppenheim et al. Reference Schneppenheim, Kock, Duhamel and Janssen1994, Eastman & Eakin Reference Eastman and Eakin1999). Voucher specimens of each OTU were taken, and registered into the New Zealand National Fish Collection at the Museum of New Zealand Te Papa Tongarewa. Some specimens were examined again onshore to confirm accuracy and consistency of identifications.
Environmental data
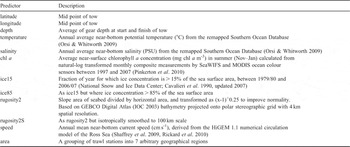
Data were obtained for several environmental factors considered to be biologically relevant (Table I). Temperature and salinity layers were obtained from the Southern Ocean Database (SODB: Orsi & Whitworth Reference Orsi and Whitworth2009). Chlorophyll a (chl a) concentration measurements were obtained from SeaWiFS and MODIS satellite sensors (Pinkerton et al. Reference Pinkerton, Smith, Raymond, Hosie, Sharp, Leathwick and Bradford-Grieve2010). Near-bottom current speed in the study area was obtained from the HiGEM 1.1 numerical circulation model (Shaffrey et al. Reference Shaffrey, Stevens, Stevens, Roberts, Vidale, Demory, Donners, Clayton, Roberts, Wilson, Norton, Johns, Martin, Harle, New, Jrrar, Connolley, King, Woodage, Slingo, Clark, Vidale, Davies, Iwi, Demory, Donners, Cole, Wilson, Slingo and Steenman-Clark2009, Rickard et al. Reference Rickard, Roberts, Williams, Dunn and Smith2010). GEBCO Digital Atlas (2003) bathymetry data were used to generate the rugosity layers. Observations of sea-ice concentration were obtained from the National Snow and Ice Data Center (University of Colorado, USA; Cavalieri et al. Reference Cavalieri, Gloersen and Zwally1990, updated 2007).
Potential environmental factors used in the analyses of species richness and abundance (data compiled for Southern Ocean bioregionalisation workshops 2006, 2007 (Pinkerton et al. Reference Pinkerton, Smith, Raymond, Hosie, Sharp, Leathwick and Bradford-Grieve2010)).

Data analyses
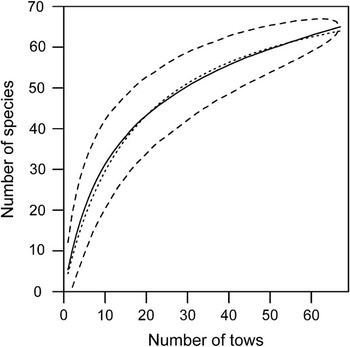
The cumulative species richness was plotted against the cumulative number of tows to assess the adequacy of the survey data for describing species richness. The mean and 95% confidence interval were calculated from 1000 curves based upon different random orders of the tows. The asymptotic richness was estimated from a fitted curve of the form H = aN/(1 + bN), where a and b are constants, N is the number of tows sampled, and the asymptote is given by a/b (Dunn Reference Dunn2009).
An initial subjective grouping of tows by geographical location (Fig. 1) was made to examine whether community composition varied with location. Subsequently a Distance-based Linear Model (DistLM) analysis was used to identify which environmental predictors (Table I) explained most of the variability in species occurrence and abundance (Anderson et al. Reference Anderson, Gorley and Clarke2008). Analyses were performed on species presence/absence or catch rate (kg per nautical mile). Catch rates were standardized, by expressing the catch rate of each species item as a proportion of the total catch rate in each tow. A dissimilarity matrix was then calculated using Bray-Curtis distances. The most significant predictors were selected using the “best” selection method, using the Akaike Information Criterion (AIC) (Anderson et al. Reference Anderson, Gorley and Clarke2008). The results of the DistLM analysis were a marginal test, fitting each predictor individually, and a conditional test, fitting each predictor conditional on the predictor(s) already in the model (Anderson et al. Reference Anderson, Gorley and Clarke2008). Because of the small dataset, the conditional model was restricted to the best model having no more than three predictors.
In order to further investigate the effects of the predictors identified from the DistLM analysis, the continuous predictors were binned. Six bins were used, with bin limits chosen so that the number of observations in each bin was approximately equal. This was considered objective given that there were no a priori known biologically meaningful boundaries for these predictors. The binned data were analysed using non-parametric multidimensional scaling (MDS), followed by SIMPER (similarity percentages), using PRIMER v6 (Clarke & Warwick Reference Clarke and Warwick2006). Similarity levels were indicated on MDS plots following a cluster analysis using the average linkage method (Clarke & Warwick Reference Clarke and Warwick2006). The SIMPER was used to describe, based on the contribution to the overall Bray-Curtis dissimilarity, which species were characteristic within each group.
Results
Species composition
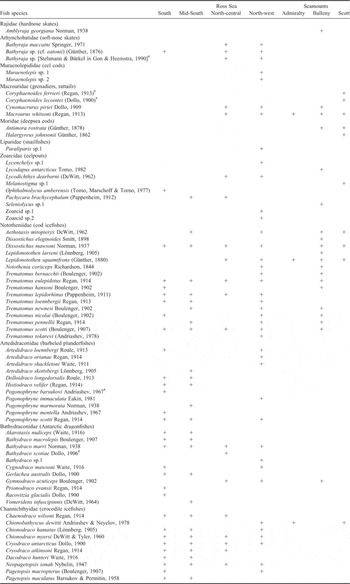
In total from the two surveys there were 70 OTUs of demersal fishes at the species level (with a further 21 pelagic OTUs) (Table II). The catch from the 67 valid trawl tows used in the analyses comprised 65 species. The cumulative species richness curve was not yet asymptotic, indicating the richness was not fully sampled (Fig. 2). The fitted curve estimated the asymptotic richness at 81 species. However, the curve is flattening towards an asymptote, and so sampling can be regarded as adequate for describing the main components of fish communities in the area.
List of demersal elasmobranch and fish species identified from the two surveys in the Ross Sea. Species caught but not used in the analyses are included (†). + indicates occurrence in the area (the seven areas are those shown in Fig. 1). Taxonomic species names are from Gon & Heemstra (Reference Gon and Heemstra1990), Eastman & Eakin (Reference Eastman and Eakin2000) and Eschmeyer & Fricke (Reference Eschmeyer and Fricke2009). Family names are from Nelson (Reference Nelson2006).

Number of tows and the cumulative number of demersal fish species sampled. Dashed lines indicate the 95% CIs. Dotted line is a fitted curve from which asymptotic species richness was estimated.

Assemblage composition
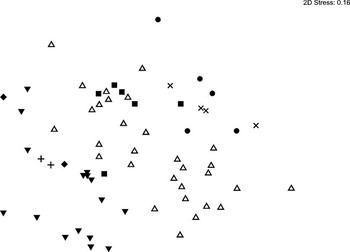
Multivariate analyses showed a clear separation of the Area groupings (Fig. 3). The nMDS plot clustered the three seamount chains (Scott, Balleny, Admiralty) in the bottom left, the north-west Ross and north-central Ross within a broad band through the central section of MDS space, and the mid-south and south Ross in the top right. The pattern was the same for catch rate data, and so the nMDS for abundance is not plotted. Although each of the seven groups did not separate, the clustering into three matches a latitudinal gradient from the southern Ross Sea, through central parts, to the seamounts in the north.
Non-parametric multidimensional scaling ordination plot for demersal fish species presence/absence in trawl catches in the Ross Sea by subarea (▾ = Balleny seamounts, ● = mid-south Ross, ▪ = north-central Ross, ⧫ = Scott seamounts, ▵ = north-west Ross, + = Admiralty seamounts, × = south Ross).

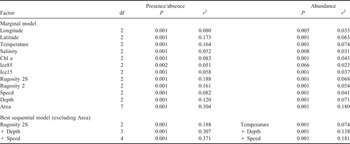
The Area grouping variable was the most influential of the environmental factors analysed. It accounted for the greatest proportion of the deviance in species richness (0.3) and abundance (0.18) (Table III). When the area predictor was excluded, the best conditional model had the predictors rugosity2S (presence/absence) or temperature (abundance), followed by depth and speed (Table III). There were significant correlations in the sample between the predictors rugosity2S, temperature, area and latitude (all permutations had r 2 ≥ 0.72, P ≤ 0.01), with the strongest correlations between rugosity2S and latitude (r 2 = 0.90, P ≤ 0.001), and rugosity2S and temperature (r 2 = 0.86, P ≤ 0.001).
Demersal fish species presence/absence or abundance (kg n.mile-1) in trawl catches in the Ross Sea, results of the DistLM analysis marginal models and the best 3-predictor sequential model chosen using the Akaike Information Criterion after excluding the Area predictor.

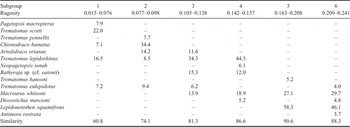
The nMDS analysis indicated rugosity2S subgroups 5 and 6 (0.163–0.241) were similar, and most dissimilar from subgroups 1–4 (0.015–0.157). SIMPER identified the main discriminatory species as Trematomus scotti, Lepidonotothen squamifrons and Trematomus lepidorhinus. The low rugosity areas were characterized predominantly by Trematomus scotti, Trematomus lepidorhinus, and Chionodraco hamatus, and the high rugosity areas predominantly by Macrourus whitsoni and Lepidonotothen squamifrons (Table IV).
SIMPER percentage contribution of species to within rugosity 2S subgroup similarity, using presence/absence. Only the 5 species contributing most to the SIMPER within each subgroup, or contributing at least 90% of the similarity, are shown.

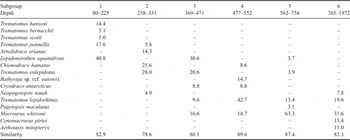
For depth, nMDS indicated subgroups 2–4 (238–552 m) were most similar, with subgroup 6 (765–1972 m) the least similar to other depth groups. SIMPER identified the best discriminatory species as Macrourus whitsoni, Lepidonotothen squamifrons and Trematomus lepidorhinus. Deeper tows (562–1972 m) were characterized predominantly by Macrourus whitsoni and Trematomus lepidorhinus, intermediate tows (238–552 m) by Trematomus lepidorhinus, Trematomus eulepidotus, and Lepidonotothen squamifrons, and shallow tows (80–225 m) by Lepidonotothen squamifrons, Trematomus pennellii and Trematomus hansoni (Table V).
SIMPER percentage contribution of species to within depth (m) subgroup similarity, using presence/absence. Only the five species contributing most to the SIMPER within each subgroup, or contributing at least 90% of the similarity, are shown.

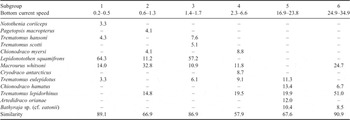
For bottom speed, nMDS indicated subgroups 5 and 6 (16.9–34.9 cm s-1) were most similar, and the slow speed subgroup 1 (0.2–0.5 cm s-1) relatively dissimilar to other groups. SIMPER identified the best discriminatory species as Macrourus whitsoni, Trematomus lepidorhinus and Lepidonotothen squamifrons. Slower current speeds (0.2–1.7 cm s-1) were characterized predominantly by Lepidonotothen squamifrons and Macrourus whitsoni, and faster currents (16.9–34.9 cm s-1) by Trematomus lepidorhinus, Bathyraja sp. (cf. eatonii) and Chionodraco hamatus (Table VI).
SIMPER percentage contribution of species to within bottom current speed (cm s-1) subgroup similarity, using presence/absence. Only the five species contributing most to the SIMPER within each subgroup, or contributing at least 90% of the similarity, are shown.

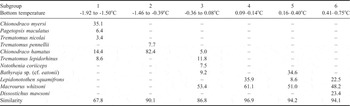
The nMDS of temperature, the main factor determining abundance, indicated subgroups 4 and 5 (0.09–0.40°C) were similar, and least similar to subgroups 1–3 (-1.92–0.08°C) and subgroup 6 (0.41–0.75°C). SIMPER identified the best discriminatory species as Macrourus whitsoni, Chionodraco hamatus, and Lepidonotothen squamifrons (Table VII). Results using species abundance for depth and current speed effects were similar to those for occurrence, and are not shown. The main discriminating species for both factors were Lepidonotothen squamifrons and Macrourus whitsoni.
SIMPER percentage contribution of species to within bottom temperature subgroup similarity, using abundance (kg n.mile-2). Only the five species contributing most to the SIMPER within each subgroup, or contributing at least 90% of the similarity, are shown.

Three species dominated results of the SIMPER analyses:
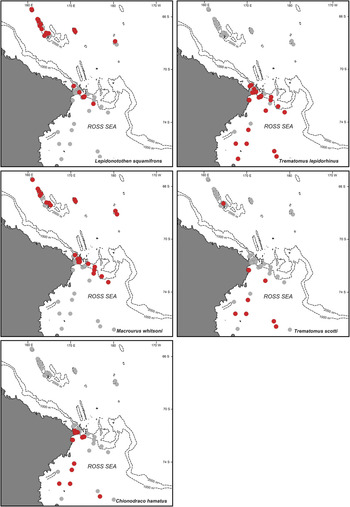
1) Lepidonotothen squamifrons characterized areas of high rugosity, shallow to intermediate depths, slow to moderate bottom current speed, and moderate to high temperatures. The species was distributed in the north-western area of the Ross Sea, and in particular on the seamounts (Fig. 4).
Fig. 4Distribution of the main five discriminatory fish species: Lepidonotothen squamifrons, Trematomus lepidorhinus, Macrourus whitsoni, Trematomus scotti, Chionodraco hamatus. Trawl locations are shown as light grey, with red dots signifying the occurrence of the species.

2) Trematomus lepidorhinus was a distinguishing species in areas of low to moderate rugosity, intermediate to deep depths, moderate to high current speeds, and low temperatures. They were found on the shelf break near 1000 m depth, and scattered throughout the southern Ross Sea (Fig. 4).
3) Macrourus whitsoni discriminated areas of moderate to high rugosity, intermediate to deep depths, slow to high currents, and moderate to high temperature. They were common on the seamounts, and in northern-central sectors of the Ross Sea around 1000 m depth (Fig. 4).

Other important species were Trematomus scotti in low rugosity environments (central and southern Ross Sea), and Chionodraco hamatus in low rugosity, fast current, and low temperature areas along western and southern sectors of the Ross Sea (Fig. 4).
Discussion
The fish species recorded in this study are typical of an East Antarctic assemblage, with high frequency of the nototheniid genus Trematomus, together with artedidraconids, bathydraconids, and channichthyids (Kock Reference Kock1992, Eastman Reference Eastman1993). This was found also by Eastman & Hubold (Reference Eastman and Hubold1999) from the western Ross Sea, and Donnelly et al. (Reference Donnelly, Torres, Sutton and Simoniello2004) from the eastern Ross Sea. However, there are clear changes in the fauna from south to north, both within the Ross Sea, and especially between the Ross Sea and the seamounts. The seamount catches displayed clear sub-Antarctic influence in fish species composition, e.g. the morid cods Halargyreus johnsonii and Antimora rostrata, and the macrourids Macrourus whitsoni and Cynomacrurus piriei are more typical of temperate or sub-Antarctic waters (Gon & Heemstra Reference Gon and Heemstra1990). The beginnings of a transition between Antarctic and sub-Antarctic fauna at the Balleny Islands has been documented for benthic invertebrates as well (e.g. Dawson Reference Dawson1970, Thatje & Lörz Reference Thatje and Lörz2005).
Although this study has shown clearly that fish species composition varies with location within the Ross Sea, the environmental drivers of community composition are not necessarily as obvious or straightforward to interpret. All environmental factors were significant predictors of species composition when tested individually, but many were highly correlated. The decision to focus on the best three combined predictors was a pragmatic one, given the level of sampling effort and uneven distribution of stations throughout the survey area. It also reduces the potential to over-analyse and over-interpret when a large number of predictors are included. The final predictors analysed explained the greatest proportion of the deviance, but this did not necessarily mean these were key drivers of species composition; correlation does not necessarily imply causation, and the difference in deviance explained between alternative predictors was often small (< 2%).
The four key environmental factors identified (rugosity, depth, bottom current speed, and temperature) vary with latitude in the Ross Sea. Depth progressively increases moving north from the southern sector of the Ross Sea, and bathymetry steepens at the shelf break about 700 m in the central–northern sector. The depth increases to over 3000 m going north, except for the seamounts, which have peaks at 500 m or less. Temperature is patchy, but generally increases moving northwards. Rugosity is a measure of seafloor “roughness” at large scales (4 km for rugosity2 and 100 km for rugosity2S) and increases where the seafloor is uneven (e.g. due to the presence of seamounts, canyons) or sloping. Rugosity is higher along the continental slope and Iselin Bank, around Admiralty and Scott seamounts and throughout the deep-sea fracture zone to the north of the Ross Sea sector. Bottom current speed is highly variable throughout the area, with high flow rates in the north-western and north-central sectors, probably along the shelf break, and around the seamounts. Depth and temperature are common environmental factors associated with distribution of fish communities (e.g. Francis et al. Reference Francis, Hurst, McArdle, Bagley and Anderson2002, review by Carney Reference Carney2005), and their influence on fish species composition is readily understood.
The key discriminating species occurred in different combinations of environmental conditions. Lepidonotothen squamifrons characterized areas of high rugosity, shallow to intermediate depths, relatively slow to moderate bottom current speed, and relatively warm environments. This species appears to be primarily benthic as observations made during the IPY-CAML survey using the NIWA Deep Towed Imaging System (DTIS) showed individuals in contact with pebble sea floor and also amongst rock, in crevices and behind encrusting invertebrates presumably sheltering against current flow. Trematomus lepidorhinus favoured areas of low to moderate rugosity, intermediate to high depths, moderate to high current speeds, and low temperatures. DTIS images showed individuals on soft sediment and mixed invertebrate sea floor types suggesting that the species is primarily benthic. Macrourus whitsoni was sampled from regions of moderate to high rugosity, intermediate to deep depths, slow to high currents, and moderate to high temperature. DTIS images revealed the species swimming close to soft sediment and pebble/rock sea floor i.e. typically just above the seafloor. Trematomus scotti was sampled in low rugosity environments and DTIS images showed individuals on soft sediment sea floor types suggesting that the species is primarily benthic. Chionodraco hamatus favoured low rugosity and low temperature areas but was not recorded in DTIS transects. A detailed analysis of assemblage composition relative to substrate type, or macrobenthic biogenic habitat was not possible at this time given the available data, but these factors can be important in species associations.
Environmental parameter values derived from well established compilations of data represent the best available information to characterize the oceanographic conditions of the Ross Sea benthic environment. Nevertheless, the spatial scale of variability in seafloor habitat conditions is often small (metres) relative to that of the environmental data (kilometres). This may introduce some spurious relationships, although it should be adequate for describing broad distributional patterns. Processing and analysis of the seafloor photographic data collected during the 2008 survey with DTIS will, in the future, improve the resolution of some of the environmental correlates with fish species distribution.
The Ross Sea fish fauna appears to be diverse compared with other Antarctic areas, with about 80 species in 12 families having been reported (Eastman & Hubold Reference Eastman and Hubold1999). On-going returns of toothfish fishery by-catch species to the National Fish Collection has significantly increased this number to over 100 species (Museum of New Zealand, unpublished records). The two surveys reported here have also resulted in several new taxa being caught along with range extensions of species from elsewhere in the Southern Ocean. Many Southern Ocean species exhibit large depth ranges, possibly because the continental shelf extends out to 800–900 m in the Ross Sea, in contrast to many non-polar areas where the shelf break is at about 200 m (Kock Reference Kock1992, Angel Reference Angel1997). The species diversity recorded in this study includes almost all the known species, but small and benthic fishes are likely to have been poorly sampled using the large NIWA rough bottom trawl because the large bobbins used in the groundrope may have missed fishes hard down on the sea floor and also because the large mesh used in the front parts of the net may have enabled smaller fishes to escape. This sampling effect was noted during the BioRoss survey when different sampling gear types were deployed at the same sampling site resulting, for instance, in numerous specimens of small artedidraconids being captured in an epibenthic sled but being almost completely absent from the corresponding rough bottom trawl catch. It is therefore very likely that groups such as Rajidae (hardnose skates), Arhynchobatidae (soft-nose skates), Muraenolepididae (eel cods), Liparidae (snailfishes), Zoarcidae (eelpouts), Artedidraconidae (barbeled plunderfishes), and Bathydraconidae (Antarctic dragonfishes) were relatively poorly sampled and that in contrast larger fishes, especially those living just above the sea floor such as Macrouridae (grenadiers, rattails), Moridae (deepsea cods), many of the Nototheniidae (cod icefishes), and Channichthyidae (crocodile icefishes) were better sampled.
A number of fish specimens could not be identified to species. Although we were confident in assigning them unique OTUs, it reflects the fact that the fish fauna of the Ross Sea is still not completely known. The data used for this study therefore includes undescribed species, which are subject to on-going research by specialists in the groups. In addition, analysis of tissues collected from voucher material also revealed cryptic species in groups previously thought to be well understood, e.g. Macrouridae (NIWA, unpublished data). New species of fish are being discovered and new records published from most research surveys and the longline fishery in the Ross Sea (e.g. Eakin & Eastman Reference Eakin and Eastman1998, Eastman & Eakin Reference Eastman and Eakin1999, Chernova & Eastman Reference Chernova and Eastman2001, Smith et al. Reference Smith, Steinke, McVeagh, Stewart, Struthers and Roberts2008). Identification of fishes is a problem for some taxa and therefore diversity and ecological studies are limited to better known species. The groups that are not completely known or diagnosed and may contain new species include: Arhynchobatidae (soft-nose skates), Muraenolepididae (eel cods), Macrouridae (grenadiers, rattails), Liparidae (snailfishes), Zoarcidae (eelpouts) Artedidraconidae especially within Pogonophryne (barbeled plunderfishes), Bathydraconidae (Antarctic dragonfishes). In addition, although the continental shelf and upper slope down to about 800 m of the Ross Sea has been moderately well sampled, the rest of the slope and abyssal depths (to about 3000 m) have been less frequently sampled (Møller & Stewart Reference Møller and Stewart2006).
Acknowledgements
A large number of people have been involved in the planning, preparation, mobilization, and conduct of the two surveys considered here. They are too numerous to name, but in particular the officers and crew of Tangaroa, and the scientific staff during the surveys, are acknowledged. Inigo Everson (formerly British Antarctic Survey) and Chris Jones (US National Oceanographic and Atmospheric Administration (NOAA)) are thanked for their help in fish identification onboard, and Ashley Rowden (NIWA) and Kirsten Kroeger (formerly NIWA) for informative discussions about BioRoss fish and invertebrate distributions. We thank Don Robertson (NIWA) for comments on the manuscript.
This research was funded by the New Zealand Government. In 2004 the Ministry of Fisheries and Land Information New Zealand (Project ZBD200303). In 2006 under the New Zealand International Polar Year-Census of Antarctic Marine Life Project (Phase 2: IPY2007-01). We acknowledge project governance provided by the Ministry of Fisheries Science Team and the Ocean Survey 20/20 CAML Advisory Group (Land Information New Zealand, Ministry of Fisheries, Antarctica New Zealand, Ministry of Foreign Affairs and Trade, and National Institute of Water and Atmosphere Ltd).