


Political conflict is an element of all societies. Because societal groups differ in their preferences and compete over scarce resources, such conflict can turn violent. Democracy is supposed to provide an institutional remedy to political violence, particularly through its central institution of elections. When elections enjoy broad legitimacy, they should reduce the attractiveness of violence; however, when elections are not seen as legitimate, they can become triggers of violence as citizens lose hope in the democratic process or strongly disagree with the results (Staniland Reference Staniland2014). Indeed, in some cases, elections even seem to have intensified the use of political violence (Cederman, Gleditsch, and Hug Reference Cederman, Gleditsch and Hug2013; Donno, Morrison, and Savun Reference Donno, Morrison and Savun2022; Flores and Nooruddin Reference Flores and Nooruddin2012; Goldsmith Reference Goldsmith2015), and violence may peak around the time of elections (Bhasin and Gandhi Reference Bhasin and Gandhi2013; Harish and Little Reference Harish and Little2017).
We define political violence as the use (or threat) of force targeted at individuals and objects to generate or resist political change (Bosi and Malthaner Reference Bosi, Malthaner, Porta and Diani2015). Although much political violence is orchestrated by political elites, such elites often rely on a certain level of popular acceptance of violence (Kleinfeld and Sedaca Reference Kleinfeld and Sedaca2024). Research on Africa has shown that areas where more people find political violence legitimate are more likely to experience future conflict events (Linke, Schutte, and Buhaug Reference Linke, Schutte and Buhaug2015).
In this article, we study the change in support for political violence around elections, with a focus on the role of electoral turnovers in unconsolidated democracies. Elections may raise hopes for the politically marginalized that they will see a transfer of power between different parties. Yet in many unconsolidated democracies, elections often end up reaffirming rather than challenging group hierarchies. Incumbent parties usually enjoy significant advantages and often are reelected (Dulani and Chunga Reference Dulani, Chunga, Patel and Wahman2015). Suffering repeated losses in democratically questionable elections may exacerbate group grievances and trigger violence as both a rational and emotional response to perceived injustice (Kapesa, Sichone, and Bwalya Reference Kapesa, Sichone, Bwalya, Tinenenji Banda, Hinfelaar and Ndulo2020).
In principle, electoral turnovers may enhance democratic legitimacy and reduce the support for violence among losing partisans (Bratton Reference Bratton2004; Cheeseman, Lynch, and Willis Reference Cheeseman, Lynch and Willis2020; Hernández-Huerta and Cantú Reference Hernández-Huerta and Cantú2022; Moehler and Lindberg Reference Moehler and Lindberg2009). However, the critical question is whether turnovers reduce acceptance of violence across the board, among winning and losing partisans alike or whether those effects are restricted to those winning power. Much of our existing knowledge on violent partisanship is from older democracies such as the United States (see, e.g., Kalmoe and Mason Reference Kalmoe and Mason2022; Kuk, Lajevardi, and Osborne-Garth Reference Kuk, Lajevardi and Osborne-Garth2025; Piazza Reference Piazza2024a, Reference Piazza2024b); it is unclear how such findings generalize to newer democracies.
For unconsolidated democracies, we expect that turnover increases trust in elections and reduces acceptance of violence for winning partisans, but that losing partisans increase their acceptance of violence (as in non-turnover elections). This is because losers are partially instrumentally motivated: even if they concede that the election process has improved, the election outcome (loss of government power and the prospect of adverse political consequences) can still make the use of violence to challenge an election outcome more acceptable to them. We also expect that citizens with increased perceptions of election quality reduce their acceptance of violence.
To assess these theoretical intuitions empirically, we focus on Zambia’s 2021 election. In the run-up to the election, Zambia was an unconsolidated democracy with recent experience of democratic backsliding (Hinfelaar, Rakner, and van de Walle Reference Hinfelaar, Rakner, van de Walle, Arriola, Rakner and van de Walle2023). The 2021 election, however, has often been described as a democratic breakthrough (Beardsworth, Siachiwena, and Sishuwa Reference Beardsworth, Siachiwena and Sishuwa2022). Although the election did feature forms of pre-electoral manipulation, voting and counting were generally lauded as credible (EU 2021), and the election resulted in a decisive victory for the opposition party. The election gave citizens a reason to update their political attitudes and made previous losers into winners (Kerr, Krönke, and Wahman Reference Kerr, Krönke and Wahman2024).
To study change in popular attitudes about political violence, we use an original citizen panel fielded around the 2021 Zambian election (von Borzyskowski and Wahman Reference Borzyskowski and Wahman2026). The panel includes almost 1,300 participants and allows us to track citizens’ attitudes to political violence during the election period in two crucial Zambian regions (Lusaka and Eastern Province). Panel surveys in Africa are extremely rare, and have, to the best of our knowledge, not been deployed to study changes in attitudes on political violence around elections.
Our analysis yields three important findings. First, we show that a majority (54%) of survey respondents changed their support for political violence in the four months between the pre- and post-election survey. Interestingly, that group was almost evenly split between those who increased and those who decreased their acceptance of violence.
Second, analyzing the panel data using OLS regression and controlling for possible confounders, we find that election winners (former opposition supporters) significantly and substantially reduced their support for violence when we compare pre- and post-election attitudes. However, on the contrary, election losers (supporters of the former governing party) significantly increased their support of political violence. These findings suggest that turnovers in unconsolidated democracies such as Zambia are not certain to reduce support for political violence even though general election trust increased for both government and opposition supporters.
Third, we show that citizens who gained increased trust in election quality reduced their stated support of political violence. There are also important interactions between loser/winner status and perceptions of election quality. Election winners who gained increased trust in election quality are especially likely to reduce their acceptance of violence.
As an extension case, we also analyze another original panel dataset from the Kenyan 2017 election. Kenya is another unconsolidated African democracy, but the 2017 election was of low quality and featured no turnover. Interestingly, we still find similar patterns. In particular, winner/loser dynamics in support for political violence are remarkably similar in the two countries, even though one country (Zambia) featured an election with government turnover and increased election trust among all partisans whereas the other (Kenya) did not. In all, these findings suggest that turnovers in unconsolidated democracies such as Zambia are not sure to reduce acceptance of violence. Instead, even in such environments, familiar partisan loser and winner effects set in as voters update their support for violence depending on their satisfaction with the electoral outcome and process. The differences in results between Zambia (our main case) and Kenya (the extension case) are surprisingly small.
This article makes several contributions. First, it warns against placing too much trust in electoral turnovers to consolidate democracy (Bratton Reference Bratton2004; Cheeseman, Lynch, and Willis Reference Cheeseman, Lynch and Willis2020; Hernández-Huerta and Cantú Reference Hernández-Huerta and Cantú2022; Moehler and Lindberg Reference Moehler and Lindberg2009). Although turnovers are a natural and important part of a functioning and competitive democracy, societies with entrenched and polarized group dynamics may still be unable to settle political scores despite turnovers (Wahman Reference Wahman2014). Second, it adds to the burgeoning literature on trust in elections (Kerr, King, and Wahman Reference Kerr, King and Wahman2024) by offering rare panel studies in Africa and thus enabling insights into over-time changes in attitudes. Third, it shows with individual-level data that credible elections are critical for the functioning of democracy and the reduction of political violence, thus supporting the mechanisms of cross-national studies (Birch and Muchlinski Reference Birch and Muchlinski2017; von Borzyskowski Reference Borzyskowski2019a). All these contributions are enabled by unique data. The article thus shows the promise of panel data from unconsolidated democracies to further our understanding of political violence, democratic consolidation, and institutional trust.
Elections and the Acceptance of Violence in Unconsolidated Democracies
Elections can improve government legitimacy. Ideally, they allow multiple societal groups to compete for power and enable peaceful transitions. Nevertheless, in the real world, elections often fail in these foundational tasks. This is particularly true in unconsolidated democracies, the form of regimes we focus on in this article. Unconsolidated democracies are defined by weak democratic institutions and norms, raising questions about whether democracy is the “only game in town” (Schedler Reference Schedler, Croissant and Heynes2014). Citizens in unconsolidated democracies cannot be sure about the extent to which democratic rules will be followed or governments will manipulate elections. This situation creates a significant level of uncertainty.
We use the term “unconsolidated democracies” to emphasize the role of institutional ambiguity. Many regimes in this category could also be described as “competitive authoritarian” or “hybrid regimes” (Schedler Reference Schedler2013). However, we are less focused on regimes where electoral quality is predictably low and citizens have little reason to put hope in elections as a possible mechanism for redistributing power (i.e., consolidated autocracies). Instead, we focus on regimes where electoral quality varies over time, and elections may bring about political change. Importantly, researching support for political violence in unconsolidated democracies is increasingly relevant because democracy is currently under threat in many countries that were previously considered consolidated democracies. In such cases, citizens are increasingly uncertain about the fairness of elections or their government’s commitment to democracy.
In their seminal work on “contentious elections,” Norris, Frank, and Martínez i Coma (Reference Norris, Frank and Coma2015) describe how elections become the focal point in ongoing competition between groups of citizens and elites. It is commonplace for electoral losers to denounce the results and encourage the violent mobilization of their supporters (Anderson et al. Reference Anderson, Blais, Bowler, Donovan and Listhaug2005; Lindberg Reference Lindberg2006, 43–44; Nadeau and Blais Reference Nadeau and Blais1993, 553). Under institutional uncertainty, opposition actors may withhold judgment and strive to maximize their winning chances during election campaigns; yet when elections feature fundamental flaws, violence may be seen as the best possible strategy (Siachiwena Reference Siachiwena2022; Sishuwa Reference Sishuwa2021a).
Indeed, in recent memory, many democracies have experienced their most violent episodes in and around elections. For instance, large-scale violence erupted after the 2007 election in Kenya, when incumbent president Mwai Kibaki was declared the winner of a controversial presidential election. The violence left more than 1,000 Kenyans dead and close to 700,000 displaced (Lynch Reference Lynch2009). Similarly, Côte d’Ivoire plunged into deep civil conflict after a divisive election in 2010 (Banegas Reference Banegas2011). Elections may also prompt more localized forms of violence when groups with existing grievances perceive election results as another sign of humiliation and domination (Kapesa, Sichone, and Bwalya Reference Kapesa, Sichone, Bwalya, Tinenenji Banda, Hinfelaar and Ndulo2020). Such grievances can be mobilized by political actors (Klaus Reference Klaus2020; Lynch Reference Lynch2011). Group grievances in Kenya and Côte d’Ivoire were based on long-standing distributional conflicts and did not originate at their elections. However, elections served as an accelerator of violence, undermining the hope that they could fairly resolve deep-rooted conflict (Klaus and Mitchell Reference Klaus and Mitchell2015). Much of the political violence occurring during election periods would be categorized as “election violence” in that it aims to affect the electoral process, but some violence may fall outside this category and relate to violence intended to affect politics and political competition outside the electoral mechanism (Siddiqui Reference Siddiqui2022; Staniland Reference Staniland2014).
Elections in unconsolidated democracies can quickly change public perceptions of institutional fairness and quality. They often feature high levels of incumbent advantage, electoral institutions that are lacking in diffuse legitimacy, and electoral quality that varies significantly over time (Schedler Reference Schedler2013). Nevertheless, elections also may represent moments of hope where those shut out of power see possible openings to advance their influence. Elections that are free and fair award voters a sense of political efficacy, even for losers who may temporarily be excluded from power and influence. However, when elections fail to deliver on the hopes and aspirations of citizens, violence may become either an instrumental last resort for political influence or a response to grievances. As noted by Kapesa, Sichone, and Bwalya (Reference Kapesa, Sichone, Bwalya, Tinenenji Banda, Hinfelaar and Ndulo2020), political violence often arises from real or perceived group inequalities. When citizens feel powerless and perpetually marginalized, they may use violence as a tool to seek recognition or resolution of grievances.
In this article, we focus on two individual-level characteristics likely to affect changes in the acceptance of political violence around elections: partisanship and electoral trust. Specifically, we aim to probe the effect of these characteristics under the condition of electoral turnover. Elections hold the promise of addressing grievances in unconsolidated democracies, but they often fail to do so. In Africa and in many other regional contexts dominated by unconsolidated democracies, turnovers are relatively rare (Dulani and Chunga Reference Dulani, Chunga, Patel and Wahman2015).Footnote 1 When elections reproduce group hierarchies and political exclusion, they may undermine democratic legitimacy. However, several scholars have argued that turnovers have the potential to enhance democratic legitimacy and advance democratic consolidation (Bratton Reference Bratton2004; Moehler and Lindberg Reference Moehler and Lindberg2009). According to Cheeseman, Lynch, and Willis (Reference Cheeseman, Lynch and Willis2020), transfers of power promote civil ideals by making democracy more inclusive. Kerr, Krönke, and Wahman (Reference Kerr, Krönke and Wahman2024) showed that turnovers may enhance trust in elections for winners and losers alike. In other words, turnovers test the limits of the extent to which losing may inspire greater support for violence in unconsolidated democracies.
It is important to acknowledge that partisanship and electoral trust may not be mutually independent from each other. Indeed, one of the most consistent findings in research on electoral trust is that trust in elections is highly affected by partisanship. Motivated reasoning theory suggests that individuals are more susceptible to electoral information confirming their preexisting partisan biases. Moreover, they are more likely to seek out and trust information reaffirming their political beliefs (Robertson Reference Robertson2017). Across widely different contexts, research has shown that electoral winners tend to trust elections more than election losers (Cantú and García-Ponce Reference Cantú and García-Ponce2015; Esaiasson Reference Esaiasson2011; Flesken and Hartl Reference Flesken and Hartl2018; Fortin-Rittberger, Harfst, and Dingler Reference Fortin-Rittberger, Harfst and Dingler2017; Kerr Reference Kerr2024; Mauk Reference Mauk2022).
There are reasons to believe that partisanship—that is, winner/loser status—affects the acceptance of violence. A large literature on both democratic consolidation and political conflict has highlighted the difficulty of democratic governance in polarized political environments. Democracy requires elites and citizens who value democratic principles over short-term outcomes (Diamond Reference Diamond1999; Horowitz Reference Horowitz1985). When the stakes of political competition become too high, political actors may decide to throw democratic principles to the wind because of the threat of highly undesirable outcomes. An emerging literature on electoral manipulation shows that citizens are more accepting of electoral manipulation or other democratic breaches when it is perpetrated by their own party or favors their interests (Aarslew Reference Aarslew2022; Graham and Svolik Reference Graham and Svolik2020). In the US context, Kalmoe and Mason (Reference Kalmoe and Mason2022,45) show that the share of Americans accepting violence grew from 8% to 15% when respondents were asked to imagine a future election where their favored party lost. Moreover, after Joe Biden’s victory in the 2020 election, losing Republicans increased their support for violence, whereas winning Democrats reduced their acceptance of the same (66).
Much of the literature on electoral violence describes how politicians and other political elites stoke fear among partisan supporters in an attempt to increase their willingness to fight and accept violence as a political strategy (Lebas Reference Lebas2003). For instance, ethnic hate speech was a frequent occurrence in the extraordinarily violent 2007 Kenyan election. It was commonly understood that the willingness of citizens to engage in violent acts (or at least look the other way or accept them as a part of political life) was, to a large extent, motivated by their fear of adverse political consequences should the opposing party prevail. Political entrepreneurs in Kenya frequently evoked the sensitive issue of land rights to create the sense that the livelihoods of voters were contingent on the electoral outcome (Boone Reference Boone2011; Kanyinga Reference Kanyinga2009; Klaus Reference Klaus2020). It is possible that turnovers dampen partisan reactions to election outcomes because they show the potential for transitions in power (Kapesa, Sichone, and Bwalya Reference Kapesa, Sichone, Bwalya, Tinenenji Banda, Hinfelaar and Ndulo2020). Nevertheless, turnovers represent a threat to group dominance. Early celebratory expressions of previously excluded groups (recent winners) can easily provoke a backlash among recent electoral losers.
Despite turnovers, we thus hypothesize familiar effects of partisanship:
H1: Comparing attitudes before and after elections, support for political violence will decrease among election winners.
H2: Comparing attitudes before and after elections, support for political violence will increase among election losers.
Turnovers give citizens the opportunity to upgrade their trust in elections, regardless of partisanship (Kerr, Krönke, and Wahman Reference Kerr, Krönke and Wahman2024). In unconsolidated democracies, elections are a contest not only between outcomes but also procedures (Schedler Reference Schedler2002). Levels of manipulation and election quality tend to vary significantly over time, and citizens pay close attention to the conduct of elections to evaluate the state of democracy (Sishuwa Reference Sishuwa2021b; von Borzyskowski, Daxecker, and Kuhn Reference Borzyskowski, Daxecker and Kuhn2022). In low-information environments, turnovers are often seen as indicators of high-quality elections.
Although commitment to democracy is often instrumentally motivated, violence remains an unattractive alternative to a majority of citizens in consolidated and unconsolidated democracies alike (Graham and Svolik Reference Graham and Svolik2020). Citizens are more likely to accept electoral defeat if they see viable pathways back to power through the ballot box. If elections are perceived as free and fair, citizens often prefer nonviolent electoral politics over violent resistance. In other words, trust in elections may mitigate partisan disappointment with electoral loss and reduce the attractiveness of violence (Mauk Reference Mauk2022). In contrast, when elections are not regarded as democratically legitimate, political violence may not be seen as a break with democratic norms but as a tool to forge or defend a true democratic order (Daxecker Reference Daxecker2012; Hyde and Marinov Reference Hyde and Marinov2014; von Borzyskowski Reference Borzyskowski2019b). In that context, violence may also be perceived as an appropriate response and an attempt to address injustice (Kapesa, Sichone, and Bwalya Reference Kapesa, Sichone, Bwalya, Tinenenji Banda, Hinfelaar and Ndulo2020).
There is no one-to-one relationship between objective measures and popular perceptions of electoral integrity. Electoral processes remain complex, statements about the conduct of elections by political actors are often biased, and political entrepreneurs actively try to manipulate perceptions of electoral integrity to advance their own political motives (Vliegenthart et al. Reference Vliegenthart, Van Ham, Kruikemeir and Jacobs2024). Indeed, in Nigeria, Daxecker, Di Salvatore, and Ruggeri (Reference Daxecker, Di Salvatore and Ruggeri2019) found that post-election protest was more correlated with perceptions of electoral fairness than actual levels of electoral integrity. Nevertheless, trust in elections is not a mere reflection of partisan-motivated reasoning, especially in connection to electoral turnovers (Kerr, Krönke, and Wahman Reference Kerr, Krönke and Wahman2024). High administrative capacity and efforts to enhance integrity and transparency can increase electoral trust across partisan divides (von Borzyskowski Reference Borzyskowski2019a: 128–35, Jaffe et al. Reference Jaffe, Loffredo, Baltz, Flores and Stewart2024; Kerr Reference Kerr2024). When elections are seen as higher quality, violence may seem less appropriate as a political tool regardless of partisanship. We therefore hypothesize the effect of increased trust in electionsFootnote 2:
H3: Comparing attitudes before and after elections, respondents with increased trust in elections will reduce their support for political violence.
Finally, we also expect important interactions between partisanship and trust in elections. Such interactions have been observed on related attitudes. We anticipate that the combination of losing and having lower trust in elections is particularly detrimental. In these cases, citizens would have stronger instrumental reasons to challenge the status quo; they may also believe they have a moral justification for doing so; hence, we formulate H4:
H4: Comparing attitudes before and after elections, respondents who support election losers will increase their support for violence more if they lack increased trust in elections.
Nevertheless, we would assume that election winners and losers are not equally accepting of violence, even if they share a positive view of the quality of elections. Losers are likely to be partly instrumentally motivated to support violence and would be more open to doing so, even though they may have no fundamental disagreements with the electoral process. We thus formulate H5:
H5: Comparing attitudes before and after elections, respondents who have increased trust in elections will reduce their support for political violence more if they support the winning party.
Study Context
In this article, we study the role of elections in changing public acceptance of political violence in Zambia as our primary case. We also study Kenya as an extension case. Zambia’s most recent transition to democracy occurred in 1991 during the early stages of Africa’s “second liberation” that broadly reintroduced multiparty competition to the African continent (Bratton and van de Walle Reference Bratton and van de Walle1997). Zambia could, on the one hand, be described as a democratic success story. The country has avoided plunging into serious political conflict, and elections have on three occasions (1991, 2011, and 2021) successfully removed unpopular incumbents from power (Sishuwa Reference Sishuwa2022). On the other hand, Zambia has also struggled to consolidate its democracy. The country has gone through several episodes of democratic backsliding, characterized by executive power grabs, electoral manipulation, and politically organized violence (Beardsworth, Siachiwena, and Sishuwa Reference Beardsworth, Siachiwena and Sishuwa2022; Hinfelaar, Rakner, and van de Walle Reference Hinfelaar, Rakner, van de Walle, Arriola, Rakner and van de Walle2023; VonDoepp Reference VonDoepp2005).
A key feature of Zambia’s democracy, which is characteristic of several similar unconsolidated democracies in Africa, is high levels of institutional uncertainty. Election quality is not constant over time, and citizens do not have deeply entrenched views on institutional performance (Siachiwena and Saunders Reference Siachiwena and Saunders2021). This characteristic sets many African democracies apart from more consolidated democracies with more diffuse and largely time-invariant support for central political institutions (Gibson, Caldeira, and Spence Reference Gibson, Caldeira and Spence2003). As a result, citizens are more likely to reevaluate their trust in institutions and perceptions of democracy in response to events such as an election (Moehler and Lindberg Reference Moehler and Lindberg2009).
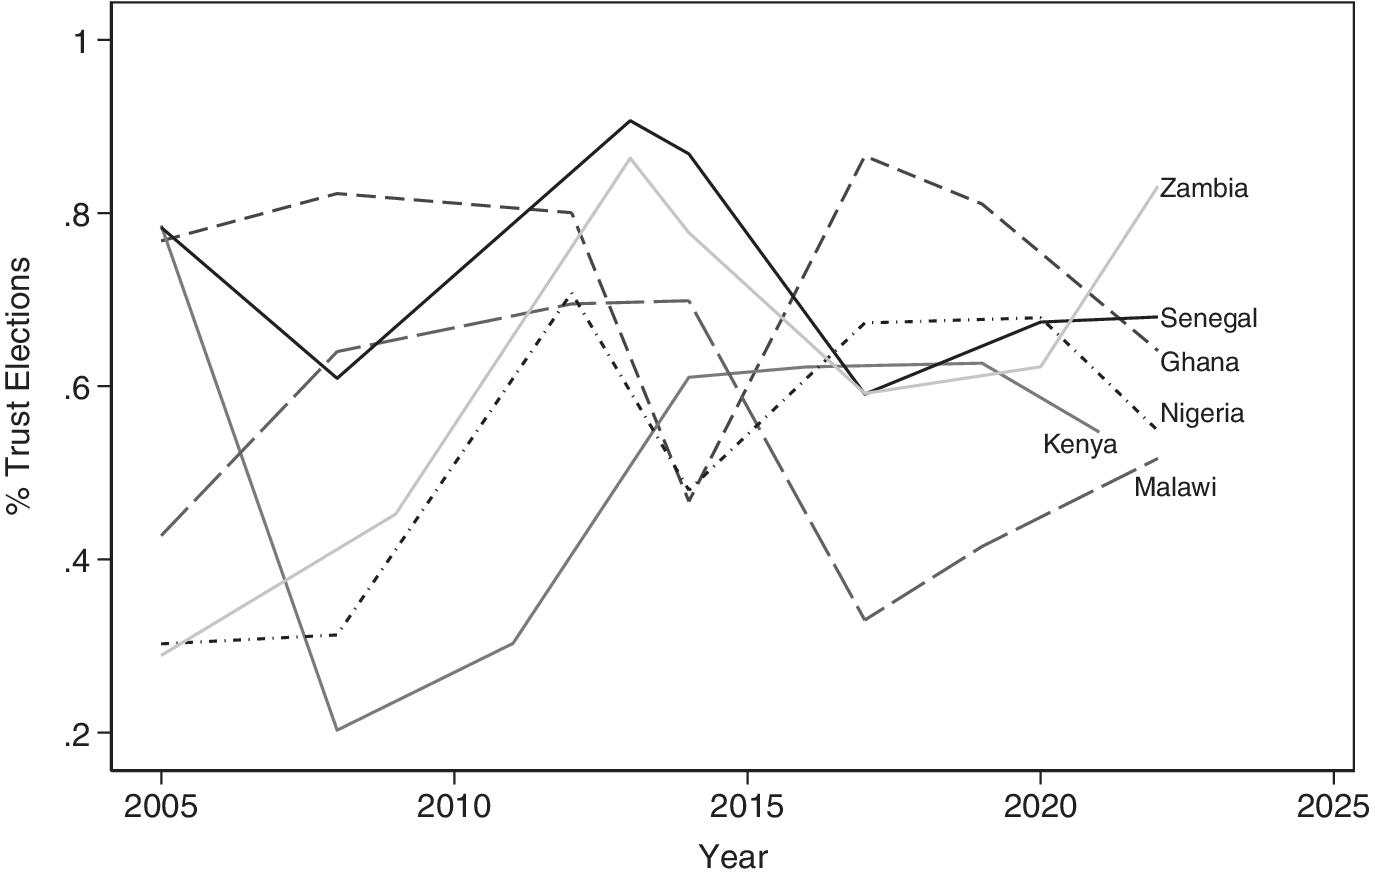
Figure 1 shows how the level of trust in elections has changed over time in Zambia and five other African countries, according to Afrobarometer data.Footnote 3 All these countries—Ghana, Kenya, Malawi, Nigeria, Senegal, and Zambia—are competitive systems with a recent history of electoral controversy and experience of electoral turnover. The figure shows great fluctuation over time in all countries, including Zambia. Interestingly, many of the highpoints in electoral trust follow shortly after elections resulting in government turnovers, such as elections in Ghana in 2008 and 2016, Kenya in 2002, Malawi in 2014, Nigeria in 2015, and Senegal in 2012. These simple descriptives show that African citizens in competitive but unconsolidated democracies may change their assessment of election quality drastically. If electoral distrust is related to attitudes on violence, this means that elections may have the propensity to radically shift political attitudes on political violence.
Level of Electoral Trust in Six Competitive Unconsolidated Democracies over Time (2005–2022), Afrobarometer data

Figure 1. Long description
The X axis represents the Year from 2005 to 2025 in five year increments. The Y axis represents the percentage of Trust Elections from 0.2 to 1.0. Six distinct lines represent different countries.
* Zambia (light gray solid line) starts at 0.3 in 2005, peaks near 0.85 in 2013, drops to 0.6 in 2017, and ends at its highest point of approximately 0.82 in 2022.
* Senegal (black solid line) starts high at 0.78, dips to 0.6 in 2008, peaks at 0.9 in 2013, and stabilizes around 0.68 by 2022.
* Ghana (black dashed line) starts at 0.78, maintains a high plateau between 0.8 and 0.85 until 2014, peaks again in 2017, and ends at 0.65.
* Nigeria (black dash-dot line) starts at 0.3, remains low until 2008, rises to 0.7 in 2012, and ends with a downward trend at 0.55 in 2022.
* Kenya (dark gray solid line) starts at 0.42, drops sharply to 0.2 in 2008, rises steadily to 0.62 in 2014, and ends at 0.55 in 2021.
* Malawi (dark gray long-dashed line) starts at 0.3, rises to 0.7 in 2014, drops sharply to 0.35 in 2017, and ends at 0.52 in 2022.
The 2021 Zambian election was held in a climate of declining democracy (Hinfelaar, Rakner, and van de Walle Reference Hinfelaar, Rakner, van de Walle, Arriola, Rakner and van de Walle2023). The incumbent party, Patriotic Front (PF), had been in power since 2011, when it unseated the previously hegemonic ruling party, the Movement for Multiparty Democracy (MMD; Resnick Reference Resnick2014). Although the PF advocated democratic reform in opposition, little of the promised reform actually came to pass once in power. Instead, after the death of PF’s original leader Michael Sata and the passing of the baton to his successor Edgar Lungu, Zambia entered a period of significant democratic regression (Hinfelaar, Kaaba, and Wahman Reference Hinfelaar, Kaaba and Wahman2021). During this time, the electoral commission and judiciary became politicized, and PF systematically organized low-scale violence to control the electoral arena (Wahman Reference Wahman2023).
Edgar Lungu and the PF narrowly won reelection in 2016, but the opposition United Party for National Development (UPND) never acknowledged defeat. While the opposition was challenging its loss in court, the newly established Constitutional Court, consisting of government-appointed judges, dismissed the opposition petition based on a technicality (Goldring and Wahman Reference Goldring and Wahman2016). After the 2016 election, post-election violence ensued, particularly in the opposition’s major stronghold in Southern Province. The violence was a consequence of both popular frustration and the reelected government’s desire to crack down on opposition forces. Violent riots resulted in numerous arrests in Southern Province, mainly related to property damage. Although some of these arrests were warranted, the opposition also expressed concerns over politically motivated arrests (Goldring and Wahman Reference Goldring and Wahman2016; Republic of Zambia 2019).
Tension between the government and the opposition party grew after the 2016 election, not least after the opposition’s presidential candidate, Hakainde Hichilema, was arrested on trumped-up treason charges in 2017. Following international intervention, Hichilema was released after spending 100 days in jail (Sishuwa Reference Sishuwa2022). However, the political environment remained highly polarized before the 2021 election.
Leading up to the 2021 election, the Electoral Commission of Zambia (ECZ) faced intense criticism, and its independence was questioned. The opposition regarded the voter registration process as biased: it saw resulting increases in the number of registered voters in government party strongholds as strong evidence of rigging. Moreover, with the election being organized during the COVID-19 pandemic, the ECZ had put in place significant campaign restrictions (Beardsworth, Siachiwena, and Sishuwa Reference Beardsworth, Siachiwena and Sishuwa2022). However, enforcement of these restrictions was inconsistent, with opposition campaigning much more heavily policed than governing party campaigning (Resnick Reference Resnick2022).
Violence was an important part of the 2021 electoral environment. Although it rarely turned fatal, government party cadres, known for instilling fear in opposition party voters and policing the campaign, formed a heavy presence in urban areas and government party strongholds (Beardsworth et al. Reference Beardsworth, Fraser, Resnick and Siame2021). The government decided to deploy the military in Lusaka in the week before the election. Although deployment of the military was motivated by a desire to maintain peace and stability, it was widely perceived as a way to create fear among opposition supporters (Wahman Reference Wahman2024).
Despite its disadvantages, the opposition won the election with an overwhelming majority. Hichilema, the opposition candidate, won the highest vote total of any presidential candidate in Zambia’s history (Resnick Reference Resnick2022; Siachiwena Reference Siachiwena2022). Hern (Reference Hern2023) has explained PF’s defeat as a voter reaction to both a struggling economy and a contracting democracy. Although the defeated President Lungu initially decried the election results, alleging fraud, he later accepted defeat and decided not to challenge the results in court. Unlike in 2016, no major episodes of violence erupted after the election.
The turnover in Zambia provides a useful context for studying how elections may change citizens’ acceptance of political violence. Even though the government party had initially voiced some concerns about election quality, it eventually acknowledged defeat, and the election has generally been heralded as a democratic breakthrough (Siachiwena Reference Siachiwena2022). Moreover, Zambia exhibits the form of institutional uncertainty that we are interested in exploring. The preceding period of democratic backsliding increased voters’ uncertainty about elections as an effective vehicle for political change, despite a widely unpopular incumbent. Election turnovers are not out of the ordinary in Zambia; indeed, they have occurred twice since the introduction to multipartyism in 1991. Nevertheless, before the election, voters and analysts were still unsure whether the autocratizing government would allow the opposition to win. In a widely read article published before the contest, public intellectual Sishuwa Sishuwa (Reference Sishuwa2021b) concluded, “In a fair election, Lungu cannot win; in an unfair election, he cannot lose.”
Although we maintain that this turnover provides important inferential benefits, it is useful to compare the results from Zambia with a more typical case where governments are reelected. In addition, although political violence has been present in Zambia, the country has never experienced large-scale fatal violence (Brosche, Fjelde, and Höglund Reference Brosché, Fjelde and Höglund2020). Such violence may make citizens particularly adverse to the use of violence as a political tool. To probe the generalizability of our theory, we introduce an empirical extension that uses data from another original panel survey conducted during the 2017 Kenyan election. Although this panel survey is not directly comparable to the Zambian panel (as explained later), Kenya serves as an important extension to Zambia.
Popular Understanding of Political Violence in Zambia and Kenya
In public opinion research, we routinely apply standard political concepts across widely different social contexts. When comparing survey results across countries, it is possible that political concepts are perceived differently by survey respondents depending on a country’s social, political, and economic characteristics and history (Heath, Fisher, and Smith Reference Heath, Fisher and Smith2005). Although such differences can complicate comparisons, case-study public opinion research is improved by providing a local understanding of global political concepts. This contextualized understanding helps us better interpret survey results and realize potential scope conditions of empirical findings.
In this case, it is important to understand public perceptions of political violence in Zambia: we cannot assume a one-to-one relationship between violent conditions on the ground and public perceptions of the same. Violence is politicized, and central political actors produce narratives and interpretations of violence to advance their own political goals. Indeed, Wahman (Reference Wahman2023) finds no relationship between the level of election violence and the fear thereof.
To better understand local perceptions of political violence in Zambia, we organized five focus groups in Lusaka and Eastern Province (the two main sites of our survey research) in late 2025.Footnote 4 The focus groups were framed around electoral participation and included several questions about participants’ understanding of violence, its justification, and effects. The appendix contains more information about our focus groups.
Participants in our focus groups describe patterns of political violence largely in accordance with academic accounts of Zambian politics (Mukuntu Reference Mukuntu2019; Wahman Reference Wahman2024). Violence is described as low-scale and localized. Intimidation, property damage, and beatings are central to participants’ understandings, whereas high-scale forms like killings, displacements, ethnic cleansings, or sexual violence are not. Parties are perceived as playing an important role in planning and organizing violence, yet focus group participants still emphasize how they feed on the frustrations of ordinary citizens. Violence after elections is not generally seen as a coordinated attempt to overthrow the government or overturn elections but as (a sometimes justified) reaction to perceived injustice.
Generally, focus group participants denounce violence as an illegitimate tool of asserting political influence. Some even highlight that institutional channels exist to ensure electoral justice. However, as in our survey results, a minority of participants justify the use of violence as an understandable consequence when people feel aggrieved or helpless. For instance, one female participant in Lusaka notes that “it is fit to fight when elections are rigged because it pains. You cannot be stolen from and remain calm.”
This contextual understanding is important. Our focus groups suggest that Zambians are not mainly thinking about high-scale forms of political violence when prompted. Survey results should be interpreted in this light; most respondents who show acceptance of violence are not justifying large-scale atrocities or violent revolution. However, even low-scale forms of political violence are consequential for the quality of democracy, human security, and political participation.
We did not organize similar focus groups in Kenya, our extension case. However, we have data from interviews with key informants conducted at the same time as the 2017 baseline and endline panel survey, which shed light on how locals understood the concept of political violence around the election. Key informants included local election observers, representatives of the major parties, staff from the election commission (IEBC), and the police in the relevant counties where the panel survey was fielded. Overall, we have data from 40 interviews.Footnote 5
Given the different context, interviewees describe “violence” as including physical force (e.g., to prevent people from voting) and property damage (e.g., burning police vehicles). They point to politicians, supporters, and the police as those involved in violence and tensions. When asked later about any specific violent incidents, key informants note fatal incidents—for example, people were shot by police during demonstrations in Kisumu—and that inter-party violence resulted in deadly beatings in Uasin Gishu. Short of violence, interviewees classify as “tense” activities that include hate speech, polarization of the population, threats of force by the police and politicians, altercations between protesters and police, clashes between competing camps, and attacks on property without clear evidence of damage.
These interview data from Kenya are in line with qualitative scholarship on political violence in Kenya in 2017 (Mutahi and Ruteere Reference Mutahi and Ruteere2019) and suggest that popular understandings of political violence differ somewhat from those held by Zambians. Because physical and fatal forms of violence are more common in Kenya than in Zambia, citizens are likely to think more of higher-scale forms of political violence when prompted. Such differences in public understandings of political violence (and thus questions about whether similar patterns also manifest there) provide one further reason for extending our findings from Zambia to the Kenyan case.
Research Design
Data limitations have been a great impediment to studying changes in key attitudes related to elections or violence in Africa and other regions dominated by less consolidated democracies. Although researchers have used panel data to capture the dynamic change in acceptance of violence in and around elections in countries such as the United States (Kalmoe and Mason Reference Kalmoe and Mason2022; Mernyck et al. Reference Mernyck, Pink, Druckman and Willer2022), such data have not been deployed in the context of low-income countries. Instead, researchers have mostly used single-wave surveys (Dyrstad and Hyllesund Reference Dyrstad and Hillesund2020; Linke, Schutte, and Buhaug. Reference Linke, Schutte and Buhaug2015; Uexkull, d’Errico, and Jackson Reference Uexkull, d’Errico and Jackson2020).Footnote 6
In this article, we use the Zambia Election Panel Survey (ZEPS). ZEPS is an original panel survey fielded in and around the Zambian 2021 election (Lust et al. Reference Lust, Beardsworth, Krönke, Seekings and Wahman2021). The two-round survey included 1,289 Zambians, and interviews were conducted in local languages (Nyanja, Bemba, Tonga, and Lozi) and English over the phone by trained enumerators based in Lusaka.Footnote 7
Telephone numbers in the ZEPS database were collected in an original face-to-face survey fielded in 2019 (Lust et al. Reference Lust, Kao, Landry, Harris, Dulani and Metheney2019). The original survey sample was obtained via a stratified multi-stage probability proportional to size sampling scheme in two sampling areas: (1) a 50 km radius of Lusaka and (2) a 100 km radius from Zambia’s border to Malawi (mainly in Zambia’s Eastern Province).Footnote 8 Lusaka and Eastern Province are suitable regions for the purpose of this study. Much of the political violence in Zambia and other African countries has been concentrated in capitals, hence the focus on Lusaka (Elfversson Reference Elfversson2025). Eastern Province was the stronghold of PF and the birth region of the losing presidential candidate Edgar Lungu (Seekings Reference Seekings2022). As such, it is a natural site for post-election violence (in 2016, post-election violence was concentrated in Southern Province, the birth region of Hakainde Hichilema). We do not claim that all provinces of Zambia would have experienced the same shifts in public opinion on political violence but that these provinces are crucial for understanding how violence can be justified in light of electoral outcomes and perceptions of election quality. The survey is not nationally representative: we show in the appendix how our sample differs from the nationally representative Afrobarometer survey on key characteristics. However, our primary aim is not to produce nationally representative estimates of support for violence but to study the change in attitudes over time using internally valid data, which necessitates use of a panel survey.
We draw data from two rounds of data collection: round 1 was fielded from June 8 to July 3, 2021, and round 3 was fielded from August 25 to October 3, 2021. The election was held on August 12, 2021. The attrition rate between rounds 1 and 3 was 24%.
Our dependent variable is change in support for political violence.Footnote 9 To construct this variable, we use measures of support for political violence in the baseline and endline. The wording of the survey question is closely aligned with the definition of political violence used in this study. The relevant question in the survey was, “Do you agree or disagree with the following statement: Violence is sometimes legitimate to support a just cause in Zambian politics today?” Strongly agree was coded 5; agree, coded 4; neither agree nor disagree, coded 3, disagree, coded 2; and strongly disagree, coded 1. In the baseline survey, 22% of citizens agree or strongly agree with the use of violence. We code change in support for political violence from the baseline and endline measures, subtracting the baseline from the endline value. Positive values on this variable mean that respondents have become more accepting of political violence over time. We illustrate this variable in the results section.
Our findings from our focus groups provide a contextual understanding of the ways in which participants likely understood the question in the Zambian context. It is possible that respondents changed their perceptions of the central term “political violence” before and after elections. Indeed, some of our focus group participants indicated that violence tends to be of a higher scale after elections than before them. Although changes in conceptual understanding may affect the overall support for violence, we have no reason to believe that conceptual understanding would change in any systematic ways over time between groups (e.g., depending on partisanship). For instance, when asked about differences in violence before and after elections, women and men, as well as rural and urban participants, expressed similar sentiments in our focus groups. We also control for other respondent characteristics, such as ethnic group membership.
Our independent variables are measures of partisanship (loser/winner status) to test hypotheses 1 and 2 and of perceived election quality to test hypothesis 3. We interact partisanship with perceived election quality to test hypotheses 4 and 5. The variable election winners is coded from the baseline question (before the election): “If the presidential elections were held tomorrow, which party’s candidate would you vote for?” Respondents who answered “UPND” are coded as 1, and respondents who answered other parties, no parties, or provided no information are coded 0. Similarly, the variable election losers is coded 1 for respondents who answered “PF” or other parties (except UPND), and 0 for respondents who indicated they were independents or provided no answer.
We code the second independent variable, change in perception of election quality, by subtracting the baseline from the endline value. Again, positive values on this variable mean that respondents have a higher perception of election quality over time. The underlying question in the baseline and endline surveys ask respondents how free and fair they think the election will be / wasFootnote 10; this is a common way of asking about trust in elections.
We also include a range of control variables: age, female, ethnicity, independents, other partisans, education, unemployed, urban, and the support for political violence from the baseline survey. Age is measured as years of age (logged). Female is coded 1 for women and 0 otherwise. Ethnicity is an indicator for ethnic groups. We include it in all models but omit the estimates to shorten the tables. Education is an ordinal variable. Independents is coded 1 for respondents who said they did not feel close to any political party (and thus were neither a loser nor winner) or who did not answer the partisanship question,Footnote 11 and 0 otherwise. Other partisans indicate that the respondent felt close to minor parties. We measure unemployed, which is coded 1 for respondents who say no to “Do you have a job that pays a cash income?” and 0 otherwise. Urban is a binary variable. We include the baseline support for political violence variable to account for potential floor and ceiling effects. We use OLS models and cluster standard errors on district. The summary statistics are in the appendix table A1.
Results
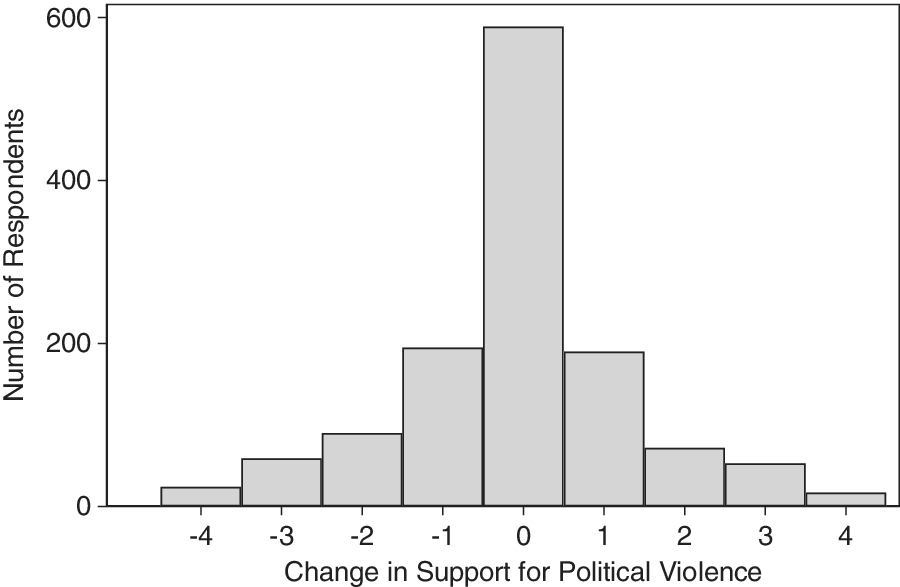
Before presenting the core results, we first show variation in the dependent variable. The variable change in acceptance of political violence is nicely distributed, as illustrated in figure 2. Many respondents remain unchanged in their attitude, and other respondents’ attitudes become more or less accepting of political violence. Fifty-four percent of respondents change their support for violence during the electoral cycle: about 26% of respondents become more accepting of violence, and 29% become less accepting. Although the modal outcome is no change in support for violence, it is still astonishing to see that more than 50% of respondents change their stated tolerance for violence in the short period we measure here (less than six months). These simple descriptives show that elections are powerful events that shape citizens’ approval of political violence.
Change in Acceptance of Political Violence in Zambia

Figure 2. Long description
The horizontal X axis is labeled Change in Support for Political Violence and ranges from minus 4 to 4 in increments of 1. The vertical Y axis is labeled Number of Respondents and ranges from 0 to 600 in increments of 200. The data is presented as a series of vertical bars forming a symmetrical bell-shaped distribution centered at 0.
* At minus 4, the bar is near 0.
* At minus 3, the bar rises slightly.
* At minus 2, the bar reaches approximately 100.
* At minus 1, the bar rises to approximately 200.
* At 0, the central bar peaks sharply at just under 600 respondents.
* At 1, the bar drops back to approximately 200.
* At 2, the bar is approximately 100.
* At 3, the bar is slightly lower than at 2.
* At 4, the bar returns to near 0.
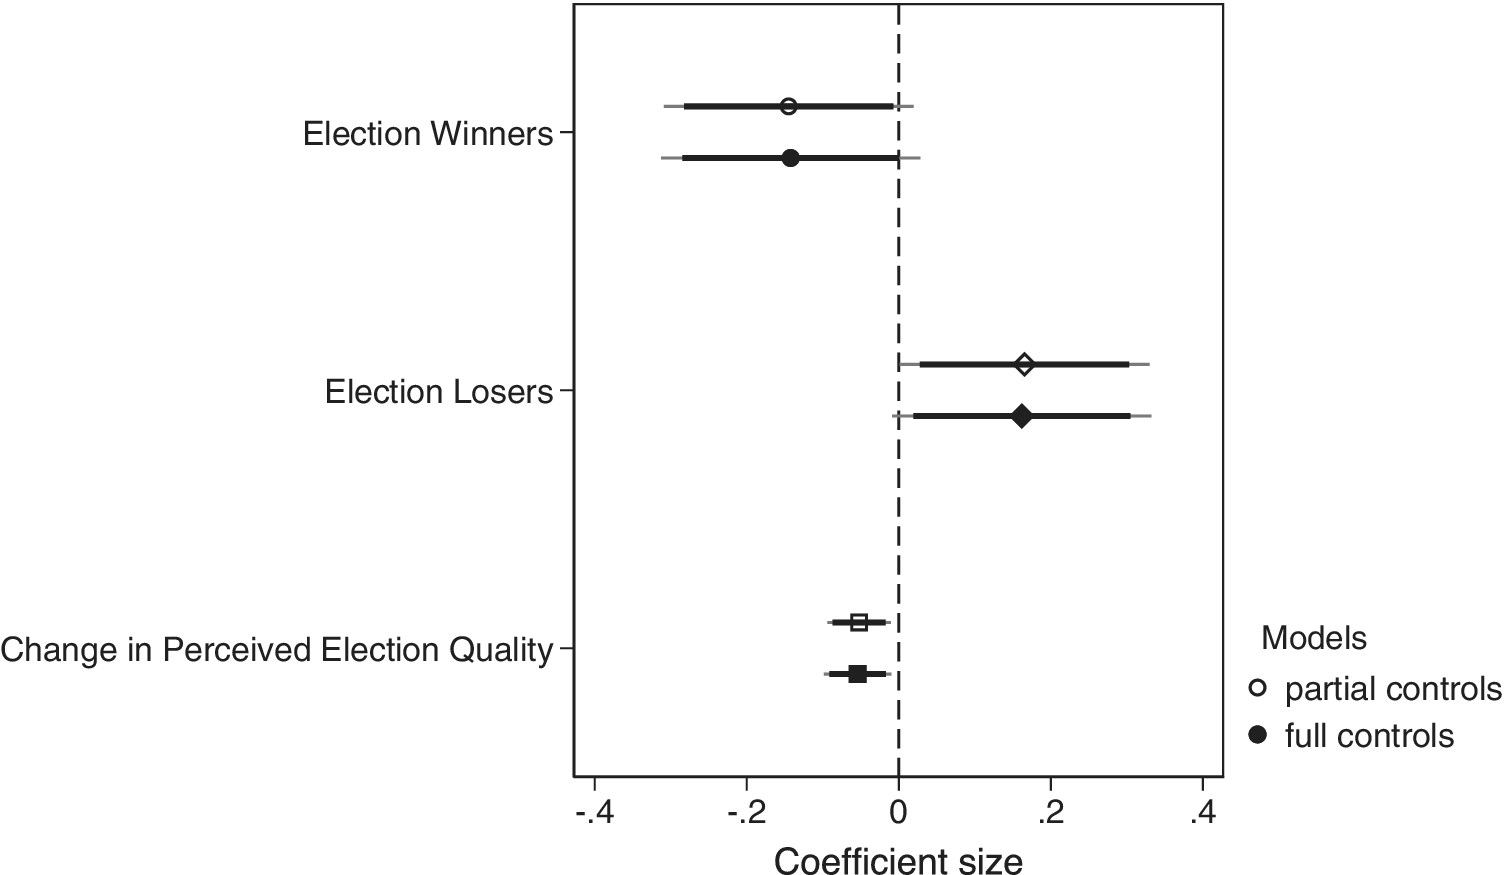
The core results for the effect of partisanship and election quality on acceptance of political violence are in figure 3.Footnote 12 Figure 3 shows coefficient estimates with 95% confidence intervals (in gray) alongside 90% (in black), because we have strong intuitions about the direction of change. We show three pairs of model estimates. The first pair shows results for election winners (H1), the second pair shows estimates for election losers (H2), and the last pair shows results for change in perceived election quality (H3). In each case, we show two model estimates: partial and full controls. The first model includes the explanatory variable, controlling for independents, other partisans, exogenous characteristics (age, female, ethnicity), and the baseline support for political violence; this model with partial controls is denoted by a hollow marker. The second model then includes full controls, adding other control variables (education, unemployed/poverty, urban); it is denoted by a solid marker. These estimates are robust to controlling for potential exposure to political violence.Footnote 13
Predicting Change in Acceptance of Political Violence in Zambia

Figure 3. Long description
A coefficient plot with a horizontal x-axis labeled Coefficient size ranging from negative .4 to positive .4. A vertical dashed line marks the zero point. The y-axis lists three categories from top to bottom.
* Election Winners: Two data points with horizontal error bars are located to the left of the zero line, centered around negative .15. The top point is an open circle for partial controls and the bottom is a solid circle for full controls.
* Election Losers: Two data points with horizontal error bars are located to the right of the zero line, centered around positive .18. The top point is an open diamond for partial controls and the bottom is a solid diamond for full controls.
* Change in Perceived Election Quality: Two data points with short horizontal error bars are located just to the left of the zero line, centered around negative .05. The top point is an open square for partial controls and the bottom is a solid square for full controls.
A legend at the bottom right identifies the open symbols as partial controls and the solid symbols as full controls.
We first examine hypotheses 1 and 2 about partisanship. H1 states that support for political violence will decrease among election winners. We find that election winners tended to reduce their support for violence. The winners significantly reduced their support for violence after the election: they lowered their acceptance of violence by 0.15 points, a 10% change in the outcome’s standard deviation, which is a substantively meaningful effect. Speaking more broadly to the contrast between election winners and losers in their support for violence, we find a statistically significant difference between these groups, supporting the prediction that election winners become significantly less supportive of violence.
H2 predicts that support for political violence will increase among election losers, and we find empirical support: election losers significantly increased their support for violence. The substantive estimate is again 0.15 points, which represents a 10% change in the outcome’s standard deviation. This is a remarkable result, given that the Zambian 2021 election was generally perceived as positive and a major breakthrough for democracy (Resnick Reference Resnick2022).
Figure 4 shows that perceptions of election quality increased regardless of partisanship. The dots represent individual respondents, and the lines mark mean values for each partisan group. The improvement is particularly notable among winning partisans, but even election losers gained confidence in election quality after the election. It is thus remarkable that even though both winners and losers improved their perception of election quality over time, losers still increased their support for violence. Winner/loser status thus matters for the way in which citizens reevaluate their support for violence, even in this critical context of turnover in government.
Election Increased Perceptions of Election Quality regardless of Partisanship

Figure 4. Long description
The Y-axis represents Perception of Election Quality with four categorical levels: completely free and fair 4, free and fair with minor problems 3, free and fair with major problems 2, and not free and fair 1. The X-axis has two time points: Before Election and After Election.
Data is displayed as clusters of jittered dots in purple for Election Loser and orange for Election Winner.
* At the top level 4, dense clusters of both purple and orange dots appear both before and after the election.
* At level 3, clusters are dense before the election but appear slightly less dense after the election.
* Levels 2 and 1 show sparse distributions of dots at both time points.
Two mean value lines with shaded confidence intervals represent the trends:
* The Election Loser line in purple starts at a mean value slightly above 3 before the election and shows a moderate linear increase toward level 4 after the election.
* The Election Winner line in orange starts at a lower mean value between 2 and 3 before the election and shows a steep linear increase, ending at nearly the same point as the losers near level 4 after the election.
A legend on the right identifies the Mean values for Election Loser as a purple line with a dot and Election Winner as an orange line with a dot.
Moving to the issue of changed perceptions of election quality, hypothesis 3 proposed that respondents with increased trust in elections will reduce their support for political violence. We also find strong empirical support for this hypothesis. In figure 3, the coefficients on perceived election quality change are negative and highly statistically significant. Substantively, the magnitude of the effect is moderate: 3% of a change in the outcome’s standard deviation. Results support H3, demonstrating that citizens with increased perceptions of electoral integrity are likely to reduce their acceptance of political violence.
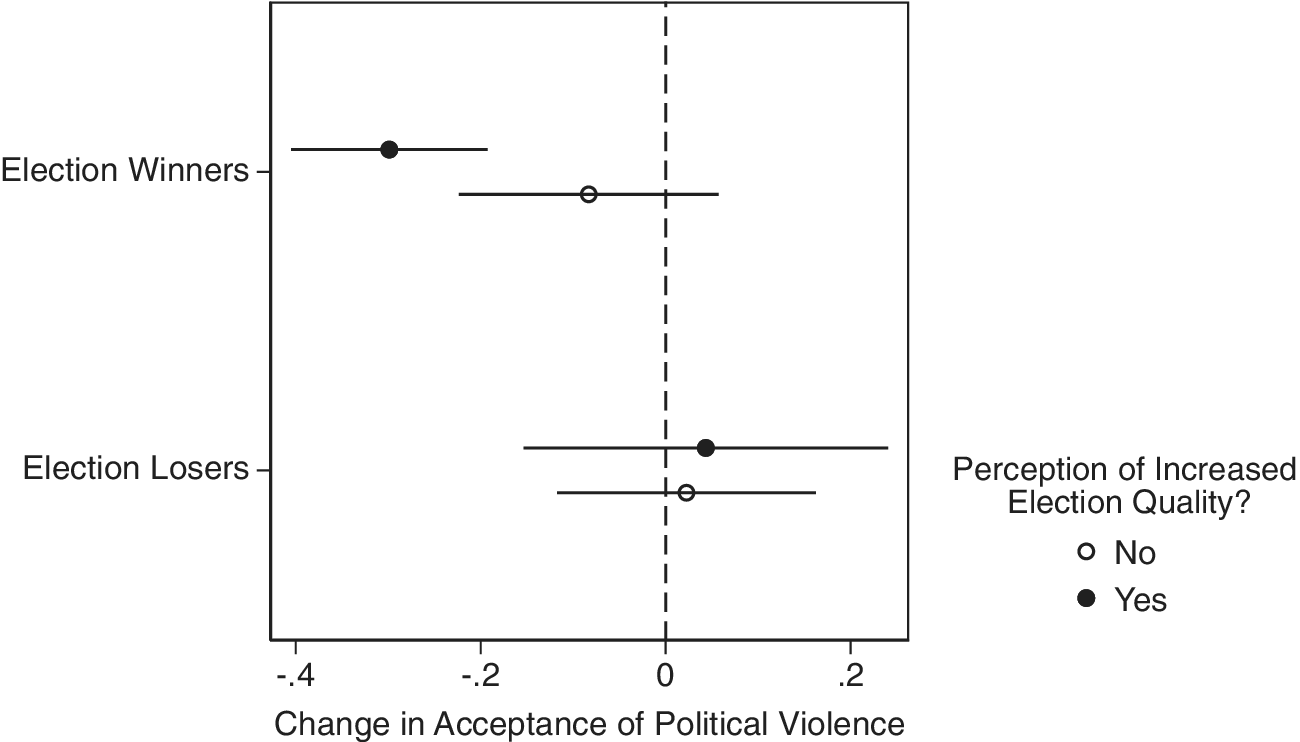
Finally, hypotheses 4 and 5 deal with interactive effects. We present results for these hypotheses in figure 5, which shows the predicted change in supporting political violence as a function of changes in perceived election quality and loser/winner status. H4 focuses on losers and notes that they will increase their support for violence more if they lack increased trust in elections. Our analysis of H4 thus focuses only on losing partisans. Estimates for election losers are shown in the lower part of figure 5, comparing the hollow and solid marker estimates. We do not see differences in approval of political violence among losing partisans in Zambia depending on changes in perceived electoral quality.
The Effect of Partisanship and Increased Election Quality on Acceptance of Political Violence in Zambia

Figure 5. Long description
A coefficient plot with a horizontal x-axis labeled Change in Acceptance of Political Violence, ranging from negative .4 to positive .2. A vertical dashed line marks the zero point. The y-axis has two categories: Election Winners at the top and Election Losers at the bottom. A legend on the right indicates that an open circle represents No perception of increased election quality and a solid black circle represents Yes, a perception of increased election quality.
* For Election Winners: The solid black circle (Yes) is located at approximately negative .3 with a narrow horizontal confidence interval. The open circle (No) is located at approximately negative .08 with a wider confidence interval that crosses the zero line.
* For Election Losers: The solid black circle (Yes) is located just above zero at approximately positive .04 with a wide confidence interval. The open circle (No) is located slightly lower at approximately positive .02 with a slightly narrower confidence interval. Both loser categories have confidence intervals that overlap the zero line.
H5 compares winners and losers and states that respondents who have increased trust in elections will reduce their support for political violence more if they support the winning party. Here, we compare the solid marker estimates within figure 5. We find strong support for this hypothesis: a sharp decline in approval of violence among winners with increased trust in elections but no decline in approval of political violence among losers with increased trust in elections. That is, even if election losers praise the electoral process, that does not dampen their support for political violence. As noted earlier, we think this is because losers are also instrumentally motivated, and the election outcome (losing government power after turnover) foreshadows undesirable policies.
To sum up the results in relation to H4 and H5, partisanship and trust in elections do interact in interesting ways, although these interactions are not consistently significant. These results invite more research on the contexts in which partisanship or institutional trust may matter more or less.
Extension: Kenya
To investigate the generalizability of the results from Zambia, we extend the empirical test using another original panel survey from the Kenyan 2017 election. Kenya is a useful extension case because, like Zambia, it is an unconsolidated democracy, but it did not have a turnover in power (instead, an incumbent victory), had lower election quality, and has a much stronger history of election violence than Zambia.
In 2017, Kenya’s government party won reelection after a highly controversial election, in which the Supreme Court annulled the results of the first electoral contest (Bartels, Horowitz, and Kramon Reference Bartels, Horowitz and Kramon2023). The initial election was won by incumbent president Uhuru Kenyatta’s Jubilee Coalition with 54% of the vote but was annulled based on severe procedural flaws. A controversial re-run was then boycotted by the opposition, which voiced serious concerns with the electoral commission. The main opposition contender (Raila Odinga of the ODM party/NASA alliance) withdrew from the re-run. Without serious competition, the Jubilee Coalition again clinched the victory, this time with 98% of the vote. Although the opposition again challenged the results, the Supreme Court rejected its petition (Bartels, Horowitz, and Kramon Reference Bartels, Horowitz and Kramon2023).
The risks of political violence in Kenya were on everyone’s mind before and during the election, given the country’s history of electoral large-scale violence. Every Kenyan election has been accompanied by high degrees of violence,Footnote 14 but the 2007 election particularly stands out in its scale (Dercon and Gutiérrez-Romero Reference Dercon and Gutiérrez-Romero2012; Mueller Reference Mueller2008). In the 2007 election crisis, the opposition mobilized against what it perceived to be a stolen election, leaving more than a thousand Kenyans dead (Cheeseman Reference Cheeseman2008; Malik Reference Malik2024). The 2017 elections were not as violent as those in 2007, but there were still significant levels of violence, with several violent protests, more than a hundred reported deaths, and many more injured. Much of this violence occurred during clashes with police and involved the police’s (mis-)use of force, followed by riots and property damage (Mutahi and Ruteere Reference Mutahi and Ruteere2019).
Kenya thus serves as a useful secondary case: it did not have a turnover and did experience higher-scale violence. We used another original panel survey on political violence with quite similar types of questions, but it is not a direct comparison of identical measures because of differences in question wordingFootnote 15 and data collection. Even though these surveys were all original data collections, we conducted them individually and they were not initially intended as a comparison. The Kenya panel survey also has a somewhat smaller sample (N = 970). As with Zambia, information about sampling, timeframes, and survey methodology in Kenya is found in the appendix.
Despite these differences, the Kenyan descriptive statistics are similar to Zambia. In the Kenyan baseline survey, the share of citizens who somewhat or strongly agree with the use of violence is 27%. The share of respondents who change their support for violence during the electoral cycle is 58%: about 25% of respondents become more accepting of violence, and 33% become less accepting. The dependent variable is also quite similarly and equally distributed.
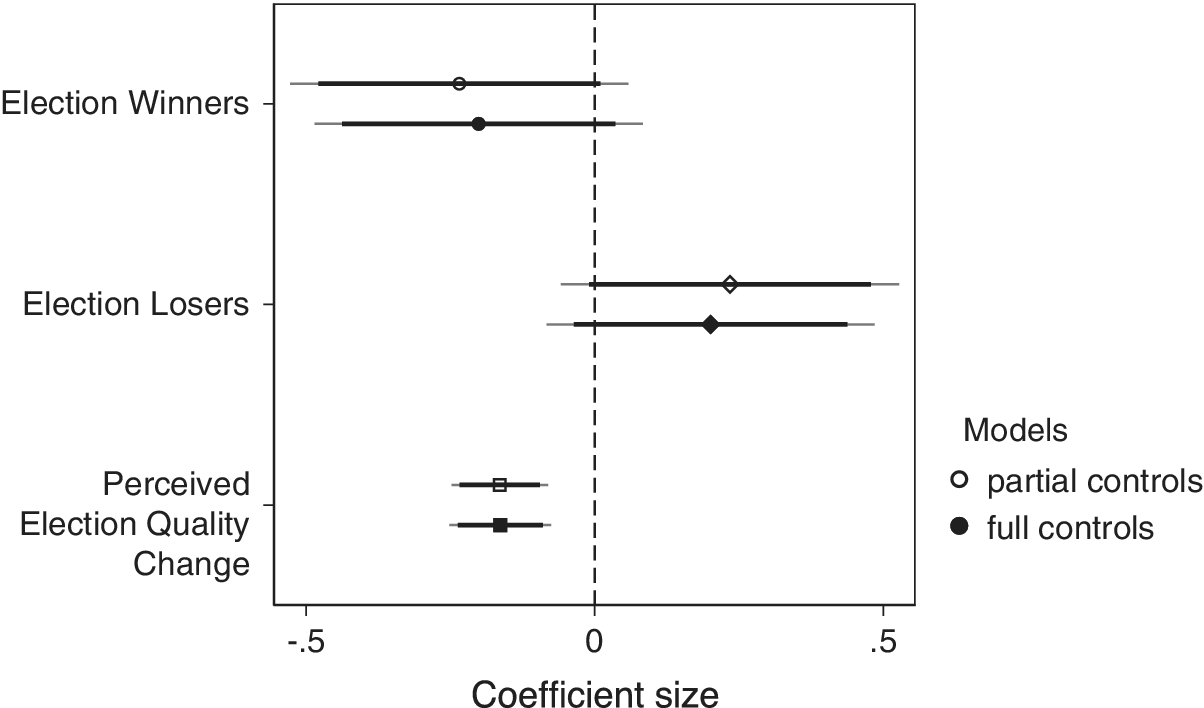
Data from Kenya also show broad support for our hypotheses. Figure 6 shows results for hypotheses 1–3 in the Kenya data. We find the same tendencies in both countries: negative associations for election winners, positive for election losers, and negative for changes in election quality perception. The first two tendencies are less statistically significant in Kenya, falling short of traditional cutoffs. There are two potential, complementary reasons for why the partisan effect on attitudinal changes is less significant in Kenya: one is related to statistical power, resulting from the smaller sample size, and the other is related to the lack of a transfer of power in Kenya, which means that groups excluded from power before the election continue to be excluded after the election, so that further updating of attitudes is limited. The third tendency is consistently statistically significant and substantively strong: the effect of increased perceptions of election quality is 12% of a change in the outcome’s standard deviation.Footnote 16 This supports H3 that citizens with increased perceptions of electoral integrity are likely to reduce their acceptance of political violence.
Predicting Change in Acceptance of Political Violence in Kenya

Figure 6. Long description
A coefficient plot with a horizontal x-axis labeled Coefficient size ranging from negative .5 to positive .5, with a vertical dashed line at zero. The y-axis lists three categories from top to bottom.
* Election Winners: Two horizontal bars are positioned to the left of the zero line. The top bar (partial controls, open circle) and bottom bar (full controls, solid circle) both show negative coefficients centered around negative .25 with wide confidence intervals that do not cross zero.
* Election Losers: Two horizontal bars are positioned to the right of the zero line. The top bar (partial controls, open diamond) and bottom bar (full controls, solid diamond) show positive coefficients centered around positive .25. The confidence intervals are wide and cross the zero line slightly.
* Perceived Election Quality Change: Two horizontal bars are positioned to the left of the zero line. The top bar (partial controls, open square) and bottom bar (full controls, solid square) show negative coefficients centered around negative .15 with narrow confidence intervals that do not cross zero.
A legend on the bottom right identifies open symbols as partial controls and solid symbols as full controls.
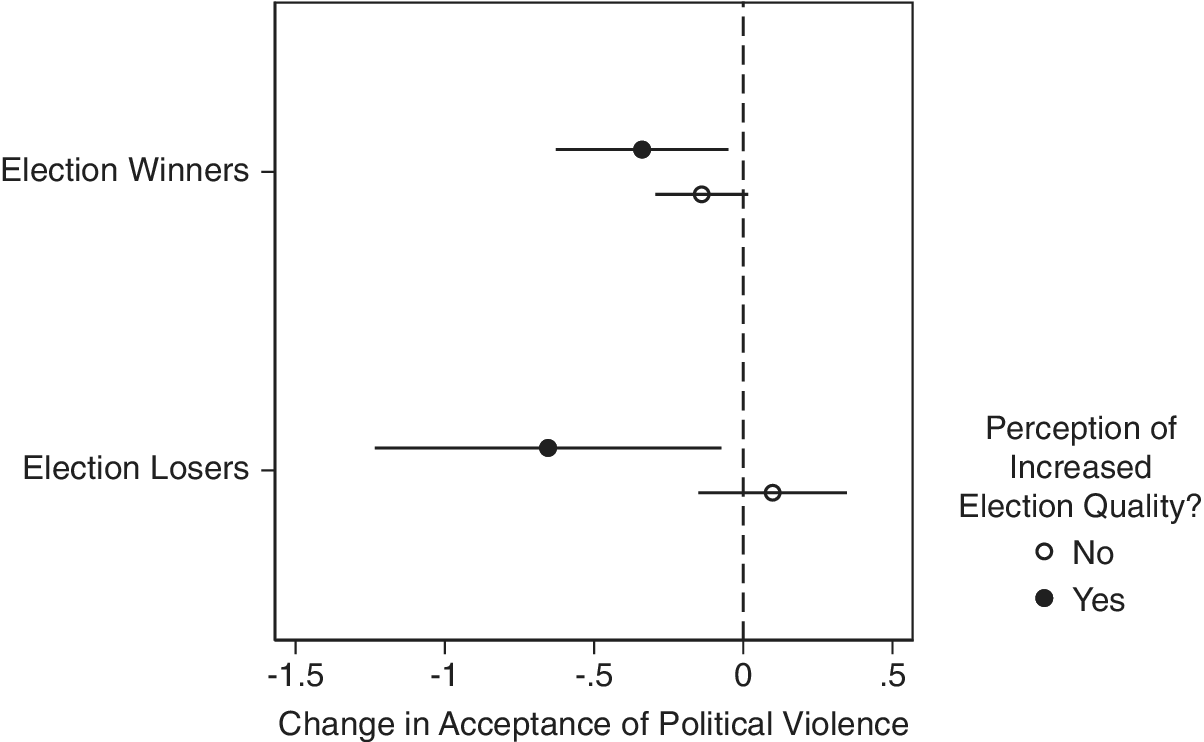
The Kenyan results for the interactive effects predicted by hypotheses 4 and 5 are shown in figure 7. We do indeed see that election losers who improve their trust in elections in Kenya are significantly less supportive of violence; however, we do not find such significant interactions for the winners in the Kenyan case. These mixed findings mirror the mixed findings in the Zambian case but for different partisan groups, possibly because of the different context. Despite this variation on interactions and the smaller sample size, the main hypotheses 1–3 show similar trends to Zambia, lending support to the notion that such dynamics generalize to other (and quite different) political and conflict cases.
The Effect of Partisanship and Increased Election Quality on Acceptance of Political Violence in Kenya

Figure 7. Long description
The x-axis represents the Change in Acceptance of Political Violence, ranging from negative 1.5 to 0.5, with a vertical dashed line at 0 indicating no change. The y-axis lists two groups: Election Winners at the top and Election Losers at the bottom. A legend on the right indicates that an open circle represents ‘No’ perception of increased election quality, while a solid black dot represents ‘Yes’.
* For Election Winners: The ‘Yes’ group (solid dot) shows a significant decrease in acceptance, centered around negative 0.3 with a horizontal confidence interval from negative 0.6 to negative 0.1. The ‘No’ group (open circle) is centered closer to 0, around negative 0.1, with a narrower confidence interval.
* For Election Losers: The ‘Yes’ group (solid dot) shows a substantial decrease in acceptance, centered around negative 0.65 with a wide confidence interval from negative 1.2 to negative 0.1. The ‘No’ group (open circle) is centered slightly above 0, around 0.1, with a confidence interval crossing the zero line from negative 0.1 to 0.3.
Conclusion
Elections are important institutional features designed to reduce the risk of political violence, but they may also inspire violent acts among aggrieved populations. In unconsolidated democracies, turnovers are important for the vitality of democracy, but as this article shows, they do not solve all issues related to political legitimacy and violence. Studying the noteworthy case of the Zambian election in 2021, we show that despite the historic turnover, acceptance of political violence follows familiar patterns: election winners reduce their acceptance of violence, whereas election losers increase their acceptance of violence. Trust in elections matters: increased trust reduces the acceptance of violence.
These results have important theoretical, empirical, and practical implications. They show how strongly partisanship determines voters’ reactions to elections. Even when we have a turnover and losers acknowledge higher election quality, losers react by increasing their support for violence. This finding dampens some of the most optimistic predictions on how turnover may strengthen democracy in new and polarized electoral environments. Second, although a burgeoning literature has studied the causes of electoral trust and how low election credibility facilitates protest and violence (Daxecker Reference Daxecker2012; Hyde and Marinov Reference Hyde and Marinov2014; von Borzyskowski Reference Borzyskowski2019a), little is known about the ways that low electoral trust may translate into changing support for antidemocratic strategies at the micro-level. This article provides strong support for such connections. Keep in mind that we study one of the most extreme manifestations of antidemocratic values and its change during a narrow timeframe. Nevertheless, we find that lowering trust in elections leads to higher acceptance of violence.
Lastly, from a practical perspective, the findings suggest that increasing the quality and transparency of elections is vital in establishing peaceful and stable democracies (Birch and Muchlinski Reference Birch and Muchlinski2017; von Borzyskowski Reference Borzyskowski2019b). Although partisanship does affect citizens’ evaluations of elections, citizens are also able to at least partly make nonpartisan evaluations of election quality. Even controlling for partisanship, we find a strong and consistent importance of electoral trust for reducing respondents’ acceptance of political violence.
Supplementary material
To view supplementary material for this article, please visit http://doi.org/10.1017/S1537592726105830.
Data replication
Data replication sets are available in Harvard Dataverse at: https://doi.org/10.7910/DVN/TDADO0
Acknowledgments
For their valuable feedback, we thank participants in the comparative politics seminar at Aarhus University, especially Laurits Aarslew and Merete Bech Seeberg. Nicholas Kerr, Nazita Lajevardi, and Kelsey Osborne-Garth also provided excellent feedback. We also thank our collaborators in fieldwork and data collection in Zambia and Kenya. The Zambian survey was implemented by Ubuntu Research and Rural Development Company. We are grateful to Ubuntu’s director, Fison Mujenja. The study was determined exempt by the Michigan State University (MSU) IRB Office (STUDY00006161). The collection of the Zambian Election Panel Survey (ZEPS) data was enabled by a Swedish Research Council Recruitment Grant [E0003801 to Pam Fredman], and funding from the University of Cape Town [to Jeremy Seekings]. We are grateful to Ellen Lust, Nicole Beardsworth, Mattias Krönke, and Jeremy Seekings for their collaboration throughout the ZEPS project. Erica Metheney and Kirk Ammerman provided data collection support. The Kenyan survey was implemented by CRECO Kenya. We are grateful to CRECO Kenya’s executive director Joshua Changwony and his team. The study was determined exempt by the Florida State University (FSU) IRB Office (2017.20255, 2017.21908). The collection of the Kenyan Election Panel Survey data was enabled by a collaboration with the United States Institute of Peace. We are grateful to USIP’s senior program officer Jonas Claes for his collaboration throughout the project.



 Open access

