

Introduction
The United Kingdom (UK) pension system is complex, difficult to understand and crucial for the retirement income of older people and the coming cohorts of older people. The Basic State Pension is the largest component of the system, and many people rely upon this pillar to sustain their well-being. For a significant minority (the middle class and those in unionised jobs), however, this source of retirement income is supplemented by the second tier of occupational pensions and/or the third tier of private savings or pensions. Currently most retirees in the UK derive 60 per cent of their income from state sources and 40 per cent from occupational and private pensions (Department for Work and Pensions (DWP) 1998): the Labour government has expressed a desire to control future spending (to 2050) by reversing this ratio, such that future cohorts rely on private savings and occupational pensions for 60 per cent of their post-retirement income.
The real value of the Basic State Pension has been falling for many years.Footnote 1 Furthermore, it appears that many workers (especially women and low-income earners) are not saving enough to ensure an adequate retirement standard of living (Pensions Commission 2005). In response, the Pensions Commission recommended the establishment of a low-cost National Pensions Savings Scheme (NPSS) along defined-contribution (DC) lines with tax-preferred contributions from both employers and employees. The NPSS is intended to boost future retirement savings, especially amongst those not covered by private pensions, and to address problems of equity amongst different segments of the population. The NPSS will probably provide investment choices, with a default option for those unwilling or unable to make informed choices (see the DWP's 2006 White Paper on the design and structure of the NPSS).
Based on a specially commissioned 2006 survey of nearly 900 randomly-selected British occupational-pension plan participants, this paper focuses on the relationship between the respondents' age, gender, household income, marital status and spousal pension status and their risk propensities. Our goal is to better understand the significance of socio-demographic factors for occupational-pension plan members' risk preferences, and how those preferences may translate into intended asset-allocation strategies. This is important given the current debate about financing UK pensions and the recent policy emphasis on pensions' flexibility, individual choice and self-responsibility. In this paper we seek a rapprochement between those who focus upon cognitive skills and those who believe that individual attitudes and behaviour are best understood at the intersection between cognition and the environment including social structure, social identity, social values and opportunities (see Krueger and Funder Reference Krueger and Funder2004; Strauss Reference Strauss2007).
In the next section, relevant publications from behavioural finance, economics, economic geography, gender studies and social psychology are discussed. The structure of the sample survey and the methodology underpinning the analysis are set out in the third section, where we point to the evidence that respondents tend not to differentiate risk either according to the means of retirement saving or the type of pension plan. Thereafter, the results of the analysis are elaborated, noting the significance of social differentiation and the relevance of spousal pension entitlements for respondents' risk-related attitudes. In the penultimate section we show how respondents' social status may give rise to distinctive asset allocation strategies, which suggests that a deeper understanding of these patterns should be the subject of further research. The paper concludes with a summary of the results and their implications for UK public policy, as well as the design of employer-sponsored pension education and information-awareness programmes.
Literature review
Global competition, changes in accounting rules, and the stock market pricing of expected liabilities have undercut the viability of private defined-benefit (DB) pension plans in much of the Anglo-American world (Clark and Monk Reference Clark and Monk2007a). While the growth of private defined-contribution (DC) pension plans has been attributed to plan sponsors' lower risks and costs, DC pensions are also more flexible and portable than DB pensions – characteristics that have made these types of plans attractive to younger workers (Clark and Monk Reference Clark and Monk2007b). Even so, when plan sponsors shift from DB to DC plans, employer and employee contributions tend to fall, discounting the prospective relative value of such pensions (Munnell Reference Munnell, Clark, Munnell and Orszag2006).Footnote 2 Furthermore, and notwithstanding the virtues of immediate vesting and the portability of accumulated assets, DC pensions entail the realignment of risk – from the employer to the employee.Footnote 3 The nature and scope of individual responsibility also varies by plan, but in many cases workers become wholly responsible for their enrolment, contribution rates, the allocation of assets to investment classes, and their choice of investment products and providers.
It could be assumed that pension plan participants behave rationally and maximise utility, but as Kahneman and Tversky (Reference Kahneman and Tversky1979) have shown, individuals do not always act according to the dictates of economic theory, especially under conditions of risk and uncertainty. Recent research confirms that many DC participants do not make ‘optimal’ decisions about saving for retirement (see Iyengar, Jiang and Huberman Reference Iyengar, Jiang, Huberman, Mitchell and Utkus2004; Mitchell and Utkus Reference Mitchell, Utkus, Mitchell and Utkus2004; Sholz et al. Reference Scholz, Seshadri and Khitatrakun2004). Some commentators have expressed doubts about the ability of plan participants to make decisions that are consistent with their long-term financial needs, citing the widespread lack of financial knowledge and understanding (see Dolvin and Templeton Reference Dolvin and Templeton2006; Lusardi and Mitchell Reference Lusardi and Mitchell2005). It has also been observed that employees often do not take full advantage of employers' matching contributions (see Choi et al. Reference Choi, Laibson, Madrian and Metrick2001; Choi, Laibson and Madrian Reference Choi, Laibson and Madrian2004, Reference Choi, Laibson and Madrian2005); they have less than optimal financial knowledge and do not utilise information efficiently (Bernheim Reference Bernheim, Mitchell and Schieber1998); and they are risk averse when faced with asset allocation and portfolio choices, and may be risk-seeking in the face of losses (see Kahneman et al. Reference Kahneman, Schwartz, Thaler and Tversky1997; Tversky and Kahneman Reference Tversky and Kahneman1991).
The behavioural revolution has had far-reaching consequences for pensions research. It should be recognised that individual decision-making occurs at the interface between cognition and the environment, such that the observed outcomes depend upon many other factors including socio-demographic characteristics (Weber et al. Reference Weber, Balis and Betz2002; Strauss Reference Strauss2007). Gigerenzer (Reference Gigerenzer2004) invoked Simon's (Reference Simon1956) scissors metaphor, used to describe the way cognition and environment come together in the decision-making moment, to suggest that a person's place in society and, by implication, their relationships with others, play significant roles in the formation of risk preferences. It has been shown that differences in risk-related attitudes and behaviour emerge when socio-demographic variables such as gender, occupation, and age are considered. It has also been observed that, in general, women are more risk-averse than men, the young are more risk-seeking than the old, wealthier individuals manifest a greater willingness to invest in equities, and the poor are risk averse (see Bajtelsmit Reference Bajtelsmit, Clark, Munnell and Orszag2006; Bajtelsmit, Bernasek and Jianakoplos Reference Bajtelsmit, Bernasek and Jianakoplos1999; Bernasek and Shwiff Reference Bernasek and Shwiff2001; Ginn and Arber Reference Ginn and Arber1991; Lusardi and Mitchell Reference Lusardi and Mitchell2005).Footnote 4
This paper reports the results of tests of significance of such characteristics and their interactions on pension-related attitudes and putative behaviour in the United Kingdom. From a study of household bargaining, Freidburg and Webb (Reference Friedberg and Webb2006) indicated that risk tolerance in financial decision-making is associated with the age of an older spouse, and whether that individual is male or female. Similarly, Hallahan, Faff and McKenzie (Reference Hallahan, Faff and McKenzie2004) demonstrated for a large sample of Australians that the household, not just the individual, is an important risk-related decision unit. In British society, income level, education, age, gender and marital status are thought to be closely related and proxies for financial literacy and experience. Recent research has also suggested that the cultural context may be very important in driving risk-related preferences whatever the shared cognitive biases and social institutions (see Bertrand et al. Reference Bertrand, Karlan, Mullainathan, Shafir and Zinman2005 on financial decision-making, and Henrich et al. Reference Henrich, Boyd, Bowles, Camerer, Fehr, Gintis, McElreath, Alvard, Barr, Ensminger, Smith Henrich, Hill, Gil-White, Gurven, Marlowe, Patton and Tracer2005 on risk behaviour across cultures).
By this assessment, understanding pension-related attitudes and behaviour requires at one level an appreciation of cognitive competence and, at another level, sensitivity to the social status of respondents as well as their cultural milieu. This study tests for the significance of the social characteristics of UK respondents in pension attitudes and behaviour, utilising the variables that have been identified as significant by pensions research in other countries (e.g. on members of the common DC-type 401(k) occupational pension plans in the United States). As such, it is one of the first attempts in the United Kingdom to test for the relationship between individual pension-risk propensities and their social characteristics. Nevertheless, it should be recognised that the scope of our findings and conclusions are limited by the size of the sample and the paper's emphasis on perceived risk rather than actual behaviour.Footnote 5
Survey method and implementation
The questionnaire survey of UK pension plan participants' risk-related attitudes and behaviour was sponsored by Mercer Human Resource Consulting as part of their developing DC pensions consulting practice. It was conducted between January and May of 2006 by the UK market research consultancy Objective Research. The original target of 1,000 respondents to the postal questionnaire was established by the two companies. The survey was designed to represent the workforce employed by UK organisations with more than 25 employees worldwide. The inclusion criteria were that an eligible respondent had to work in the private sector and have some form of occupational or private pension plan, and an exclusion criterion was that their pension could not be a final salary plan. During the first six weeks of the fieldwork, however, it proved difficult to recruit respondents with these criteria.Footnote 6 It was agreed that no more than 20 per cent of the sample should fall below the initial criteria but that the survey would recruit those working for organisations with more than 10 employees, and include both public-sector staff provided that they had a private pension and those with a final-salary related or defined-benefit (DB) pension. In the end, 16 per cent of the sample was not employed in the private sector and 15 per cent had a final-salary pension scheme.
The sample was sourced primarily from customer lists ordered in three batches.Footnote 7 The first batch had two components: 5,000 working individuals sampled as having a company pension, split by age and gender, excluding those who were retired, at home as housewives, in the public services, the self-employed, students and teachers/lecturers, topped up with 2,000 working individuals in relevant occupations who had not indicated that they held a company pension. Objective Research conducted screening telephone interviews using home telephone numbers over 10 weeks from January until March 2006. During the third week, another batch of 5,000 was ordered, followed by another in the ninth week. Each was split by age and gender according to the quotas that the interviewers had achieved at that point. Altogether 17,000 records were ordered with the aim of identifying 3,000 eligible persons to receive the postal questionnaire. The sample contained a large number of invalid and wrong numbers (over 20%); therefore two top-up batches from consumer records were ordered to compensate. At the point of the second top-up order, a 10 per cent error margin was agreed with the sample supplier.
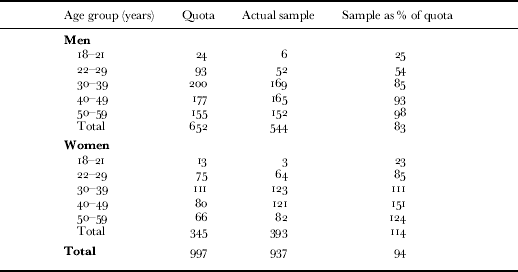
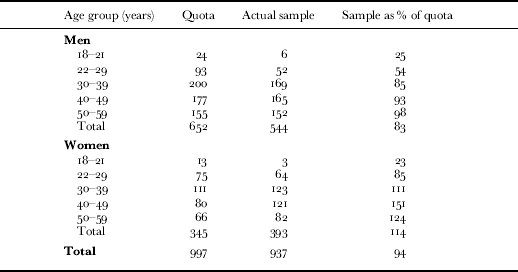
Of the 17,000 sampled individuals, 2,151 were sent the eight-page questionnaire with a cover letter (available from the authors). This was 849 short of the original target of 3,000. Because of the difficulty of finding eligible respondents, it was decided that effort should concentrate on achieving a high (45–50%) response rate and 900–950 completed questionnaires. To this end, follow-up telephone calls and mailed reminders were undertaken. Despite raising the number of calls to 18–29 year-olds during the last five weeks of the survey, the response rate was particularly low amongst this age group (even when a £5 gift coupon was offered). An overall mail response rate of 44 per cent was achieved. Returned questionnaires were checked for completeness and eligibility: 99.8 per cent met the eligibility criteria, giving a response rate of 44 per cent. The final age and gender response rates from the 2,151 surveys are shown in Table 1. All replies were punch verified (that is, were data entered twice). Objective Research produced four sets of tables in Microsoft Word, two of which were base ‘All Answered’, as well as a weighted data file in Microsoft Excel. The tables were weighted by adjusting for the age and sex composition of the total UK working population. At this point, the demographic profile of the sample was checked for bias. None was found, therefore additional weighting was deemed unnecessary.
Final response rates
Gauging attitudes to risk
The survey has enabled examination of whether: (1) the respondents distinguished between the means of saving for retirement and the type of pension plan in relation to their risk propensity; (2) the expressed risk propensities correlated with the respondents' socio-demographic characteristics including gender, age, marital status and income level; and (3) the respondents' social status related to their desired asset allocation strategies. Gauging attitudes towards financial risk is notoriously difficult, not least because risk is poorly understood by many people, especially when the issues lack domain-specificity. In this survey, a specific pension-risk question was set using non-technical language so as to classify respondents by their risk propensity. Question 25 asked: ‘When you are thinking about long-term savings and pensions, which of the following best summarises your attitude?’ The offered responses were: (a) ‘I aim to get the best possible growth in the value of my savings, even if that means taking some risks which could cause my savings to fall in value’, and (b) ‘I prefer to have safe and secure savings and investments, even if that means they do not grow in value as much as they could’. The question is based on Kahneman and Tversky's (Reference Kahneman and Tversky1979) well-known test of risk aversion under risk and uncertainty. It has been widely applied in economics and psychology (see Baron Reference Barron2000) and is the basis of the analysis by Clark et al. (Reference Clark, Caerlewy-Smith and Marshall2006) of the risk preferences and decision-making of UK pension-plan trustees.
So as to compare the respondents' risk-related attitudes by their means of retirement saving and types of pension plan, the respondents were subdivided into the following categories: 145 (16%) who indicated they had a personal pension, 663 (73%) who participated in an employer-sponsored pension plan, and 103 (11%) who had both. Of the 789 respondents with an occupational pension, 118 (15%) indicated that they participated in a DB pension, 336 (42%) that they participated in a DC pension, and 338 (43%) were not sure of the type of their pension. That a large number of respondents were unsure of the type of their pension was a significant finding in its own right, as it challenges the assumption that people make rational choices about their pension plans on the basis of complete information and individual utility functions.
Among the 900 completed and valid responses, 202 (22%) of those who answered Question 25 chose Option A (a proxy for financial risk tolerance), and 698 (78%) chose Option B (a proxy for financial risk aversion).Footnote 8 This outcome seems to indicate significant levels of risk aversion among the sample, but reveals little about which groups are more or less risk averse in relation to their anticipated retirement income. This issue is of considerable importance for whether the estimated models ought to be partitioned: we found that no statistically significant differences existed between respondents' expressed risk propensities by the means of retirement savings and the type of employer-sponsored pension plan.Footnote 9
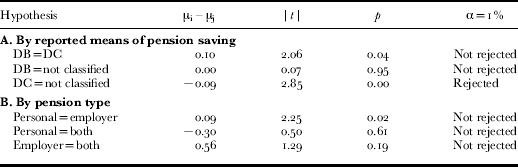
Using regression techniques, we sought to determine whether there was a significant difference in the expressed risk propensities (Options A or B) by the means of retirement savings and the type of pension plan. Risk propensity was regressed against dummy variables that represented the means of retirement savings (personal plan, employer-sponsored plan, or both) and the type of pension plan (DB, DC or both), and tests were conducted of the significance of the coefficients. We first conducted paired t-tests on the mean risk propensity of those with an employer pension plan, those with a personal pension, and those with both types (Table 2, Panel A). No statistically significant differences were found (p<0.01). In other words, the null hypotheses that mean risk propensity is the same for those with a personal pension in comparison to those with an employer pension (|t|=2.25), for those with a personal pension versus those with both types of pension (|t|=0.50), and for those with an employer pension versus those with both types of pension (|t|=1.29) were not rejected. We then carried out t-tests on the difference of mean risk propensity by pairs to determine whether risk propensity varied by type of employer-sponsored pension plan (Table 2, Panel B). In this case too, the t-tests provided no evidence to reject the hypotheses that: mean risk propensity is the same for respondents with a DB entitlement compared with a DC entitlement (|t|=2.06); and that members of a DB plan are unsure about their pension type as compared with those who do not have a DB pension (|t|=0.07). Again, all hypotheses were at the one per cent level of significance. The test did, however, reject the hypothesis that mean risk propensity is the same for those with a DC plan and those not sure of their type of pension (|t|=2.85).
Student's t tests of the difference of mean risk propensity
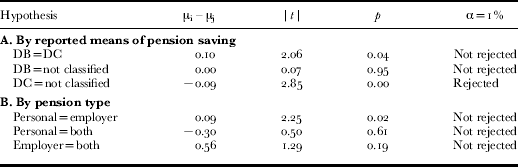
Notes: DB: defined-benefits pension. DC: defined-contributions pension. Personal: personal pension. Employer: employer pension. μi – μj difference of means.
Finally, we performed a Hotelling's t-squared generalised test of the difference of means to confirm whether risk propensity varied statistically across groups with different types of pension (personal, employer or both). In this test the auxiliary variables R′I are defined for each group as follows: R′I=R−μI, where R is the risk-related attitude (the choice of A or B in Question 25), and μI is the risk propensity of group I. The null hypothesis is that R′I=0 for every group I. Under the null hypothesis, then, mean risk propensity is the same for every group: the Hotelling test did not reject this hypothesis at the one per cent level of significance (F 2,908=0.71). We conducted the same test based on pension types DB, DC or not sure, to examine the hypothesis that risk propensity did not vary significantly on this basis: it was not rejected (F 2,908=0.7, p=0.55). We therefore concluded that, despite the t-test results for the difference in risk propensity between DC plan participants and those unsure of their pension type, we could not assume a statistically significant difference between these groups.
Risk propensity and socio-demographic characteristics
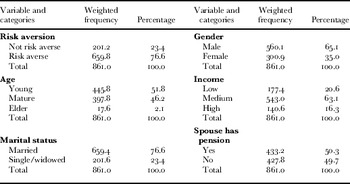
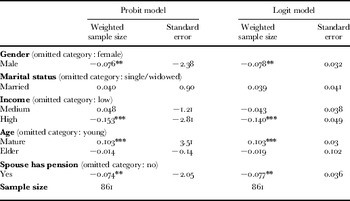
While the finding that the risk propensity of those with DC pensions is different from those who are unsure of their pension is inconsistent with the overall findings and of interest, its implications are difficult to interpret. What is crucial, however, is that the aberrant respondents' risk propensity did not vary in a statistically significant way by whether they had DB and DC pension plans. If this finding is validated for the UK population at large by a larger survey, it would have far-reaching implications for public policy and for occupational-plan sponsors' responsibilities – detailed in the Conclusion. More immediately, in the second stage of the analysis we tested the relationship between respondents' risk-related pension attitudes and their socio-demographic characteristics. Gender, marital status (married or single/widowed), income, age and a dummy variable for a spousal pension entitlement (yes/no) were used as independent variables (descriptions are provided in Table 3).Footnote 10 The dependent variable ‘risk aversion’ had a value ‘1’ when the person preferred ‘safe and secure savings’ (risk aversion), and ‘0’ when the person aimed ‘to get the best possible growth’ (risk tolerance).
Socio-demographic characteristics of the analysis sample

Source: YouGov commissioned survey, authors' calculations.
Seventy-one respondents had missing values for one or more of the dependent variables and were dropped from the analysis, so the analysis sample had 861 observations. Both the basic statistics and econometric models were estimated using the analytical weights provided in the data set. Three different versions of the model were estimated, using logit and probit non-linear probability models, and a linear probability model. For the model of risk propensity reported in this paper, the normality assumption of the disturbances is a natural choice, so this report focuses on the results of the probit model. In order to test the robustness of the results, however, we also estimated logistic and linear probability models, despite the acknowledged weaknesses of the latter.Footnote 11 The three models produced equivalent results, illustrating the robustness of the conclusions and that the data had no unusual features that hinder the estimation of a particular coefficient.
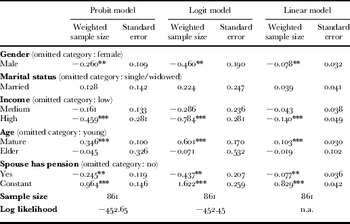
The non-linear models were estimated using maximum likelihood estimation, and the linear probability model was calculated using an ordinary least squares regression of ‘risk aversion’ as the dependent variable and the other determinants as explanatory variables. In the probit/logit model, the dependent variable ‘risk aversion’ (y) took values of 1.0 and zero. It was proposed that the values of y depended on the values taken by the independent variables (socio-demographic characteristics). To specify a functional form of these probabilities, the probit model assumed the existence of a latent variable y*[i]. This variable took values between zero and 1.0 and had a normal distribution. Its mean was xβ, where x indicates the dependent variable and β the effects of its variance σ2. The estimation of the model was designed to test the relationship between the socio-demographic variables and individuals' risk propensity. The results are presented in Table 4. It is important to note that as the three different specifications produced coefficients with the same signs and significance levels, the results were robust.
Estimated coefficients of probit, logit, and linear probability models of variations in risk aversion by socio-demographic characteristics

Note: n.a. not applicable.
Significance levels: * p<0.10, ** p<0.05, *** p<0.01.
Considering first the age effects, as mentioned above, young men have been shown to be more willing to take financial risks (Clark, Caerlewy-Smith and Marshall Reference Clark, Caerlewy-Smith and Marshall2006), and risk propensity decreases with increasing age (Milligan Reference Milligan2004). It is possible, however, that these effects are offset by wealth accumulation. The results for age show that the coefficient for the mature age group was positive and significant at the 0.01 level (Table 4). The coefficient for the elder age group was negative but not significant. This suggests that there is no statistically significant difference in the risk propensities of young and old people, but that the middle-aged tend to be more risk averse. It is possible that more finely distinguished age effects could have been present in the responses of the respondents, but that the current sample was insufficient to disentangle them because no more age groups could be distinguished.
On the income effects, recent economic studies of pension plan participants have shown that those who hold more assets are more likely to be less risk averse when making decisions about long-term savings (Carroll Reference Carroll2000; see also Poterba et al. Reference Poterba, Rauh, Venti and Wise2006). Among the survey respondents, those of both high and medium income had negative coefficients, although the coefficient for medium income was insignificant (Table 4). This suggests that those with medium and low incomes had the same level of risk aversion, but that those with high incomes tended to be less risk averse. This result raises a question about the level at which risk aversion is neutralised by economic security; in other words, how wealthy do pension plan participants have to be on average to be willing to take greater financial risk? This broad question bears upon the unresolved debate in the decision-sciences over the degree to which economic well-being does or does not affect risk-related decision-making (see Kahneman Reference Kahneman2003).
Gender differences in financial risk tolerance have been observed in both experimental settings (Clark, Caerlewy-Smith and Marshall Reference Clark, Caerlewy-Smith and Marshall2007) and in survey-based research (Bajtelsmit Reference Bajtelsmit, Bernasek and Jianakoplos1999; Papke Reference Papke1998). The results indicate that being male has a negative effect on the probability of being risk averse, confirming the generally held view that men are more risk tolerant than women. In the present analysis, the gender coefficient was significant at the five per cent level (Table 4). As shown elsewhere, gender is a significant factor in discriminating between respondents' risk propensities – this paper has provided evidence of an effect in Britain that has been widely reported elsewhere. It is important to note, however, that a sizable majority of all respondents displayed risk aversion in response to the risk proxy (Question 25).
The effects of marital status on risk tolerance are difficult to gauge, since co-habitation with a partner is associated with complex inter-personal relationships that might or might not involve pooled risk over time.Footnote 12 In the analysis conducted for this paper, the coefficient was positive but insignificant at the 0.10 level (Table 4). This suggests that risk aversion is the same for married and unmarried persons, or at least that marital status alone cannot account for differences in risk propensity between those with partners and those without. As shown below, it is likely that an entitlement to, or lack of, a spousal pension entitlement is more significant than straightforward marital status (or even gender) (cf. Sundén and Surette Reference Sundén and Surette1998). It would be interesting to assess whether the presence of offspring and of a bequest motive is influential in this context, but questions about children and family formations were beyond the scope of this study.
The effect of the presence or absence of a spouse's pension was negative and significant at the 0.05 level, indicating that those respondents whose spouses also had pension entitlements tended to be less risk averse. The result suggests that the interplay of the two household characteristics has a significant effect on individual risk propensity: that partners with high levels of long-term savings pool risks to enhance the total welfare of the household. This result is insufficiently robust, however, to show how risk is pooled by those couples for whom both members have pensions (for a discussion of marriage and gender differences in DC pensions decisions, see Bajtelsmit, Bernasek and Jianakoplos Reference Bajtelsmit, Bernasek and Jianakoplos1999), or whether the effect of increased household retirement savings is the same as the individual wealth effect that has been described.
Marginal effects on risk aversion
The interpretation of the coefficients in the probit and the logit models is not straightforward since they do not represent the marginal contribution of the variable to the probability of being risk averse. This is not the case for the linear probability model. In this model, the estimated coefficients can be interpreted directly as marginal probabilities. In Table 5, we present the estimated marginal probabilities for the probit regression. It is clear that the estimated marginal probabilities are almost identical in the probit and linear regressions. These estimations facilitate the quantitative assessment of the importance of each variable on individual risk propensity. In particular, the results show that having high income had the larger effect (reduced by at least 15%) on risk aversion. Being in the mature age group had a positive marginal effect of 10 per cent on this probability. Being male or being married to someone with pension entitlement had a minus seven per cent effect on the risk aversion probability. The other variables did not have statistically significant effects.
Marginal effects on in the probit and linear models

Significance levels: *p<0.10, ** p<0.05, *** p<0.01.
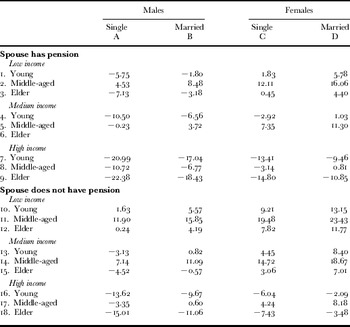
Table 6 presents estimated measures of risk aversion for a ‘typical agent’ using the results of the probit model. In this table, each cell represents the estimated risk propensity for the typical agent in comparison to the average in the sample. For example, risk aversion of the agent in cell A1 was 5.75 basis points less than that of the average risk aversion of all agents (aka respondents). These results suggest that the marginal probability of risk aversion was negatively influenced by the existence of a spousal pension entitlement for most groups, with the marked exception of low-income women. The marginal probability of risk aversion was positive for most groups without a spousal pension, apart from older, middle-income men and those with high incomes (men and women) in the young and older groups. In other words, having a spousal pension increased the marginal probability that an individual made riskier asset allocations (i.e. allocated a larger amount to equities) with her long-term savings unless she was a low-income woman. Conversely, being in a household where the spouse did not have a pension entitlement decreased this likelihood, except for high income and older groups, while high-income older women with and without spousal pension entitlements had a statistically significant negative marginal probability of being risk averse.
Marginal probabilities on risk aversion in the probit model

Note: The comparisons are between the average case in a sub-group and the base case, the average of all agents.
The socio-demographic profile of the respondents was such that young, low-income men with occupational pensions were about as likely as not to have a wife with a pension entitlement, but young, married, low-income women with a pension entitlement were twice as likely to have a spouse with a pension entitlement as not. Middle-aged, middle-income men with an occupational pension were quite likely to have a spouse without a pension, but middle-aged, middle-income women with an occupational pension were unlikely to live in a household with a spouse without a pension. The same held true for married, middle-aged, high-income men and for women with occupational pensions: men were slightly more likely to have a spouse with a pension entitlement than not, but women were far more likely to do so. Only in the case of young, medium-income, married men and women with occupational pensions were men more likely than women to have a spouse with a pension entitlement. It is true, however, that a below-average percentage of these young men had spouses with no pension entitlement.
Social status and asset allocation
The results suggest that in contemporary British society there are distinct pension-related risk ‘groups’ differentiated by their socio-demographic characteristics. This is apparent in the calibrated effects of certain socio-demographic variables on the risk propensity of respondents, as well as in the interaction effects of certain socio-demographic variables on putative asset allocation. The analysis is concluded by mapping the risk profiles of types of people represented in the survey by their asset-allocation strategies. It should be remembered that the survey asked respondents to undertake a hypothetical allocation exercise with a small amount of money. Calibrating the intersections between social status, risk propensity, and actual asset allocations is left for another time (and a larger sample with questions focused on intended and actual asset allocation in DC schemes). Nevertheless, we feel that this preliminary analysis indicates the relevance of the issue for further research.
In the third section of the survey (after the general, personal, demographic and pension entitlement questions), the participants were asked for their views on investment. They were first asked to rate their knowledge and understanding of three different investment fund types: cash, bonds and equities.Footnote 13 After providing their rating, they were given brief definitions of each type of fund. Question 28 then asked them to make asset allocations to some or all of the identified fund types. It read, ‘Imagine that you now have to invest your long-term savings for the majority of years between now and your retirement. Please indicate how you would invest your money in the three types of funds listed. Assume you have £100 to invest – how would you split between these funds?’ A preliminary analysis of gender differences in the declared allocation strategies showed that on average women allocated £39 to the cash option, £28 to the bond option, and £29 to the equity option. The comparable figures for men were £35, £28 and £35.
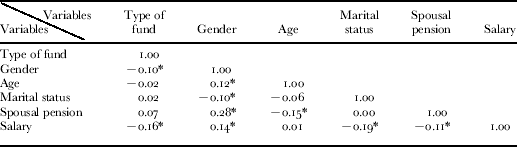
Given the low value of the ‘assets’ to be allocated, clearly the problem set in the survey was highly stylised; nor are we able to assess the stability of allocations over time.Footnote 14 Furthermore, it is apparent that the data have ‘missing’ groups – the respondents did not include, for example, a significant sub-sample of people who were elderly, high income, and married to a spouse without a pension entitlement. This was because the population sample was not large enough to provide usable sub-samples for all combinations of socio-demographic variables. Nonetheless, despite these limitations, preliminary tests suggested that there are correlations between risk propensity in allocation decisions and gender and income. The asset allocation variable Q28 was transformed into a categorical variable, scaled ‘1’ (very low risk strategy), ‘2’ (low risk), ‘3’ (moderate risk), ‘4’ (high risk), and ‘5’ (very high risk strategy). The categories were determined by the percentage allocated to cash (low risk), bonds (moderate risk) and equities (high risk). This allowed us to look at pair-wise correlations between the type of fund and gender, age, marital status, spousal pension and salary. The results showed that there was a statistically significant (p<0.01) correlation between the type of fund and gender and salary (Table 7).
Pair-wise correlation matrix for type of investment fund or savings and socio-demographic variables
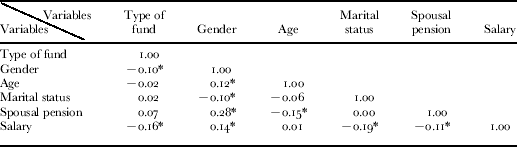
Note: The estimates are from weighted samples.
Level of significance: p<0.01.
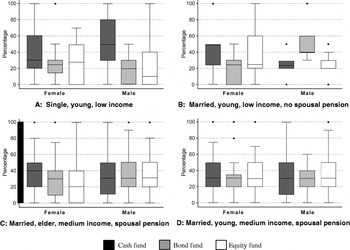
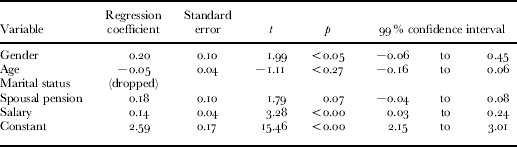
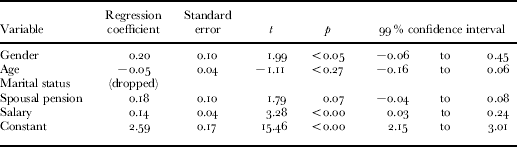
We then estimated a linear regression model with the Q28 type-of-fund variable as the dependent variable and gender, age, marital status, spousal pension and salary as the independent variables. The model showed that salary was the only significant predictor (p<0.01) of risk propensity as expressed by the allocation choices represented by the types of fund (Table 8). It is of interest that gender nonetheless had a weaker association with the fund preferences (p<0.05), which led us to explore the actual pattern of allocation choices made in Q28. It was concluded that the stylised profiles provide sufficient evidence to justify closer analysis of asset allocation by social groups. All of the sub-sample sizes were problematic for reliable regression modelling, so graphical representations of selected groups' choices are presented. In Figure 1, the plots of the asset allocations of four-by-two groups illustrate how the interaction effects give rise to rather different investment profiles. The information is provided in the form of box-plots of asset allocation representing the range and the quartiles of the amounts allocated to each asset class and the outliers.Footnote 15
Asset-allocation choices for selected socio-demographic groups.

Results of linear regression model on the effects of socio-demographic variables on asset allocation choices
Note: The estimates are from weighted samples.
Panels A and B of Figure 1 illustrate the differences in risk propensity as represented by the choice of assets among married and single low-income individuals whose spouses were without pensions. There were notable differences between single and married low-income young men. The single men displayed high allocations to the cash fund, with a median around 50 per cent and a positive skew, and lower, more variable allocations to bonds and equities. In all cases, the allocations were constrained between zero and 100 per cent. For married low-income men, the preference was for bonds, with a median allocation of 40 per cent and positive skew. It is striking that there was much less variability but more outliers for this group. Most young married low-income men had similar allocation patterns but a few displayed markedly different preferences. There was much more variability among young unmarried men in the same socio-economic group but fewer instances of extreme allocations. Notice, moreover, that for married men, the maximum of 100 per cent and a zero allocation occurred only as outliers. Not only did members of this group display less variability in their asset allocation strategies but they also allocated more evenly, with the allocations to each type typically between 20 and 60 per cent (cf. Benartzi and Thaler Reference Benartzi and Thaler2002).
Married people with median incomes were the largest socio-demographic group in the sample. Older, married, middle-income women displayed an aversion to equities (Panels C and D). Their median allocation was 20 per cent but the lower quartile range dropped to zero. The asset allocations of young, married, middle-income women and men were markedly similar, with women displaying a slightly stronger preference for the cash fund and less variability but more outliers, and men showing more values in the lower quartile range but more variability (up to 100%) for the cash fund, and more variability (but fewer outliers) overall. Both groups had a median allocation of 30 per cent for equities and maximum allocations of 70 per cent for women and 90 per cent for men, and outliers of 100 per cent for men and women. In both cases, the range dropped to zero. Interestingly, these results suggest that while women were more risk averse than men (noted above), young, married, working women with pension entitlements chose asset allocation strategies close to those of similar men. These variations in asset allocation strategies by socio-demographic status merit further investigation with a larger sample.
Implications and conclusions
This paper provides a snapshot of the risk propensities of UK occupational pension participants in 2006. It highlights the significance of socio-demographic attributes for understanding individual risk propensities and putative asset allocation. Based on a random survey of the British population, it has been shown that respondents' risk propensities did not vary significantly by either the means of retirement saving or the type of pension plan. The importance of this finding is that DB and DC pension plans have very different distributions of risk. Many pension plan participants do not appear to appreciate their relative insulation from, or their vulnerability to, the risks of different pension plan types. This finding suggests that UK pension plan participants are often ignorant of the basic structure of different types of retirement saving options.
The results also suggest that socio-demographic characteristics produce systematic variations in pension-related risk propensities. They confirm that women are generally more risk averse than men, while suggesting that older people are less risk averse than middle-aged people (cf. Legros Reference Legros, Clark, Munnell and Orszag2006). Second, although the results do not suggest that marital status alone is a significant characteristic in discriminating between those with more or less risk tolerance, the existence of a spousal pension entitlement did have a statistically significant affect on risk tolerance. By this logic, when both partners have a pension entitlement, they appear to pool their financial risks – a household effect, no doubt, and one that mirrors findings from the United States (Friedberg and Webb Reference Friedberg and Webb2006). Thirdly, this effect varies among married people of different ages and income levels, which is evidence of collective retirement planning by households able and willing to do so.
Fourthly, the results point to a degree of social sorting by partner's pension entitlement that is not often acknowledged in the pensions literature. These patterns have a distinct gender dimension, which may have significant implications for some women's long-term retirement welfare. It has been shown that women with a pension entitlement are likely to have spouses with the same, although the reverse only holds true for younger, middle-income men. Furthermore, it is apparent that women who are in jobs that allow them to accrue pension benefits tend to be married to men who also have jobs with pension rights. This finding is in keeping with the literature on the increasing inequality among women as a result, in part, of educated men with high earning potential marrying women with similar characteristics and vice versa (see Costa and Kahn Reference Costa and Kahn1999 and Compton and Pollak Reference Compton and Pollack2004 on ‘power couples’).
We conjecture that women who have pension entitlements tend to select partners who also have pension entitlements, thereby increasing long-term household income while pooling longevity and retirement-income risks. This sorting process by spousal pension entitlement reflects assortative partnering, homogamy and household formation; we do not infer a level of individual foresight and utility maximisation in the choice of partner that is otherwise unlikely in financial decision-making. Nevertheless, the implications of the sorting are clear. Low-income women face the greatest risk of poverty in retirement (see Bellamy and Rake Reference Bellamy and Rake2005; Ginn and Arber Reference Ginn and Arber2001) and are the only group for whom a spousal pension entitlement does not produce a negative marginal probability of risk aversion. This kind of sorting has the potential to exacerbate the growing UK income gap among women as regards their partners' short-term and long-term potential incomes (see generally McDowell Reference McDowell2004).
Given the small sample, we should not exaggerate the scope of the findings, but nonetheless if these results were carried over to the UK population, three implications for the design and implementation of supplementary pensions should be considered. The first follows from the fact that the respondents did not appear to distinguish their risk propensities by the means of retirement savings and the type of pension plan: on this most basic issue, plan sponsors should improve their education and information programmes. If important for those already enrolled in a pension of a certain type, it is crucial that plan participants are able to distinguish between plan types when confronted with the choice of continuing with an employer-plan or opting-out, or when being offered a DB as opposed to a DC pension. Given that DB pension plans are closing and employers seek to redistribute the risks associated with offering pension benefits, confusion on these two counts could significantly disadvantage many people. Herein would be the value of information and education programmes that recognise the prevalence of such confusion and deliberately seek to foster informed decision-making (see Cutler Reference Cutler1997).
A second implication is that the design of education and information programmes may benefit from a greater appreciation of the socio-demographic characteristics of those involved. Many programmes treat plan participants as individual decision-makers with idiosyncratic preferences and interests – and are blind to the roles of gender, age, income and household status in affecting risk-related attitudes and behaviour. Most importantly, to the extent that these characteristics systematically influence the risk propensities of particular groups of the population, there may be a role for targeted education and information programmes. The third implication is that current pension education and information programmes may be of little relevance to those in households with two or more pension contributors. Similarly, education and information programmes that treat participants as if socio-demographic and spousal pension entitlements were irrelevant run the risk of neglecting the plight of those with the biggest stake in planning for an adequate retirement income, namely low-income women, and of being inappropriate to the more sophisticated household retirement income strategies of higher income men and women.
Finally, our results have relevance for the current UK debate over the shape and structure of the proposed National Pension Saving Scheme (NPSS). Recognising the decline in private-sector occupation pensions and the low savings rate, especially amongst low-income workers, the Pensions Commission (2005) recommended the establishment of such a scheme. Even if not compulsory, the Commission suggested that an automatic enrolment scheme that relied upon the double-default predilections of many people – an unwillingness to exercise their opt-out options and an unwillingness actively to invest – could significantly increase private retirement savings and improve equity. Many aspects of such a plan have to be determined, not least how and when it would be implemented, but given our respondents' lack of appreciation of the risks associated with competing sources of retirement income and types of pension plans, there are persuasive reasons for supporting Thaler and Sunstein's (Reference Thaler and Sunstein2003) call for ‘libertarian paternalism’.Footnote 16 At the same time, the proposed NPSS would allow for plan participants' to exercise their risk preferences through investment. As in DC schemes, presumably the NPSS would rely upon the individual to make decisions (ignoring household structure) and that would be neutral with regard to socio-demographic characteristics (including gender and age), and that would provide a low-risk default investment option for those unable or unwilling to make risk-related decisions (in recognition of the high risk aversion of low-income women). Just as private DC schemes may need to relate their education and information programmes to the socio-demographic attributes of participants, so too the NPSS may have to take greater responsibility for the prospective welfare for those groups most reliant on the NPSS for supplementary savings. By this assessment, ‘libertarian paternalism’ may be a recipe for accentuating long-term income inequality.
Acknowledgements
Support for the preparation of this paper was provided by the UK Economic and Social Research Council through their CASE PhD studentship in association with Mercer Human Resources Consulting. The authors express their gratitude to Divyesh Hindocha for Mercer's commitment to the project and to Roberto Duran-Fernandez for his statistical advice. Versions of the paper were presented at annual conferences of the Royal Geographical Society (London 2006 and 2007). Comments on this paper were received from Adam Dixon, Courtney Monk, Linda McDowell and an anonymous referee. None of the above should be held responsible for any errors or omissions.