





Crossref Citations

This article has been cited by the following publications. This list is generated based on data provided by Crossref.
Gomes, Marcio de Lucas
and
Aquino, Jakson Alves de
2018.
Violência e satisfação com a democracia no Brasil.
Opinião Pública,
Vol. 24,
Issue. 1,
p.
209.
Ruck, Damian J.
Matthews, Luke J.
Kyritsis, Thanos
Atkinson, Quentin D.
and
Bentley, R. Alexander
2019.
The cultural foundations of modern democracies.
Nature Human Behaviour,
Vol. 4,
Issue. 3,
p.
265.
Coppedge, Michael
Gerring, John
Glynn, Adam
Knutsen, Carl Henrik
Lindberg, Staffan I.
Pemstein, Daniel
Seim, Brigitte
Skaaning, Svend-Erik
Teorell, Jan
Altman, David
Bernhard, Michael
Bizzarro, Fernando
Krusell, Joshua
Maguire, Matthew
Marquardt, Kyle
McCann, Kelly
Mechkova, Valeriya
Miri, Farhad
Pernes, Josefine
Staton, Jeffrey
Stepanova, Natalia
Tzelgov, Eitan
and
Wang, Yi-ting
2020.
Varieties of Democracy.
Barceló, Joan
2020.
Are Western-Educated Leaders Less Prone to Initiate Militarized Disputes?.
British Journal of Political Science,
Vol. 50,
Issue. 2,
p.
535.
Lima, Marcus E. O.
de França, Dalila X.
Jetten, Jolanda
Pereira, Cícero R.
Wohl, Michael J. A.
Jasinskaja-Lahti, Inga
Hong, Ying-yi
Torres, Ana Raquel
Costa-Lopes, Rui
Ariyanto, Amarina
Autin, Frédérique
Ayub, Nadia
Badea, Constantina
Besta, Tomasz
Butera, Fabrizio
Fantini-Hauwel, Carole
Finchilescu, Gillian
Gaertner, Lowell
Gollwitzer, Mario
Gómez, Ángel
González, Roberto
Jensen, Dorthe Høj
Karasawa, Minoru
Kessler, Thomas
Klein, Olivier
Megevand, Laura
Morton, Thomas
Paladino, Maria Paola
Polya, Tibor
Renvik, Tuuli Anna
Ruza, Aleksejs
Shahrazad, Wan
Shama, Sushama
Smith, Heather J.
Teymoori, Ali
and
van der Bles, Anne Marthe
2021.
Materialist and post-materialist concerns and the wish for a strong leader in 27 countries.
Journal of Social and Political Psychology,
Vol. 9,
Issue. 1,
p.
207.
KURYLO, I. O.
2021.
Emancipative Values and Reproductive Behavior in the Context of Demographic Modernization (Based on World Values Survey (2017—2020) Data).
Demography and social economy,
p.
37.
Struwig, Jarè
Roberts, Benjamin J.
and
Gordon, Steven L.
2021.
‘Dark Cloud with a Silver Lining’? The Prospect of a Rise in Material Values or a Post-Material Turn in Post-Pandemic South Africa.
International Journal of Sociology,
Vol. 51,
Issue. 1,
p.
48.
Brunkert, Lennart J.
2022.
Overselling democracy–claiming legitimacy? The link between democratic pretention, notions of democracy and citizens' evaluations of regimes' democraticness.
Frontiers in Political Science,
Vol. 4,
Issue. ,
TAI, YUEHONG ‘CASSANDRA’
HU, YUE
and
SOLT, FREDERICK
2024.
Democracy, Public Support, and Measurement Uncertainty.
American Political Science Review,
Vol. 118,
Issue. 1,
p.
512.
Tsai, Ming-Chang
and
Peng, Ssu-Chin
2025.
Postmaterialism, Generational Replacement and Value Change: An Age-Period-Cohort Analysis of the US, Japan, Türkiye and China.
Social Indicators Research,
Vol. 176,
Issue. 1,
p.
173.
Süngü, Tayyar
2025.
Demokrasi ve Demokraside Gerileme Arasındaki İlişkiye Sistemsel Bir Bakış.
Mülkiye Dergisi,
Vol. 49,
Issue. 3,
p.
385.
Liu, Haijiang
Cao, Yong
Wu, Xun
Qiu, Chen
Gu, Jinguang
Liu, Maofu
and
Hershcovich, Daniel
2025.
Towards realistic evaluation of cultural value alignment in large language models: Diversity enhancement for survey response simulation.
Information Processing & Management,
Vol. 62,
Issue. 4,
p.
104099.
In this issue, Dahlum and Knutsen (D&K) claim to disprove the emancipatory theory of democracy proposed by Inglehart and Welzel (I&W).Footnote 1 This theory posits that rising emphasis on universal freedoms, or what I&W call ‘emancipative values’, is a major force driving the emergence and survival of democracy.
To support their claim, D&K impute country scores to emancipative values for years in which real data are absent.Footnote 2 These imputations allow them to produce a time-series cross-sectional (TSCS) database, consisting of some 2,000 country-year observations.Footnote 3 Running panel regressions over these data, D&K find that a population’s emphasis on emancipative values in a given year has no effect on its level of democracy in the next year. D&K believe that this result invalidates I&W’s theory, in which case the values of a population are irrelevant for whether it attains and sustains democracy.
We appreciate this contribution because it provides a welcome opportunity to pinpoint some pitfalls of TSCS frameworks. To do so, we proceed in three steps. First, we describe the problem with TSCS data in conceptual terms; then we illustrate the problem with a simulation; finally we demonstrate what real data say about I&W’s theory. We conclude that the evidence supports the emancipatory theory of democracy as powerfully as it did in I&W’s original analyses.
THE PROBLEM
I&W argue that emancipative values and democratic institutions are linked through a demand-supply relationship with respect to freedoms: democratic institutions constitute the supply of freedoms, while emancipative values represent the demand for them.Footnote 4 The demand-supply linkage suggests a co-evolutionary dynamic between the two variables, but the question is whether supplies change in response to demands or the other way round. A third possibility is that both are driven by something else.
To analyze this problem, one needs to understand the distinction between glacial and disruptive changes – and the fact that any TSCS framework based on years as the temporal unit of observation is inadequate to analyze either type of change.Footnote 5
The rise in emancipative values advances at a glacial pace, involving incremental moves along stable trajectories.Footnote 6 Relative to its accumulated level, change in a glacial variable from one year to the next is always small, sometimes not even recognizable and often within the margin of measurement error. With a glacial change pattern, using country-year observations involves mixing negligible variation in the time dimension (years) with massive variation in the spatial dimension (countries). Doing so bloats the number of cases by admitting a heavy imbalance in variation between space and time. The result is an artificial gain in statistical power. The imbalance is aggravated when the TSCS matrix covers many more countries than years, as is the case with D&K’s data.Footnote 7 Such an imbalance renders the authors’ country-fixed effects models nonsensical: all these models show is the impact of minor annual differences within countries.Footnote 8 Since minor differences are unlikely to show a significant impact, country-fixed effects models increase the chances of rejecting an effect that actually exists.
TSCS frameworks using country-years are inadequate for glacial variables. But another type of variable inflicts equally serious problems on TSCS frameworks, albeit in an opposite way. Our second variable of interest, democratic institutions, is a case in point. As is true for regime characteristics in general, democratic institutions are designed to endure. Because of this intended endurance, regime changes are rare. Some countries have not experienced a regime change since they exist, and even in countries where such changes are relatively frequent, they rarely occur more than once or twice in a lifetime. But when they happen, they rapidly remodel a society’s entire institutional make-up. This is precisely what happens in transitions towards or away from democracy: after decades of stability, countries suddenly experience drastic shifts in their level of democracy.Footnote 9
The disruptive change in democratic institutions contrasts sharply with the glacial change in emancipative values.Footnote 10 Nevertheless, the long-term trend in both variables has been progressive in recent decades, with both emancipative values and democratic institutions becoming more widespread.Footnote 11
How can one make sense of a co-dynamic in which the demand for freedoms moves glacially while the supply moves disruptively? I&W argue that the most plausible way to think of this co-dynamic is a ‘tectonic’ model of incrementally accruing tensions, causing rare eruptive shifts to release them.Footnote 12 This model assumes that glacially accumulating demands for freedoms build up a slowly growing tension with stagnant supplies, until the tension releases in a disruption that swiftly shifts the supplies into equilibrium with the demands.
In I&W’s theory, modernization drives the ‘tectonic’ model. By increasing longevity, education and information, and by improving material conditions, consumer technologies and social connectivity, modernization enhances people’s ‘action resources’. Equipped with more and better action resources, the things that people can pursue at will – both individually and jointly – multiply. As they recognize their enriched options, people ‘naturally’ begin to see value in freedoms, realizing that they need freedoms to use their options as they wish. Thus, demands for freedoms rise as growing action resources elevate people on the ‘utility ladder of freedoms’.Footnote 13 If this happens in regimes that deny freedoms, tension builds up until an event opens an opportunity to voice the increased demands. As Kuran pointed out, autocratic rulers are often surprised by the suddenness and breadth of the people’s voice.Footnote 14 If the voice swells wide enough, regime alliances implode and the emerging opposition enforces a regime change through which freedoms rise to match demand. Freedom Rising presents ample evidence of this logic.Footnote 15
The same demand-supply logic can, unfortunately, operate in the opposite direction: when mass demands for freedoms are far below supplies, authoritarian-minded rulers meet little resistance when imposing restrictions on freedoms.Footnote 16 Russia, Romania, Hungary and Turkey are cases in point.
D&K’s panel regressions do not test the tectonic model.Footnote 17 Instead, their regressions assume that the underlying process is one of repeated reoccurrence in a series of equally thin-cut slices: demand in one year is supposed to have an equal effect on supply in the following year, for every pair of years in the time series.Footnote 18 If, however, supply moves in infrequent but massive shifts, even a powerful effect of demand remains undetected.
A SIMULATION
To illustrate this point, we simulate a reality in a typical TSCS framework. It matches thirty-six hypothetical countries and twenty years, generating 780 country-year observations. We create this virtual reality as follows:
(1) In year 1, both democratic demands and supplies exist at low, medium and high levels, so that all combinations between the two are present.
(2) From years 1 to 20, demands change in incremental moves on stable country trajectories, mostly on increasing slopes but sometimes also declining.
(3) Demands follow similar trajectories in economic development, lagged by one year.
(4) Supplies do not change until year 15, but from years 15 to 16, sudden shifts occur in some countries, albeit not in others, and in opposite directions and to different extents.
(5) These shifts move supply levels exactly to where the demands were in the year before the shifts.
(6) From years 16 to 20, supplies are stable again.
(7) From years 1 to 15, supply shifts in countries with incongruent demands are blocked by an international constellation that shields incongruent regimes from domestic pressures – like the situation that existed during the Cold War. In year 15 this constellation dissolves. We represent this condition by a dummy variable called switch, which we code 1 for year 15 and 0 otherwise.
These rules are simulated in such a way that they apply in perfection: our virtual reality conforms entirely to the tectonic model.
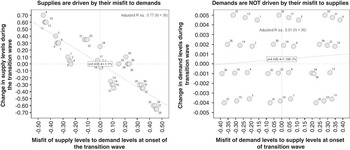
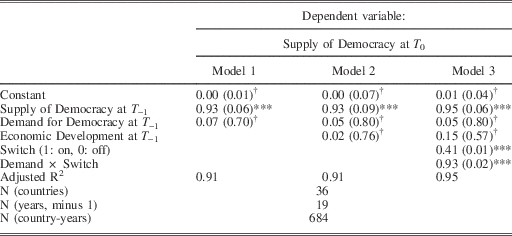
Would a conventional panel regression grasp this reality? The answer is a resounding ‘no’: already the most basic panel regression fails to uncover an effect of demand on supply. Specifically, regressing supplies in each year on their levels in the previous year and on demands in the previous year, Model 1 in Table 1 shows that demand has a completely insignificant effect on supply. Model 2 adds the lagged level of economic development as an additional control and repeats the result. Confirming D&K, this model suggests that democratic demands are irrelevant to supplies – despite the fact that the data have been constructed to represent the exact opposite reality, as the left-hand diagram in Figure 1 illustrates.
Simulated relationship between mass demands for democracy and elite supplies of it. Demand levels: mass demands for democratic freedoms in hypothetical countries before and after a hypothetical wave of regime transitions. Supply levels: institutional supplies of democratic freedoms in hypothetical countries before and after a hypothetical wave of regime transitions. Horizontal axis (left-hand diagram): misfit scores grow negative as supply levels before the wave fall short of where the demand levels at that time suggested they would be; they grow positive as supply levels before the wave surpass where demand levels at that time suggested they would be. Misfit scores center around 0 as supply levels approximate where demand levels suggested they would be. Misfit scores are obtained from regressing the supply levels before the wave on the demand levels at that time, and saving the residuals. Vertical axis (left-hand diagram): change scores grow negative as supply levels dropped from before the wave to after; change scores grow positive as supply levels jumped from before the wave to after. Change scores approximate 0 as supply levels remained stable. Horizontal axis (right-hand diagram): misfit scores grow negative as demand levels before the wave fall short of where the supply levels at that time suggested they would be; they grow positive as demand levels before the wave surpass where supply levels at that time suggested they would be. Misfit scores center around 0 as demand levels approximate where supply levels suggested they would be. Misfit scores are obtained from regressing the demand levels before the wave on the supply levels at that time, and saving the residuals. Vertical axis (right-hand diagram): change scores grow negative as demand levels fell from before the wave to after; they grow positive as demand levels rose from before the wave to after. Change scores approximate 0 as demand levels remained stable.
The Incapacity of TSCS Panel Regression to Grasp a Temporally Pointed Effect
Note: source of observations is a simulated dataset, as described in the online appendix. Entries are unstandardized coefficients with their standard errors in parentheses. Significance levels indicated at the 10-, 5- and 1-% level: †, *, **, ***. Results are obtained from running panel-corrected standard errors in STATA.
Panel regressions using country-year observations are prone to such errors.Footnote 19 I&W explicitly rejected a TSCS framework for this reason.Footnote 20 Instead, they tested the tectonic model for what it says: the direction and extent of regime transitions are a function of the misfit of the supply of freedoms to the demand for them present when these transitions occur.Footnote 21 This general proposition has three specific implications:
(1) When the supply of freedoms undercuts the demand, the direction of an occurring transition is towards democracy, elevating the supply to the extent to which it had previously undercut the demand.
(2) When the supply of freedoms surpasses the demand, the direction of an occurring transition is away from democracy, lowering the supply to the extent to which it had previously surpassed the demand.
(3) When the supply of freedoms is congruent with the demand, no transition occurs; we observe regime stability.
Arguably, this is the only theory that offers an explanation of both the direction and the extent of regime transitions and at the same time incorporates the possibility of regime stability – the case when the extent of the transition is 0. Explicitly, this theory operates under conditions involving international and domestic alliances.Footnote 22 Regime transitions only happen (1) when international alliances cease to shield given regimes from internal pressures and (2) when domestic alliances emerge that mobilize such internal pressures. Hence, democratic demands always affect transitions in the presence of these alliance conditions. This means that alliance conditions and mass preferences explain two distinct aspects of regime change: alliance conditions explain when regime change happens; mass preferences explain in which direction and how far it goes.Footnote 23
THE EVIDENCE
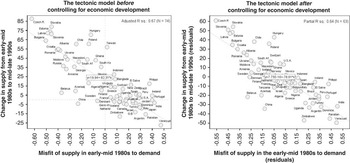
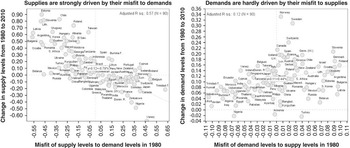
Confirming the tectonic model, I&W demonstrated that the misfit of democratic supplies to democratic demands, present at the time when a ‘wave’ of transitions occurs, explains these transitions’ direction and extent, including the many cases for which the extent is 0 (regime stability).Footnote 24 Figure 2 replicates the evidence with Welzel’s data on a broader country base.Footnote 25 Figure 3 shows an update of this pattern that extends the evidence over thirty years, including all countries ever surveyed by the World Values Surveys, based on plausible estimates of emancipative values for 1980 and 2010.Footnote 26
Real relationship between mass demands for democracy and elite supplies of it (Wetzel’s original data). Demand levels: Welzel’s (Reference Welzel2007) index of emancipative values (minimum 0, maximum 1), measured at earliest available time from the late 1980s till mid 1990s. Supply levels: Welzel’s (Reference Welzel2007) democracy index, combining Freedom House, Polity IV, Vanhanen and CIRI (minimum 0, maximum 100), measured 1981–85 and 1995–99. Horizontal axis (left-hand diagram): misfit scores grow negative as supply levels in the early to mid-1980s fall short of where the demand levels suggested they would be; they grow positive as these supply levels surpassed where demand levels suggested they would be. Misfit scores center around 0 as supply levels approximate where demand levels suggested they would be. Misfit scores are obtained by regressing the supply levels in the early to mid-1980s on the demand levels, and saving the residuals. Vertical axis (left-hand diagram): change scores grow negative as supply levels dropped from the early to mid-1980s to the mid to late 1990s; they grow positive as supply levels jumped from the early to mid-1980s to the mid to late 1990s. Change scores approximate 0 as supply levels remained stable. Right-hand diagram: same relationship as on the left, but controlling for economic development, using a combined measure of per capita income and Vanhanen’s ‘power resources’ from the late 1980s, as documented in Welzel (Reference Welzel2007).
Real relationship between mass demands for democracy and elite supplies of it (extended country selection). Demand levels: Welzel’s (Reference Welzel2013) index of emancipative values (minimum 0, maximum 1), estimated for 1980 and 2010 using longitudinal regression on the basis of the closest observed data to these years. Supply levels: Welzel’s (Reference Welzel2013) citizen rights index (minimum 0, maximum 1), combining Freedom House and CIRI data in 1980 and 2010 – the latest and earliest available time points on the citizen rights index. Horizontal axis (left-hand diagram): misfit scores grow negative as supply levels in 1980 fall short of where the demand levels in 1980 suggested they would be; they grow positive as supply levels in 1980 surpass where demand levels in 1980 suggested they would be. Misfit scores center around 0 as supply levels approximate where demand levels suggested they would be. Misfit scores are obtained from regressing the supply levels in 1980 on the demand levels in1980, and saving the residuals. Vertical axis (left-hand diagram): change scores grow negative as supply levels dropped from 1980 to 2010; they grow positive as supply levels jumped from 1980 to 2010. Change scores approximate 0 as supply levels remained stable. Horizontal axis (right-hand diagram): misfit scores grow negative as demand levels in 1980 fall short of where the supply levels in 1980 suggested they would be; they grow positive as demand levels in 1980 surpass where supply levels in 1980 suggested they would be. Misfit scores center around 0 as demand levels approximate where supply levels suggested they would be. Misfit scores are obtained from regressing the demand levels in 1980 on the supply levels in 1980, and saving the residuals. Vertical axis (right-hand diagram): change scores grow negative as demand levels fell from 1980 to 2010; they grow positive as demand levels rose from 1980 to 2010. Change scores approximate 0 as demand levels remained stable.
D&K’s findings, and those of similar critics,Footnote 27 are irrelevant to the evidence in Figures 2 and 3.Footnote 28 Besides, the claim that mass preferences do not matter for the fate of political regimes contradicts democratic theory. Key thinkers such as Dahl, Lipset, Easton, Eckstein, Almond and Verba understood that popular support vs. opposition is critical for regime survival vs. termination, and that mass preferences are a selective force in regime evolution for this reason.Footnote 29 In this line of thinking, I&W’s approach is unique because it is the only one that actually measures mass preferences. The key conclusion remains: rising emancipative values shift the selective pressures in the evolution of regimes towards democracy.Footnote 30 Four complementary findings in Freedom Rising underline this conclusion:
(1) The more strongly people emphasize emancipative values, the more their life satisfaction depends on perceived freedom of choice. Hence, emancipative values generate an intrinsic motivation to acquire and defend freedoms.Footnote 31
(2) Because of this, emancipative values motivate non-violent social movement activity. This value–action link exists regardless of the level of democracy, and it is not disrupted by state repression.Footnote 32
(3) Most people say they desire democracy but, in the absence of emancipative values, they fill the word democracy with various meanings, some of which flatly contradict the concept. In contrast, when coupled with emancipative values, people’s notions of democracy become unequivocally focused on the freedoms that define it. This ‘enlightenment’ effect operates irrespectively of whether a country has a long, short or no democratic tradition.Footnote 33
(4) In disjunction from emancipative values, people’s overt support for democracy has no explanatory power over the countries’ actual levels of democracy; yet in connection with emancipative values, overt democratic support has great explanatory power. Thus one needs to qualify overt democratic support for its rootedness in emancipative values in order to identify the ‘true’ demand for democracy.Footnote 34
What about D&K’s claim that emancipative values are ‘endogenous’ to democracy?Footnote 35 This implies that people only learn values that their society’s institutions teach, so people would never learn emancipative values in non-democracies. Evidence from the World Values Surveys suggests a different logic of how emancipative values emerge: people value freedoms when many of them possess the action resources that allow them to use freedoms purposefully, whether the regime supplies them or not. Action resources – which include time, money, skills and technologies – grow for large population segments as a result of economic development. And development is not the exclusive property of democracies; it can also occur in non-democracies. Thus emancipative values also rise under absent democracy, if economic development expands people’s action resources. Indeed, the abundance of action resources in a society explains more than 70 per cent of the cross-national variance in emancipative values.Footnote 36 Moreover, when one uses country-cohort observations, one sees that people’s economic upbringing shapes their emancipative values far more strongly than does their democratic socialization.Footnote 37
Unaware of this evidence, D&K suggest the ‘democracy stock index’ to measure democratic socialization, expecting a powerful impact on emancipative values. Its impact is indeed significant – until one controls for action resources.Footnote 38 When one does so, democracy stock shows no effect on emancipative values, as Figure 4 illustrates. In conclusion, the human desire for freedoms grows wherever expanding action resources elevate populations on the ‘utility ladder of freedoms’.
The emancipatory effects of action resources and democracy stock mutually controlled. Note: partial regression plots obtained from regressing Welzel’s (Reference Welzel2013) emancipative values at the latest observation year per country on Vanhanen’s measure of ‘power resources’ for the mid-1990s and Gerring et al.’s (2005) ‘democracy stock’ index for 1900–95.
India and China provide a striking illustration. If democratic socialization explained emancipative values, India’s sixty years of experience with democracy should have given rise to a high level of emancipative values. By contrast, the absence of democracy in China should suppress these values entirely. If, however, economic conditions explain emancipative values, the fact that both countries are still relatively poor suggests that neither of them should have a high level of emancipative values. If anything, China’s higher income level compared to India suggests a somewhat higher level of emancipative values in China. And its steeper growth path suggests larger generational differences in China. Indeed, the Chinese population’s emancipative value in 2012 scored 0.37 (compared to 0.32 for India); generational differences in emancipative values in China amount to 0.06 scale points, compared to 0 for India. These figures are incompatible with the idea that emancipative values grow through democratic learning. Again, they suggest that emancipative values evolve in response to improving existential conditions.Footnote 39
CONCLUSION
D&K’s analysis poses no challenge to the emancipatory theory of democracy.Footnote 40 It is nevertheless an important contribution because it illuminates the circumstances under which TSCS models produce erroneous results. If a 1 per cent increase in a society’s demand for democracy each year were followed by a 1 per cent increase in its supply the following year, TSCS would be appropriate. But authoritarian elites are not responsive to mass demands in this fashion – until slowly built-up pressure suddenly explodes and initiates a regime change. TSCS is inherently unable to model this type of process, as our simulation demonstrated.Footnote 41
Supplementary Material
For supplementary material/s referred to in this article, please visit http://dx.doi.org/doi:10.1017/S0007123415000605