INTRODUCTION
Pathogens can cause considerable mortality and morbidity in host populations; thus they exert strong selective forces and have the potential to drive the evolution of many host traits. The assumption that genetic variation exists for parasite susceptibility underpins a wide body of theoretical evolutionary biology. For example, immune variation is central to some theories of the evolution of sexual selection by female choice (Hamilton and Zuk, 1982) and may facilitate a selective climate favouring sexual reproduction (Hamilton, 1980).
Invertebrates possess a potent innate immune system. It functions via an integrated response of both humoral and cellular components, tailored to combat specific pathogen classes (Lemaitre, Reichhart and Hoffmann, 1997; Leclerc and Reichhart, 2004). Immune challenge can elicit the production of a variety of antimicrobial peptides, both systemically and locally at the infection site (Ferrandon et al. 1998). Additional humoral responses include the melanization of foreign objects, wound healing and coagulation (Soderhall and Cerenius, 1998). The cellular immune system comprises the phagocytosis of microbes and cellular encapsulation of larger foreign material (Meister and Lagueux, 2003).
Drosophila melanogaster is the principal model system for study of the invertebrate immune system and has yielded detailed insight into its molecular machinery and genetic basis (see Hoffmann, 2003 for review). Considerable variation exists within D. melanogaster populations for susceptibility to infection by viruses, parasitoid wasps and bacteria (Brun and Plus, 1980; Kraaijeveld and Godfray, 1997; Lazzaro, Sceurman and Clark, 2004). Furthermore, with respect to viruses and parasitoids, different populations have diverged in their susceptibility to infection, suggesting that the immune system has adapted to local conditions (Kraaijeveld and van Alphen, 1995; Thomas-Orillard, Jeune and Cusset, 1995; Fleuriet, 1996; Dupas, Carton and Poirie, 2003). Study of other invertebrates has revealed similar trends, with genetic variation demonstrated for bacterial resistance in Daphnia magna, parasitoid wasp and fungal susceptibility in the aphid Acyrthosiphon pisum, and refractoriness to Plasmodium transmission in Anopheles mosquitoes (Collins et al. 1986; Ebert, Zschokke-Rohringer and Carius, 1998; Ferrari et al. 2001). In two instances, the genetic basis of variation within D. melanogaster populations has been identified. Resistance to bacterial replication varied between genotypes within a population and was closely associated with sequence polymorphism in a variety of immune system-related genes (Lazzaro et al. 2004). In contrast, resistance to the sigma virus is controlled by only a small number of genes, one of which has been cloned (Brun and Plus, 1980; Contamine, Petitjean and Ashburner, 1989).
Investigations of between-population variation allow study of the genetics and evolutionary processes underlying divergence. Drosophila melanogaster provides a useful model for this purpose because of its relatively recent range expansion from ancestral African populations, often into very different environments (David and Capy, 1988). These colonization events have resulted in reduced genetic diversity (Kauer et al. 2002), and in evolutionary change to a variety of traits of which some now exhibit clinal variation (Capy, Pla and David, 1993; James, Azevedo and Partridge, 1995). The impact on the immune system of the selective and demographic processes associated with this out-of-Africa expansion currently remain unaddressed.
To combat the increasing problem of chemical insecticide resistance in disease vectors and agricultural pests, a variety of biological agents has been successfully employed in control strategies. The pathogen Bacillus thuringiensis and its toxins are used widely. However, whilst the evolution of Bt toxin resistance has yet to present major field problems, it is a significant concern, having evolved in two field and several experimental populations (Griffitts and Aroian, 2005). In the case of malaria vectors, increasing insecticide resistance has spurred recent interest in the use of pathogenic fungi, such as Beauveria and Metarhizium, for mosquito control (Blanford et al. 2005; Scholte et al. 2004, 2005). The evolution of resistance to these agents has not yet been observed (Blanford et al. 2005). However, it seems timely to assess the level of genetic variation for susceptibility to these pathogens in insects, with reference to possible resistance evolution in target species. We investigated the level of genetic variation for fungal pathogen susceptibility traits in Drosophila, shedding light on the potential for evolutionary change in vector populations.
We employed the entomopathogenic fungus Beauveria bassiana. This fungus has a global distribution and is soil borne. It is a broad generalist, infecting a wide range of insect species (Goettel, 1992) and is therefore unlikely to have co-evolved with Drosophila. Beauveria bassiana is naturally pathogenic to D. melanogaster and initiates infection by penetrating the cuticle. Immune responses induced by fungal pathogens include local upregulation of cuticle antimicrobial peptides, systemic induction of peptide production, melanization, cellular phagocytosis and encapsulation (Gillespie et al. 2000). In turn, B. bassiana can specifically inhibit aspects of the host immune system (Gillespie et al. 2000). By assaying with this entomopathogen we were able to measure overall genetic variation in the whole suite of immune responses that the fly is able to mount. Host defences against pathogens include prevention of infection, resistance to replication and toleration of pathogenic effects. Variation in these traits between hosts will then be manifested as mortality differences following pathogen exposure. Here we refer to the combined effects of these factors as susceptibility.
We assayed multiple Drosophila genotypes from 6 geographical locations, revealing extensive variation in fungal infection susceptibility between genotypes within each population. Furthermore, considerable differentiation existed between populations: mortality was lower in flies from Africa than in those from temperate locations.
MATERIALS AND METHODS
Fly stocks
In order to avoid the effects of inbreeding, we used the F1 progeny from crosses between numerous isofemale D. melanogaster lines. The isofemale lines were derived from females collected between 1998 and 2002 from 4 African and 2 non-African populations (Gabon A (Ntoum, 2002), Gabon B (Franceville, 2002), Kenya (2001), Zimbabwe (2001), Netherlands (2000) and Pennsylvania (1998)). Isofemale lines were paired randomly and 5 virgin females from one line of each pair were crossed to 5 males of the other; 2 replicates of each cross were performed. In total 146 different isofemale lines were used to create 73 independent out-crossed genotypes: 15 from Gabon A, 12 from Gabon B, 12 from Kenya, 9 from Zimbabwe, 11 from the Netherlands and 14 from Pennsylvania. Adults were placed in Drosophila bottles for 4 days: the small number of females employed and short oviposition period ensured low larval densities during offspring development. Rearing and experimental procedures were carried out at 25 °C, 12 h L[ratio ]D in a humidified incubator, using Lewis Drosophila medium (Lewis, 1960).
Preparation of fungal material
To guarantee that the B. bassiana isolate was virulent against Drosophila, it was initially passaged through an out-crossed population of D. yakuba. Flies were sprayed in a mesh cage with a spore/oil formulation (see below), cadavers were collected over the following 10 days and placed in humid Petri dishes to promote sporulation. Sporulating cadavers were allowed to dry, homogenized in oil and plated onto potato dextrose agar containing chloramphenicol antibiotic (5×10⁻⁵ g ml−1). Plates were incubated for 10 days (25 °C, 24 h dark), then dried at room temperature for 5 days. Sporulating fungal material was scraped from all plates and pooled, then dried on silica gel in a fridge and suspended in oil (87·5% Shellsol T, 12·5% Ondina EL). Spore concentration was 2×10⁸ spores ml−1. The formulation was vortexed and agitated briefly using a probe sonicator prior to use. An airbrush was used to spray the oil suspension onto inkjet transparency films, yielding a mean spore density of 5680 spores mm−2. After 2 days, when the lighter Shellsol oil had evaporated, the transparency film was cut into strips, rolled and individual pieces inserted into standard Drosophila vials (n=1120).
Experimental procedure
F1 offspring from the isofemale line crosses were collected from bottles in 3 cohorts at 3-day intervals. These cohorts were exposed to spores on different occasions separated by 3 days, but experimental observation of all vials was otherwise concurrent. Flies were sexed, placed in vials in single sex groups of between 10 and 15 and allowed to mature for 6 days. CO2 anaesthesia during sexing was limited to less than 5 min. Vials were allocated to either fungal or control treatments. Six days after collection, fungal treatment flies were transferred to vials containing spore coated film (see above) and controls to untreated vials; survival times were subsequently recorded relative to this day. Flies were gassed lightly with CO2 during transfers and flies that escaped were recorded. Mortality was assessed daily for 28 days by counting cadavers in each vial. Fungal treatment flies were exposed to spores for 3 days and then transferred to fresh vials. Vial changes continued every 3 days (both sexes) to prevent re-infection from sporulating cadavers. Control flies were transferred to new vials either every 5 days (females) or 12 days (males). Our accuracy rate in accounting for flies during the experiment was over 99·2%.
Control flies were maintained on Lewis medium containing 1·5% (v/v) of the standard Drosophila antifungal agent Nipagen (10% methyl 4-hydroxybenzoate in ethanol) (Lewis, 1960). To prevent any possibility of Nipagen interacting with our comparisons, it was omitted from the medium for fungal treatments. However, on day 16 a microorganism growing on the food in several vials (approx. 5%) caused us to transfer all fungal flies to medium containing Nipagen. This failed to prevent the growth. Therefore, on day 20, flies were transferred to standard medium supplemented with penicillin and streptomycin antibiotics (following Roberts and Standen, 1998). The microbe resembled the commensal bacterial culture contaminant reported by Sultan et al. (2001), although in our case it was antibiotic sensitive. For completeness all data are presented. However, all results trends emerge before day 16 and our statistical analyses remain highly significant even if all the data gathered after day 16 are excluded.
At the end of the experiment (day 30), the infection status of the surviving fungal treated flies was investigated. Vials were randomly selected and 1 fly was removed on each occasion (n=75). Additionally, 5 individuals were taken from each of 9 vials with lowest mortality (below 30%). Fungal treatment flies exhibiting signs of infection that had recently died and unexposed flies from the control treatments were also sampled to act as positive and negative controls for this test. Flies were surface-sterilized in 70% ethanol, washed 3 times in phosphate buffer, then homogenized in 100 μl of Drosophila Ringer's and plated onto potato dextrose agar containing chloramphenicol. Plates were incubated for 5 days and B. bassiana colonies counted.
Statistical analyses
Cumulative proportional mortality was calculated for every fly vial at 5 time-points (days 5, 10, 15, 20 and 25). Data were arcsine square-root transformed to improve their fit to the normal distribution. A mixed linear model was employed to analyse the data set (PROC MIXED, SAS release 8.0, SAS Institute, Inc., NC, USA). Initially, a maximal model was constructed including the fixed-effect terms treatment, population, sex, cohort and their higher level interactions. To investigate within-population variation, genotype was assigned as a random effect and the 2 independent crosses that replicated each genotype were nested within it. Data points were weighted by the number of flies from which mortality proportions were calculated. Non-significant terms were sequentially eliminated to yield minimally significant models. Independent analyses were performed at each of the 5 time-points. Post-hoc tests were used to investigate pairwise differences between population means, corrected for multiple comparisons using the Sidak adjustment. Subsequently, both the fungal and control data sets were analysed independently to verify the origin of mortality variation. Means are reported ± their standard errors.
RESULTS
Mortality data were collected for a total of 29297 flies from 2023 vials (mean flies per vial 14·48): these represented 73 independent out-crossed genotypes from the 6 populations. By day 28, when observations ended, mean mortality across the B. bassiana exposed vials was 87·0%±0·57 (n=1120), whereas that of control vials was 4·2%±0·66 (n=903). No difference in mortality existed between fungal and control treatments at day 5 (P>0·05); however, treatment significantly elevated mortality from day 10 onwards (P<0·0001), indicating that hosts take several days to succumb to infection.
The 6 populations differed in their ability to resist infection (Fig. 1). From day 15 onwards survival ranged by over 40% between population means. From day 10 there were significant differences between populations in the mortality caused by the fungal treatment (population×treatment interaction: day 10 P<0·01, thereafter P<0·0001). Flies from Pennsylvania and the Netherlands exhibited an earlier onset of mortality and lower overall survival than African flies (Fig. 1). Between-population differences were investigated by separate analysis of only the fungal treatment data. From day 15 onwards, with the exception of the Gabon A – Netherlands comparison at day 15 (P=0·09), all comparisons of means revealed significant pairwise differences between the African and non-African populations (in all tests P<0·03). Mean mortality never differed significantly for pairwise comparisons within the African and non-African groups (in all tests P>0·29).
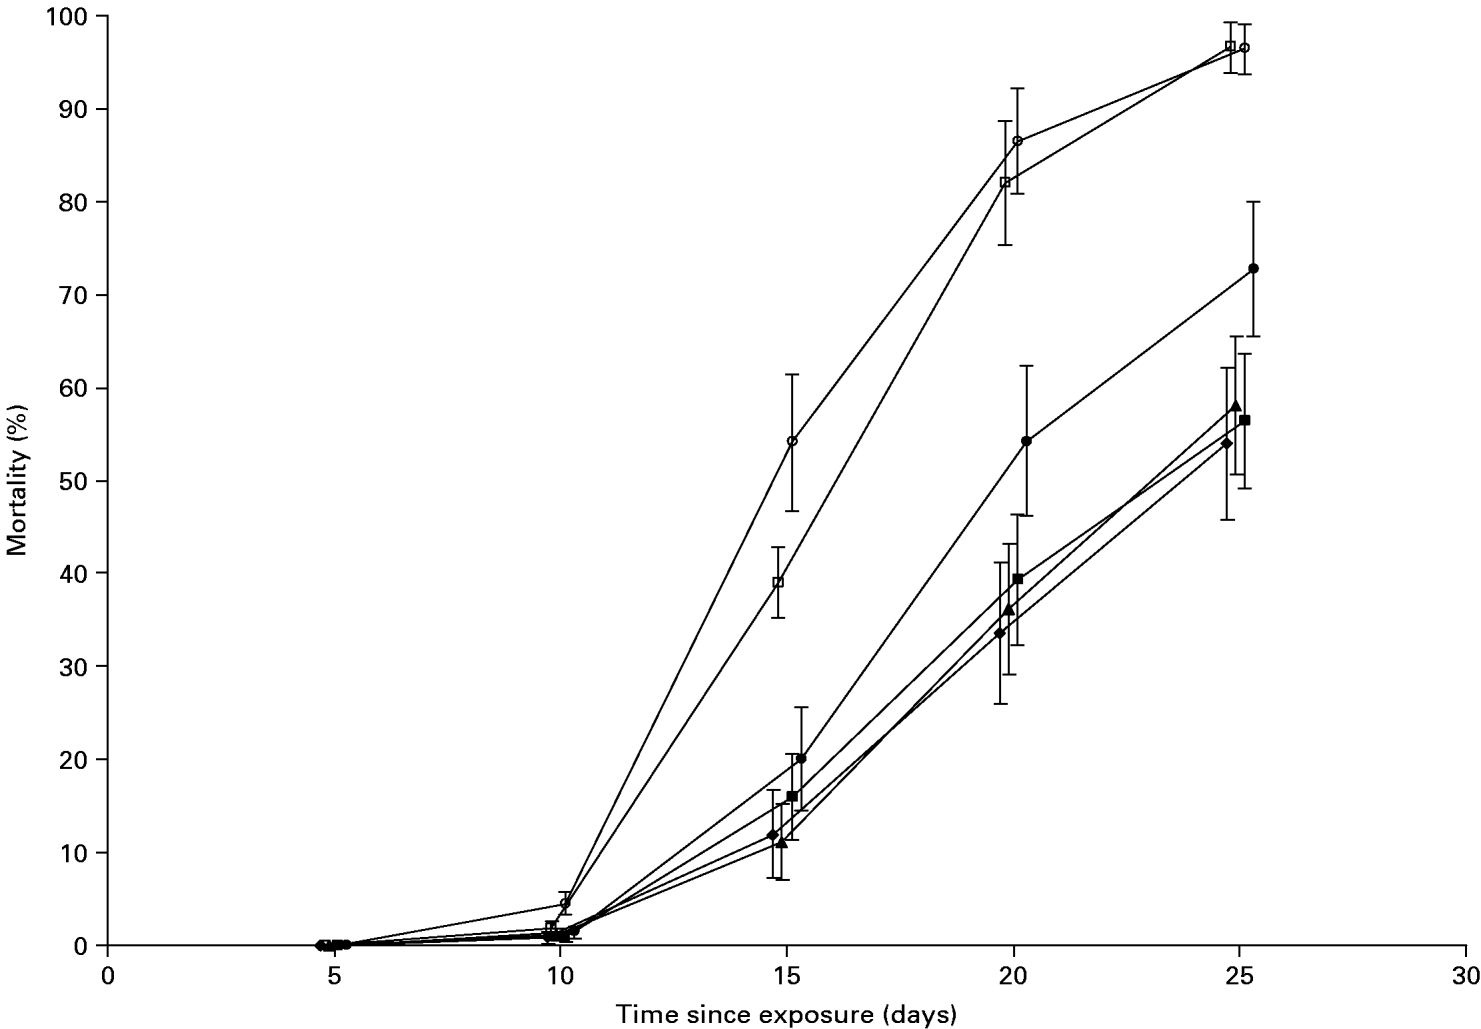
Fig. 1. Mortality of flies from different populations following exposure to Beauveria bassiana spores. African and non-African populations differ significantly (filled and open symbols respectively). Zimbabwe (filled diamonds), Kenya (filled triangles), Gabon A (filled circles), Gabon B (filled squares), Pennsylvania (open circles), Netherlands (open squares). Symbols are offset slightly to allow interpretation of error bars. The graph shows least squares means from mixed models together with standard errors.
The significant interactions between population and treatment originated from differences in the response of populations to infection, rather than longevity variation in the control treatment. Independent analysis of the control data demonstrated minimal intrinsic differences between populations. Only at day 25 was mortality variation significant (P=0·02), when post-hoc comparisons of population means revealed a single significant pair-wise difference (Gabon A – Zimbabwe, P=0·02). The small non-significant differences that did exist placed the longevity of non-African populations above that of African ones: the opposite trend to that displayed by spore-exposed flies.
Very considerable mortality variation also existed between genotypes within each population sample (Fig. 2). On day 15 the range in mean mortality exceeded 37% between genotypes within all populations (minimum range: Gabon A (37·3%), maximum range: Gabon B (60·2%)). Residual variation contributed by the term genotype was significant at all time-points in mixed models (P<0·0001).

Fig. 2. Mortality of different genotypes (males on day 15) belonging to each population after exposure to Beauveria bassiana spores. Variation between genotypes within populations is significant (see text). Genotype means (diamonds) and standard errors (error bars) are derived from raw data rather than being model residuals. Horizontal bars display population means, but are not directly comparable with those in Fig. 1 where means are calculated from the whole data set using mixed models and arc-sine transformation.
Survival differences between the sexes were significant during the latter part of the experiment (days 20 and 25, P<0·03). However, we cannot conclude that this reflects sex-specific immune variation as the higher mortality of diseased females may have resulted from larvae in these vials making the food sticky. The experiment used flies originating from 3 cohorts, which were exposed to B. bassiana on different days. Significant variation existed between cohorts at all time-points (P<0·003) and treatment by cohort interactions occurred on days 20 and 25 (P=0·0002); possibly indicating unidentified treatment differences between exposure days.
At the end of the experiment many of the surviving flies were still infected. The infection status of 120 flies that had survived to day 30 post-exposure was assessed. Beauveria colonies were recovered from 28% of this sample, indicating the presence of an ongoing long-term infection. There was no significant difference between the infection rate of flies chosen at random (24 of 75) and flies chosen from low mortality vials (9 of 45) (Chi-squared test χ2(d.f.=1)=1·47, P>0·2). The accuracy of this assay was verified: all 16 infected flies yielded Beauveria colonies, whereas 22 unexposed flies did not.
DISCUSSION
Here we reveal considerable genetic variation for pathogen susceptibility both within and between D. melanogaster populations. Mortality 15 days after exposure to spores of the entomopathogenic fungus B. bassiana typically ranged by 45% between genotypes within populations, and by over 40% between population means. Nevertheless, this may underestimate the true level of genetic variation segregating in natural populations: our original isofemale lines were probably not fully inbred, thus variation will have existed within as well as between genotypes. The approximately continuous nature of this immune variation suggests that it is a polygenic trait and not controlled by just one gene of major effect. The mortality variation observed may result from variability at any level within Drosophila's multifaceted defence machinery. It could be due to variation in susceptibility to infection, susceptibility to pathogen replication or tolerance of pathogenicity.
Beauveria bassiana and other fungal pathogens are being developed and used as biopesticides for the control of a variety of insect pest and vector species (Lomer et al. 2001; Scholte et al. 2004). They represent novel methods for malaria control by inducing adult vector mortality and manipulating mosquito immune systems (Blanford et al. 2005; Scholte et al. 2005). One proposed advantage of these biological control agents is that unlike many conventional chemical insecticides, it may be difficult for target species to evolve resistance. However, our observations of extensive within-population genetic variation clearly demonstrate the potential for evolution of traits influencing fungal pathogen-induced mortality. Furthermore, the between-population divergence demonstrated here indicates that such evolutionary change has indeed occurred in natural Drosophila populations during the course of adaptation to new habitats. It is unlikely that D. melanogaster represents a special case in this respect and our results may well be general to other insect species, including Anopheles mosquitoes. Our data suggest that ample genetic variation may exist in target populations to permit resistance evolution to fungal biopesticides. Therefore some caution may be needed in their application to control malaria vectors and insect pests.
The strong regional differentiation in D. melanogaster susceptibility is indicative of geographically variable selection pressures driving adaptation of immune traits. The two populations suffering greatest mortality were from temperate sites, whereas tropical African populations displayed higher resistance. Study of further populations will be required to test the robustness of this tropical – temperate split. Whereas our knowledge of the field biology of Drosophila pathogens is limited, general pathogen diversity is highest in tropical regions and declines with increasing latitude (Bush et al. 2001; Guernier, Hochberg and Guegan, 2004). Furthermore, study of contemporary species invasions generally reveals a reduced parasite load in the novel environment (Torchin et al. 2003). Thus, following the expansion of D. melanogaster out of ancestral tropical locations, selection may have favoured reduced investment in immune traits. Alternatively, immune competence in the field may be similar in each location, but immune system evolution may have adapted flies to different environmental conditions such as temperature. Under a common laboratory environment, flies from different populations may then show very divergent susceptibilities to infection (Blanford et al. 2003). Indeed, insect immune defences are highly temperature dependent, but the nature of this dependency varies between pathogens (Fellowes, Kraaijeveld and Godfray, 1999). Such environmental factors may have exerted strong selection pressures on the immune system during the colonization of new habitats. We cannot exclude the possibility that demographic factors associated with the foundation of novel temperate populations may have affected the evolution of immune traits. Nevertheless, we believe a non-adaptive explanation for this divergence based solely on genetic drift is unlikely. The between-population differences we observed are unlikely to have arisen in the laboratory since collection. The isofemale line samples had very similar histories: they were all recently collected over a 4-year period, had been bred under standard culture conditions, and were maintained side-by-side in our laboratory for 2 years prior to this work.
Resistance to pathogens is generally considered to be an important component of fitness, both because pathogens can result in considerable host mortality, and because mounting an immune response can be costly (Kraaijeveld, Ferrari and Godfray, 2002). Therefore, one might expect that alleles conferring the optimal immune phenotype will be fixed within populations. However, we found considerable standing genetic variation for Beauveria susceptibility in all 6 populations studied. Conventional theories of immune system evolution assume that genetic variation is maintained by the negative frequency-dependent nature of coevolution between host and parasite genotypes (Haldane, 1949). Indeed, most previous studies demonstrating immune variation in invertebrates have employed parasites with some degree of specificity, for which at least diffuse co-evolution might be expected (Henter and Via, 1995; Kraaijeveld and Godfray, 1997; Ebert et al. 1998; Fellowes, Kraaijeveld and Godfray, 1998). However, our data suggest that these processes are not required to maintain variation, because B. bassiana is not a specific pathogen of D. melanogaster. A variety of adaptive processes could maintain genetic variation for immunity. Costly trade-offs, together with temporal variation in pathogen frequencies, could prevent genotypes reaching fixation. Also, if environments differ in pathogen type, frequency or virulence, adaptation to local conditions coupled with gene flow between populations might maintain genetic diversity. Alternatively, co-evolution with other specific parasites might maintain genetic variation with pleiotropic influences on Beauveria immune competence.
The genetic and physiological basis of this pathogen susceptibility variation is at present unknown. Lazzaro et al. (2004) demonstrated that variation between genotypes in bacterial resistance was strongly correlated with nucleotide variation in genes already known to underlie Drosophila immunity. Alternatively, differences between genotypes in the current study could be unrelated to genes conventionally associated with the immune system, but reflect variation in traits influencing the resources available to mount an immune response, or to tolerate infection. Whatever their nature, these genetic differences will determine the fitness of individuals following parasite exposure in the field and are clearly directly relevant to host-pathogen evolutionary interactions.
We thank Penny Haddrill for supplying the fly lines and are indebted to Bill Ballard, Sylvain Charlat, Andrew Clark and Andrew Davis for their field collection. Peter Vischer and Ian White gave valuable statistical advice. Kang-Wook Kim assisted the experimental work. This work was funded by The Wellcome Trust.