Introduction
Grasslands cover not only two-thirds of the terrestrial surface but also play a crucial role in global biogeochemical cycles, sequester carbon, produce feed for livestock and provide various ecosystem services. Next to climatic conditions, the productivity of pasture also depends on management and grazing pressure. In order to provide better estimates for the current and future potential of grass for feed use, a combination of approaches is necessary. Here, we contribute by a modelling study that enhances the estimation of potential feed supply of global pastures and related uncertainties in response to differences in grazing pressure. Our results are intended to be used by agro-economical modelling in order to estimate optimal land use patterns that ensure the provision of global food supply of crop and animal products.
Material and methods
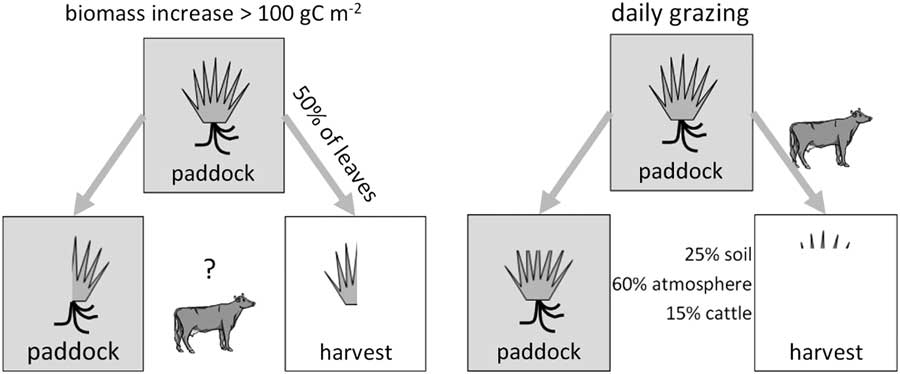
Using the global dynamic vegetation model LPJmL including the agricultural sector (Sitch et al., Reference Sitch, Smith, Prentice, Arneth, Bondeau, Cramer, Kaplan, Levis, Lucht, Sykes, Thonicke and Venevsky2003; Bondeau et al., Reference Bondeau, Smith, Zaehle, Schaphoff, Lucht, Cramer and Gerten2007), plant growth is simulated with the Farquhar approach for photosynthesis depending on the climatic variables temperature, precipitation and solar radiation. The spatial resolution is 0.5°×0.5° and the temporal time step is daily. For managed grassland, different management and grazing options are introduced (Figure 1). These enable locally specific analysis of feedbacks between primary productivity and grass biomass removal by animals at the global scale. Different animal densities are assumed, ranging from 0 to 2 LSU/ha. Varying the density of grazing animals also facilitates finding local optimal densities that enhance primary productivity and grass yield simultaneously. It is expected that low animal densities increase grass productivity whereas high grazing pressure deteriorates the plant’s ability to recover. The global application of this concept gives information on potential grass yields under varying climatic conditions, and potentials for livestock production under sustainable conditions for pasture.
Management options introduced in LPJmL. Left: default option with harvest events depending on the productivity of the grassland. When biomass increase exceeds 100 gC/m2, 50% of grass leaf biomass is removed from the paddock without a defined relation to cattle. Right: Extensive grazing option assumes a certain livestock density (usually 0.5 LSU/ha) grazing daily during the vegetation period. From the removed leaf biomass, 25% is moved to the fast decaying soil pool, 15% to the animals and the rest to the atmosphere.

Results
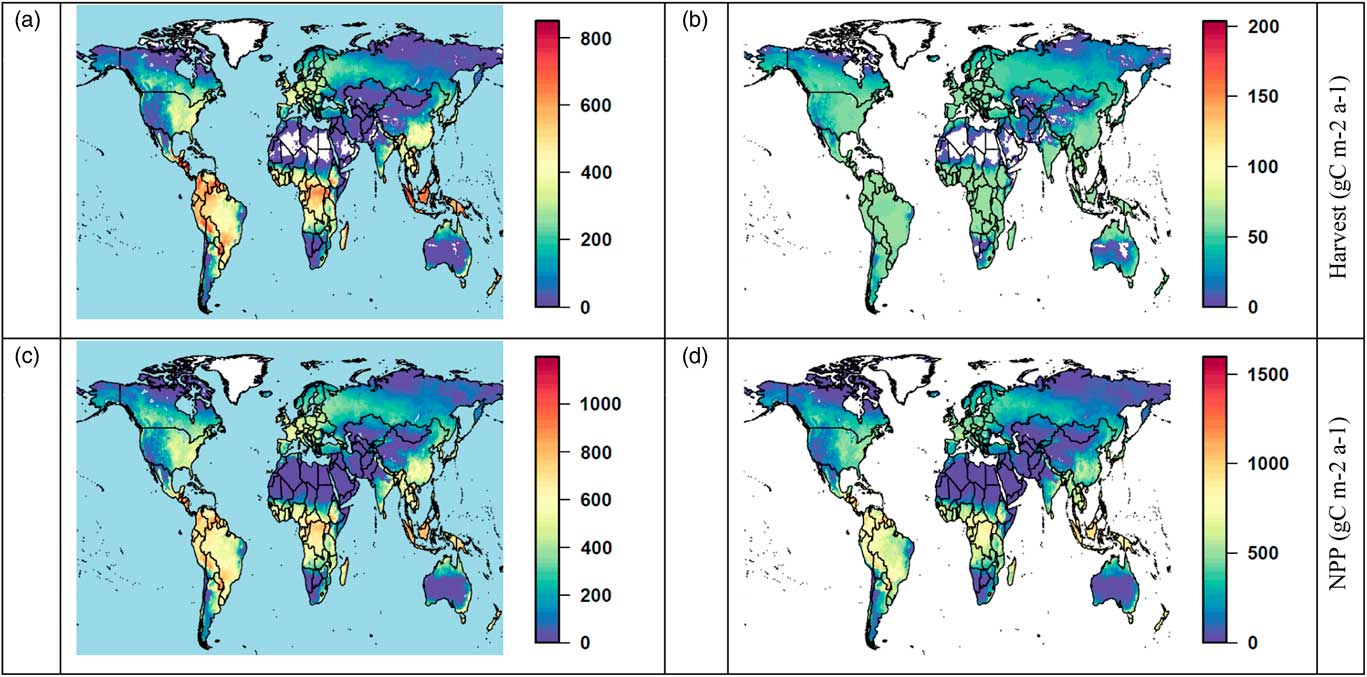
Simulations are based on a global run for natural vegetation for 5000 years in order to establish equilibrium conditions even for regions with permafrost (Schaphoff et al., Reference Schaphoff, Heyder, Ostberg, Gerten, Heinke and Lucht2013). Scenarios on the effects of grassland management assume that the entire terrestrial surface is covered by pasture for 490 years in order to reach an equilibrium of carbon fluxes between soil and biosphere. Results are derived as averages from 1998 to 2002. Using the default version of LPJmL for grassland (Figure 1, left), annual harvest (Figure 2a) is much lower than for the extensive grazing option with a livestock density of 0.6 LSU/ha (Figure 2b), whereas annual net primary production (NPP) is even enhanced under moderate grazing (Figure 2d) compared with the default option with productivity-driven biomass removal (Figure 2c).
Simulated grass harvest (a, b) and net primary production (NPP; c, d) for the default option (a, c) and daily grazing option with 0.6 LSU/ha (b, d).

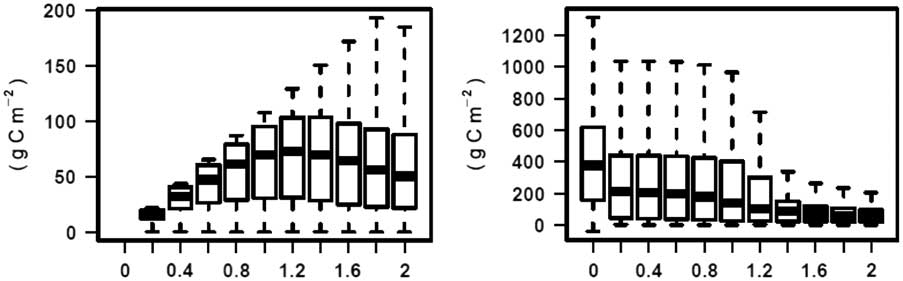
In order to evaluate the effects of different livestock densities on carbon cycling as well as on grass production, densities are varied between 0 and 2 LSU/ha (Figure 3). Low livestock densities result in low harvested biomass and high net primary productivity. On the global scale, highest median values for harvest occur at a livestock density of 1.2 LSU/ha. With even higher densities, harvested biomass is decreasing and NPP declines rapidly.
Simulated grass harvest (left) and net primary production (right) for daily grazing option with 0 to 2 LSU/ha (x-axis). Boxplots give 25 to 72 percentiles (rectangular), median (bold line) and 5 to 95 percentiles (notches).

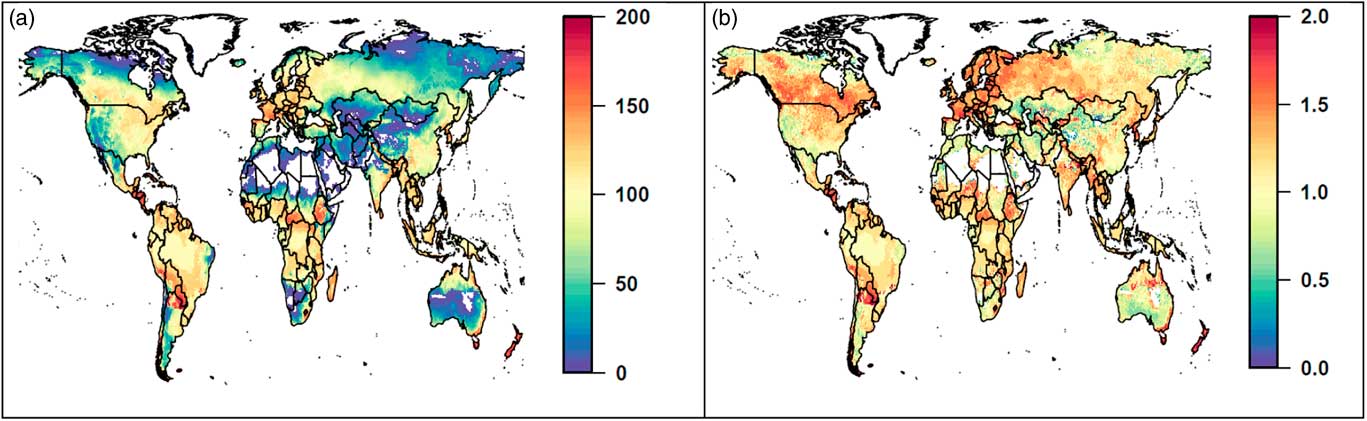
This overall relation of livestock density to harvested biomass holds for most of the simulated grid cells. From the calculated harvest per grid cell, the maximum is determined (Figure 4a) and the respective livestock density at which this maximum yield is achieved (Figure 4b). Thus, in most of the productive regions of the world, about 100 gC/m2 per a is the maximum yield under rainfed and unfertilized conditions. The livestock density that can be sustained under these conditions ranges between 1 and 1.5 LSU/ha for most grid cells, and in 2.6% of the grid cells even >1.5 LSU/ha is possible. Even though, in 15% of grid cells, <1 LSU/ha results in maximum grass yield. In these marginal areas, the average harvest of grass is 25 gC/m2 per a (s.d. 21 gC/m2 per a).
Maximum harvested biomass (gC/m2 per a) under daily grazing option (a) that can be achieved with locally optimal livestock density (LSU/ha) (b).

As these results are preliminary, the following numbers are still subject to validation but give first estimates about potentials for grass feed in the extensive livestock sector. In the unlikely case, the global land surface would be used for grass production, 9.3 Gt C could be produced per year and about 14 000 million LSU could be sustained with this feed. Reducing the area considered in the evaluation to the reported pasture area in 2000 (FAOSTAT), these numbers reduce to 1.75 Gt C for grass production and 2754 LSU for land-based cattle. In relation to reported cattle numbers by Gridded Livestock of the World (GLW), we find that estimated feed potentials of existing pastures allow for maintaining the global cattle population in land-based systems. Summing the cattle in the herds in land-based livestock production systems from GLW results in 131 LSU with a demand for grass feed of 0.21 Gt C. Including also mixed and other livestock production systems in GLW, a total of 670 LSU can be derived with a demand in grass feed of 0.98 Gt C. Thus, cattle could be fed in land-based systems completely when on the currently available pasture area the optimum number of animals were held. Of course, the global balance may not capture local demand for grass harvest because these numbers reflect only global demand.
Conclusions
Assuming best practices for extensive managed grasslands under grazing could yield globally more than enough grass harvest for maintaining the existing dairy cattle. Although local restrictions were not considered for this first assessment, this could easily be incorporated. Incorporating daily grazing into the global dynamic vegetation and crop model LPJmL and simulating scenarios with varying livestock densities enables the assessment of grass yield that is possible under the current climatic conditions. Being based on biophysical processes, this approach can be used for assessing the impacts under changing climatic conditions as well.
Acknowledgements
Research performed within ‘FACCE MACSUR – Modelling European Agriculture with Climate Change for Food Security, a FACCE-JPI knowledge hub’.
Further information
The LiveM International Livestock Modelling and Research Colloquium was hosted by the Basque Centre for Climate Change (BC3) at the Maritime Museum in Bilbao, Spain between 14 and 16 October 2014. LiveM is the livestock and grassland modelling theme of the EU knowledge hub Modelling European Agriculture with Climate Change for Food Security (MACSUR). The MACSUR project is a pilot knowledge hub started by FACCE-JPI in 2012. It provides an opportunity to explore the role and potential of multi-disciplinary networking structures to address complex regional and global issues. More information on MACSUR and the LiveM theme can be found at www.macsur.eu, with PDFs of slides from conference presentations available through the conference website (http://www.livem2014bilbao.com/).