Introduction
The most widely used piezoelectric material since the 1960s is ferroelectric lead zirconate titanate [Pb(Zr1-xTix)O3 or PZT]. Its success is associated with the morphotropic phase boundary (MPB) between rhombohedral (Zr-rich) and tetragonal (Ti-rich) compositions (near x = 0.52), where dielectric and piezoelectric properties exhibit extrema.Reference Jaffe, Cook and Jaffe1 A MPB is ideally a vertical line in the temperature-composition phase diagram, assuring temperature stability of the properties. The PZT solid solution is also attractive because its properties can be easily tuned for different applications by minor chemical modifications.Reference Jaffe, Cook and Jaffe1 For example, so-called “soft” variants (donor doped; exhibiting low coercive field and mechanical quality factor and large piezoelectric coefficients and permittivity) of PZT generate large strain that is of interest for actuators, while “hard” PZT (acceptor doped; exhibiting high coercive field and mechanical quality factor and low piezoelectric coefficients and permittivity) is used in high-power ultrasonic transducers. Employing the same family of piezoelectric ceramics for a variety of devices reduces manufacturing costs and enables end users to work with essentially similar materials regardless of application.
Most attempts to discover a lead-free replacement for PZT have concentrated on finding solid solutions with phase diagrams similar to that of PZT. This search has so far been only partially successful. The lead-free families of piezoelectric materials developed thus far are promising only for a narrow range of applications and do not show the universality and adaptability of PZT. To understand this, it is critical to consider the origins of electromechanical coupling in ferroelectric materials.
It is useful to start by looking at the thermodynamic definition of the piezoelectric effect. The piezoelectric charge (or strain) coefficient, d, may be defined as the derivative of dielectric displacement, D, with respect to stress σ, d ijk = ∂D i/∂σjk, or as the derivative of strain, S, with respect to the electric field, E, d ijk = ∂S jk/∂E i, where the letter subscripts denote tensor components.Reference Newnham2 In ferroelectric materials that possess both spontaneous polarization and strain, large piezoelectric coefficients are expected in the vicinity of polymorphic (temperature driven) and MPB (composition driven) phase transitions between two phases having spontaneous polarization (strain) that differ in direction or magnitude.Reference Budimir, Damjanovic and Setter3 If the energies of the two phases are similar, the polarization (strain) can be readily changed by the stress (electric field) leading to a large piezoelectric response. This is the main “intrinsic” or lattice mechanism for the enhanced piezoelectricity at the MPB in PZT and at polymorphic phase transitions in BaTiO3.Reference Budimir, Damjanovic and Setter3 In lead-free solid solutions, such as (K, Li, Na)(Nb, Ta)O3Reference Klein, Hollenstein, Damjanovic, Trodahl, Setter and Kuball4,Reference Saito, Takao, Tani, Nonoyama, Takatori, Homma, Nagaya and Nakamura5 and (Ba, Ca)(Zr, Ti)O3,Reference Liu and Ren6 the polymorphic phase boundaries (PPBs) separating adjacent phases are not vertical in the temperature-composition phase diagram, so the transitions between phases exhibit both morphotropic and polymorphic characters. A large electromechanical response (though not necessarily piezoelectric) can be achieved in some materials at electric-field induced phase transitions, where the cell dimensions of the two phases are significantly different.Reference Berlincourt7
Another contribution to the piezoelectric effect in ferroelectrics is related to the presence of domains. These are regions wherein the orientations of the polarization vector and the spontaneous strain tensor are uniform. The domains are separated by domain walls, within which polarization and strain change direction upon passing to an adjacent domain having different orientations of the polarization vector and spontaneous strain. When external fields are applied, the domain walls move to minimize the energy of the unfavorably oriented domains, thus contributing to the field-induced changes in polarization and strain. This so-called extrinsic mechanism can be controlled by introducing point defects or defect complexes that modify the potential energy barrier for domain wall motion or displacement.Reference Berlincourt and Krueger8,Reference Robels and Arlt9
The intrinsic and extrinsic strain mechanisms are interdependent. The configuration, size, and mobility of domains are affected by their proximity to morphotropicReference Jin, Wang, Khachaturyan, Li and Viehland10 and polymorphic phase boundaries.Reference Wang, He, Damjanovic, Tagantsev, Deng and Setter11 In particular, the instability of the phases near a MPB leads to phase coexistence and the appearance of intermediate phases.Reference Noheda, Cox, Shirane, Gonzalo, Cross and Park12 In polycrystalline materials, neighboring grains interact elastically, piezoelectrically, and electrically.Reference Marutake13,Reference Pramanick, Damjanovic, Daniels, Nino and Jones14 The total macroscopic response of a piezoelectric ceramic therefore emerges from complex interactions of intrinsic and extrinsic mechanisms.
Intrinsic contributions
The thermodynamic origins of strain-generation mechanisms in solid solutions can be understood using the phenomenological theory of ferroelectricity.Reference Devonshire15 The theory assumes that the observed divergences in material response near phase transitions originate in the nonlinear dielectric behavior, that there is a spontaneous strain due to electrostriction, and that the elastic response obeys Hooke’s Law. Coupling to the dielectric nonlinearities gives rise to associated anomalies in the thermal, elastic, and piezoelectric properties. The Gibbs free energy, ΔG, for a ferroelectric crystal can be written as:
 $$\Delta G = \Delta G_l + {1 \over 2}\zeta _{ijkl} \left( {\nabla _i P_j \cdot \nabla _k P_l } \right) - Q_{ijkl} \sigma _{ij} P_k P_l - {1 \over 2}s_{ijkl} \sigma _{ij} \sigma _{kl} - E_i P_i ,$$
where P, σ, and E are the polarization, stress, and electric field, respectively, ζ the coefficient of the gradient term, Q the electrostriction constants, and s the elastic compliances. The first term on the right hand side of Equation 1 represents the Landau free energy describing the phase transitions among paraelectric and ferroelectric phases, and the remaining four terms represent the gradient, electrostrictive coupling, elastic, and electrostatic energies, respectively. The composition–temperature (x–T) diagramReference Newnham2 for a morphotropic solid solution such as PZT is shown in Figure 1a.
(a) High-temperature region of the phase diagram of lead zirconate-titanate (PZT) showing the stability fields of the paraelectric cubic phase and the rhombohedral (R) and tetragonal (T) ferroelectric phases. The morphotropic phase boundary (MPB), the line of Curie temperatures (T C), and the lines of first-order transitions (T 0) between paraelectric and ferroelectric phases are also shown. Adapted with permission from Reference NewnhamReference 2. © 2005 Oxford University Press. (b) Schematic  $\left( {1\bar{1}0} \right)$ sections of the energy surface in the (left) R phase and (right) T phase and (middle) showing the spherical degeneration producing an instability of the spontaneous polarization (P s) against rotation at the MPB. The colors denote the crystallographic directions of the polarization corresponding to different ferroelectric phases: blue, the [111] direction (R phase); green, the [110] direction (orthorhombic phase); red, the [001] direction (T phase).Reference Heitmann and Rossetti18 (c) Composition dependence of the dielectric permittivities (
 ${\mathit{\varepsilon }_{ij}}$) and piezoelectric charge coefficients (d ij) showing extrema due to the transverse instability at the MPB.
 ${\mathit{\varepsilon }_0}$ is the permittivity of free space and the subscripts for
 ${\mathit{\varepsilon }_{ij}}$ and d ij represent components of the dielectric permittivity and piezoelectric charge coefficient tensors (the latter are in contracted tensor notation), respectively. The colors denote properties in the two ferroelectric phases: R phase (blue), T phase (red). The divergence in the transverse susceptibility (
 ${\mathit{\varepsilon }_{11}}$) is accompanied by a strong increase in the piezoelectric shear coefficients (d 15 = d 24).Reference Heitmann and Rossetti20 The data shown are from Reference Heitmann and RossettiReference 20. (d) Free energy ΔG versus polarization, P, showing the reduction in energy barrier height as a tricritical point (TCP) is approached near first-order paraelectric to ferroelectric transitions with vanishing values of (T 0 – T C). The curves shown are for reduced temperature T/T C = 0.95 in the T phase with x > x MPB, where x MPB is the composition of the MPB. For the T phase, the entire quartic coefficient (βT) in the Landau series is the sum of isotropic (β1) and anisotropic (β2) terms. If, in accordance with the Landau theory, the quadratic (α) and sextic (γ) coefficients have similar magnitudes, a TCP occurs as βT passes through zero from negative to positive values. (e) Equilibrium free energies of the tetragonal (
 $\Delta G_l^\text{T}$) and rhombohedral (
 $\Delta G_l^\text{R}$) phases versus composition (x) and the corresponding region (Δx) of metastable two-phase coexistence. (f) (Middle) Schematic energy surface of the monoclinic MA phase and implications for (left) easy field-induced polarization rotation in the (110) plane and (right) the formation of adaptive tetragonal nanotwins.Reference Khachaturyan30 (Middle) The color represents the variation with crystallographic direction of the magnitude of the free energy from high (red) to low (blue).

The Landau free energy for the monodomain state depends on composition, temperature, and polarization, and can be written as:
 $$\Delta {\rm{G}}_{\rm{l}} = {1 \over 2}\alpha \left( x \right)\left( {T - T_C \left( x \right)} \right)\left[ {P_1^2 + P_2^2 + P_2^2 } \right] + {1 \over 2}\beta _1 \left( x \right)\left[ {P_1^2 + P_2^2 + P_3^2 } \right]^2 + {1 \over 4}\beta _2 \left( x \right)\left[ {P_1^4 + P_2^4 + P_3^4 } \right] + {1 \over 6}\gamma _1 \left[ {P_1^2 + P_2^2 + P_3^2 } \right]^3 + \cdots ,$$
where T C is the Curie temperature, α, β, and γ are the dielectric stiffness coefficients, and it is sufficient to assumeReference Rossetti, Khachaturyan, Akcay and Ni16 that each of the composition-dependent terms varies linearly with x. In the tetragonal (T) phase, the polarization vector P is parallel to [001] with P = {0, 0, P}. In the rhombohedral (R) phase, the polarization vector is parallel to [111] with  ${\rm P} = \left\{ {P/\sqrt 3, P/\sqrt 3 ,P/\sqrt 3 } \right\}$. The spontaneous polarization, P s, and equilibrium free energies,
 $\Delta \text{G}_\text{l}^\text{T}$ and
 $\Delta \text{G}_\text{l}^\text{R}$ of the two phases are determined from the condition ∂ΔG 1/∂P = 0. The terms of the form
 $\left[ {P_1^2 + P_2^2 + P_3^2 } \right]^n $ have the same values in both phases. Hence, taking a simple linear composition dependence for the coefficient of the anisotropic quartic term,
 ${\rm{\beta }}_{\rm{2}} \left( x \right) = {\rm{\beta }}_2^0 \left( {x_{{\rm{MPB}}} - x} \right)$, where
 ${\rm{\beta }}_{\rm{2}}^{\rm{0}} $ is a positive constant and x MPB is the composition at the MPB, it follows from Equation 2 that the R phase (x < x MPB) has the lowest free energy when β2 > 0, and the T phase (x > x MPB) has the lowest free energy when β2 < 0. The T ↔ R transition at the MPB is thus dictated by the condition β2 = 0.
Under this condition, the free-energy surface changes from cubic to spherical symmetryReference Benguigui17 and the polarization vector becomes unstable against rotation (Figure 1b).Reference Heitmann and Rossetti18 The transverse properties (perpendicular to the polarization direction) assume anomalously large values, with the transverse dielectric permittivity,  ${ \in _{\mathrm{11}}} = { \in _{\mathrm{22}}} \sim \frac{1}{{{\text{\beta }_\text{2}}}} \to \infty$ as x → x MPB, while the longitudinal permittivity, ϵ33 scarcely changesReference Carl and Härdtl19 (Figure 1c).Reference Heitmann and Rossetti20 The peak in permittivity observed for PZT ceramics near the MPB is explained by the divergence of the transverse permittivity, as the polycrystalline-averaged value is
 $\in \cong \frac{\mathrm{1}}{\mathrm{3}}\left( {{ \in _{33}} + \,2{ \in _{11}}} \right)$. The strong dielectric anisotropy (
 ${\mathrm{\varepsilon }_{11}} \gg {\mathrm{\varepsilon }_{33}}$) also translates into the piezoelectric properties. In the T phase, for example, there are three nonzero components of the piezoelectric charge coefficient tensor.Reference Haun, Furman, Jang and Cross21 In contracted tensor notation these are
 ${d_{33}} = 2{\mathrm{\varepsilon }_{33}}{Q_{11}}{P_s}$,
 ${d_{31}} = {d_{32}} = 2{\mathrm{\varepsilon }_{33}}{Q_{12}}{P_s},$ and
 ${d_{15}} = {d_{24}} = 2{\mathrm{\varepsilon }_{11}}{Q_{44}}{P_s}$; the divergence in
 ${\mathrm{\varepsilon }_{11}}$ is thus accompanied by a strong increase in the piezoelectric shear coefficients d 15 = d 24 (Figure 1c). Similarly, there is a concomitant increase in the shear elastic compliances,Reference Newnham2 s 44 = s 55 ∼ 1/β2 → ∞. If, however, the temperature is raised to the Curie temperature, the longitudinal permittivity,
 ${\mathrm{\varepsilon }_{33}}$, also diverges. The increase in piezoelectric properties near the Curie line instead reflects an instability of the polarization against extension. Hence, both polarization rotation and extension mechanisms can lead to increases in the strain response, but with differing relative contributions in different regions of the phase diagram.Reference Budimir, Damjanovic and Setter3
In polycrystalline ceramics, the large piezoelectric shear coefficients and elastic shear softening near the MPB permit strong contributions arising from crystallites with directions of spontaneous polarization deviating substantially from the electric-field poling direction. It has been shownReference Wersing, Heywang, Beige and Thomann22 that the ideal angle of this deviation is θ ≅ 57°. When high-quality crystals can be grown, the shear contributions to the piezoelectric response can be more fully exploited, as demonstrated in morphotropic solid solutions such as lead magnesium niobate-lead titanate.Reference Park and Shrout23 For rhombohedral single crystals, electric-field poling parallel to the pseudocubic [001] direction causes the spontaneous polarization to favor four of the eight equivalent 〈111〉 directions that are most closely aligned to the field. After poling, the polarization vectors are oriented at an angle θ = 57.4° relative to the direction perpendicular to the field. The ultrahigh strain in oriented single crystals is thus a consequence of an optimal contribution of the shear response.
The intrinsic origins of the observed maxima in piezoelectric properties near the MPB can be inferred in several ways. Empirically, numerous investigations have shown that the enhanced properties in PZT begin to emerge far from the MPB. The continuous variation in dielectric and piezoelectric properties in PZT leads to the conclusion that the peak values cannot arise due to mechanisms operating solely at the MPB. This same conclusion is reached if the order of the paraelectric to ferroelectric transitions is considered. In PZT, the first-order transitions along the Curie line weaken on approaching the center of the phase diagram from either end member and terminate in two tricritical points,Reference Eremkin, Smotrakov and Fesenko24 where (T 0 – T C) → 0 (Figure 1a). At a tricritical point, the entire quartic term in Equation 2 goes to zero, and a line of first-order transitions passes over to a line of second-order transitions. In the T phase, this corresponds to the conditionReference Rossetti, Khachaturyan, Akcay and Ni16 β1 = –β2, and in the R phase,  ${\rm{\beta }}_1 = - {1 \over 3}{\rm{\beta }}_2 $. As the T ↔ R transition occurs when β2 = 0, the entire quartic term becomes anomalously small near the MPB, and this results in a reduction in the energy barriers separating differing polarization directions (Figure 1d). Because the Landau polynomial equally describes the paraelectric and ferroelectric phases, the diverging transverse permittivity and weakening of first-order transitions along the Curie line are both manifestations of the same phenomenon: a continuous reduction in crystallographic anisotropy of polarization on approaching the MPB that originates in the properties of the paraelectric phase.
Nonetheless, the near energetic degeneracy of the T and R phases is also associated with other phenomena that are restricted to the region surrounding the MPB. One such phenomenon is two-phase coexistence. If atomic diffusion is thermally frozen, all transitions between phases are diffusionless, and the MPB is the locus of points where the equilibrium free energies of the T and R phases intersect. At each intersection, two phases coexist in equilibrium with the same composition. Naturally, it is possible to deviate from this composition and have each of the phases persist as metastable states, producing a region of metastable two-phase coexistenceReference Isupov25 (Figure 1e). In contrast, if diffusional processes are operative, the chemical free energy of mixing plays a role, and a coexistence region is predicted wherein two phases are in equilibrium with different compositions.Reference Rossetti, Khachaturyan, Akcay and Ni16,Reference Ari-Gur and Benguigui26 Regardless of the origin, two-phase coexistence at the MPB is accepted as an important attribute of PZT piezoelectric ceramics.Reference Jaffe, Cook and Jaffe1 It increases the number of polarization orientation states, facilitating poling to a high degree of remanence, and creating the potential for extrinsic strain mechanisms involving domain or phase switching under an applied electric field or stress.
Another phenomenon restricted to the MPB region involves the appearance of one or more monoclinic phases.Reference Noheda, Cox, Shirane, Gonzalo, Cross and Park12 First-principles calculations suggestedReference Bellaiche, García and Vanderbilt27 that monoclinic phases provide a pathway for the continuous rotation of the polar vector on changing composition across the MPB, and it was proposedReference Fu and Cohen28 that the piezoelectric response in an applied electric field is enhanced by easy polarization rotation through a monoclinic distortion (Figure 1f). The thermodynamic conditions stabilizing a homogeneous monoclinic phase are satisfied only if the Landau series in Equation 2 is expanded to include the symmetry-allowed terms of order eight and higher,Reference Vanderbilt and Cohen29 which can become important near the MPB where the energy surface is already nearly spherically degenerate.Reference Heitmann and Rossetti20 Simultaneously, the near degeneration of the energy surface implies that the energy cost of polarization rotation within a domain boundary is also small.Reference Benguigui17 The vanishing domain wall energy,  ${\rm{\psi }} = \sqrt {{\rm{\zeta \beta }}_2 (x)} \to 0$ as x → x MPB, was associated with the conformal miniaturization of the domain structure to nanometer dimensions, producing a domain-averaging effect imitating coherent diffraction from a monoclinic phase,Reference Jin, Wang, Khachaturyan, Li and Viehland10 and producing a high configurational sensitivity of adaptive nano-twins to applied electric field or stress.Reference Jin, Wang, Khachaturyan, Li and Viehland10,Reference Khachaturyan30 The true nature of the structural state associated with observations of monoclinic phases remains an active area of inquiry.
The thermodynamic arguments previously outlined for PZT are also applicable to lead-free solid solutions. The literature is replete with examples of lead-free systems for which vanishing crystallographic anisotropy of polarization, tricritical behavior, two-phase coexistence, and domain miniaturization have been invoked to rationalize the high piezoelectric response near phase boundaries.Reference Acosta, Novak, Rojas, Patel, Vaish, Koruza, Rossetti and Rödel31 A main distinction is that the PPBs in lead-free systems tend to show greater inclination and curvature compared to the MPBs in lead-based systems, restricting the operating temperature range. Furthermore, some systems, such as those based on BaTiO3, often have phase transitions to a ferroelectric orthorhombic (O) phase that interleaves the R and T phases. The occurrence of the O phase alters the analysis of the free energy in Equation 2, as this requires that all of the sextic invariants of the Landau series be taken into account. Depending on the type of phase diagram, these additional terms may be functions of composition and temperature. Nonetheless, the dielectric anisotropy and elastic softening occurring near phase boundaries are central to understanding the intrinsic contributions to the piezoelectric response.
Extrinsic contributions
The term “extrinsic contribution” usually refers to the electromechanical activity of mobile ferroelectric domain walls. Ideally, only domain walls that separate domains with different orientations of both spontaneous strain and polarization tensors are piezoelectrically active. These domain walls are called non-180° or ferroelectric-ferroelastic domain walls. The displacement of domain walls can account for more than 50% of the total piezoelectric effect of PZT and BaTiO3.Reference Pramanick, Damjanovic, Daniels, Nino and Jones14 First, we consider the properties measured at weak-to-moderate fields, below the coercive field.
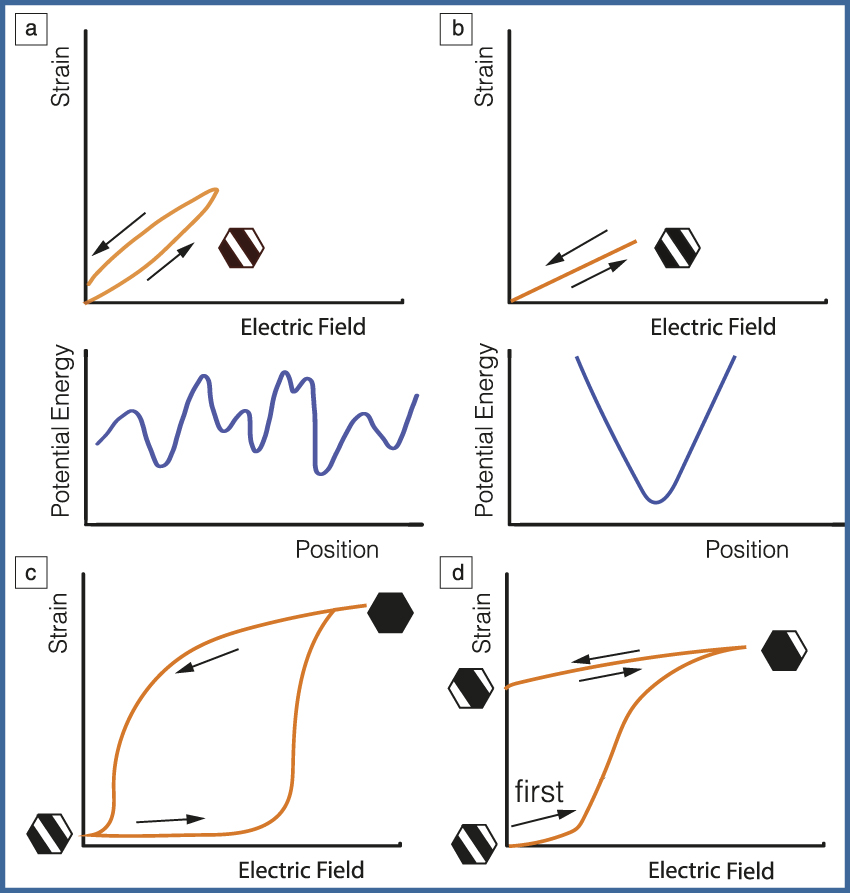
Piezoelectric actuators requiring high mechanical displacement exemplify applications where large contributions from domain wall motion may be desired. The motion of domain walls, however, tends to be nonlinear, hysteretic, and frequency dependentReference Damjanovic32 (Figure 2a). This can be a serious problem for high-precision applications such as scanning systems or for operation at high power and high frequencies where energy dissipation associated with hysteretic motion of the domain walls leads to heat generation.Reference Zheng, Takahashi, Yoshikawa and Uchino33 To control the domain wall motion, the standard approach in PZT is to introduce point defects into the material.Reference Jaffe, Cook and Jaffe1 All point defects pin domain walls to some extent, because they locally break the long-range periodic arrangement of atoms. It was found, however, that acceptor (e.g., Fe+3 in place of Zr/Ti+4) and donor (e.g., Nb+5 in place of Zr/Ti+4) dopants in PZT have opposite effects on domain wall displacement. With respect to the undoped material, which behaves as weakly hard,Reference Damjanovic, Bertotti and Mayergoyz34 acceptor doping of PZT results in hardening of the material response (the domain wall motion is suppressed) while donors make the response softer (domain wall motion is enhanced). The reasons for these different behaviors are complex and have still not entirely been clarified.
Illustration of strain-electric field relationships in ferroelectric materials and potential energy for domain walls. (a) (Top) Strain-electric field relationship in soft or weakly hard ferroelectric at weak-to-moderate fields is hysteretic. (Bottom) The origin of the hysteresis is from small jumps of domain walls through a random energy potential, defined by varying strength and random spatial distribution of the pinning centers.Reference Damjanovic, Bertotti and Mayergoyz34 Examples include Nb-doped lead zirconate titanate (PZT), (K,Na,Li)(Nb,Ta)O3, and (Ba,Ca)(Zr,Ti)O3. (b) A hard ferroelectric at weak fields in the aged state. (Top) Strain-electric field relationship is anhysteretic because domain walls are (bottom) pinned in deep potential wells defined by alignment of defect complexes with spontaneous polarization and strain within domains.Reference Damjanovic, Bertotti and Mayergoyz34 Examples are Fe-doped PZT and acceptor-doped BaTiO3. (c) A hard ferroelectric at unipolar switching fields. Due to the strong restoring force of defect complexes, the domain walls revert back to the initial state at zero field, giving large but hysteretic strain. An example is Mn-doped BaTiO3. In (Bi1/2Na1/2)TiO3-BaTiO3-(K,Na)NbO3 solid solution, similar behavior is associated with the field-induced ferroelectric state. (d) A soft ferroelectric subjected to a unipolar switching field. The first application of the field polarizes and strains the material. The material remains strained at zero field resulting in a reduced induced strain for subsequent cycles. The representative domain structure in a ceramic grain is shown schematically for each case. Domain walls separate regions with different polarization and strain states that are depicted by black and white regions within a ceramic grain.

From an energetic point of view, the potential energy profile for a domain wall in an acceptor-doped PZT can be described as a deep potential well where a domain wall at weak-to-moderate fields moves in a quasi-linear and anhysteretic fashionReference Robels and Arlt9 (Figure 2b). In donor-doped PZT, the energy profile for a domain wall can be represented by a random energy potential with variable barrier heightsReference Damjanovic32 (Figure 2a). On the atomic level, the difference between acceptor- and donor-doped PZT has been understood through first-principles computations by considering the energy of the crystal for different spatial distributions and orientations of the defect complexes with respect to the spontaneous strain and polarization within domains.Reference Chandrasekaran, Damjanovic, Setter and Marzari35 In Fe-doped PZT, charged oxygen vacancies, VO+2, provide partial charge compensation for the acceptor dopant. FeTi–1 (Fe+3 on Ti+4 site) and VO+2 then form complexes that align with polarization and strain within the domains, blocking the displacement of the domain walls. In Nb-doped PZT, lead vacancies, VPb–2, provide partial charge compensation for NbTi+1 (Nb+5 on Ti+4 site). The computations show that VPb–2 and NbTi+1 do not bind as strongly as FeTi–1 and VO+2. Without forming pairs, VPb–2 and NbTi+1 are thus randomly distributed throughout the domains, resulting in a random energy potential for the domain walls with many shallow barriers. The motion of a domain wall in such a potential is nonlinear, hysteretic, and frequency dependent.Reference Damjanovic32 NbTi+1 also helps in reducing the concentration of VO+2, making donor-doped materials less prone to hardening by VO+2-VPb–2 pairs, which easily form in Pb-based materials due to significant evaporation of PbO.Reference Jaffe, Cook and Jaffe1
The successful control and fine-tuning of the properties of PZT by doping inspired efforts to chemically modify lead-free ferroelectrics. This was only partly successful. BaTiO3, for example, can be readily made hard by acceptor doping (Ni, Fe, Mn in place of Ti).Reference Carl and Haerdtl36,Reference Arlt and Neumann37 The donor doping of barium titanate, on the other hand, resulted in a semiconducting rather than a soft material.Reference Daniels, Härdtl and Wernicke38 In contrast to PZT, the charge-compensating defects for the donor dopant in BaTiO3 are electrons rather than cation vacancies. This is probably due to a large enthalpy of formation of Ba and Ti vacancies.Reference Erhart and Albe39 Similar attempts to considerably enhance the piezoelectric properties of other lead-free ferroelectrics by donor doping have not been successful. In (Bi1/2Na1/2)TiO3 (BNT), for example, the addition of La+3, which is a common softener in PZT, leads only to a moderate improvement in the properties, but considerably affects the structure of the material.Reference Aksel, Forrester, Foronda, Dittmer, Damjanovic and Jones40 Other authors have adopted a different approach. Softening and hardening can be accomplished by nonstoichiometry (self-doping) rather than doping with foreign atoms. It was thus shown that in BNT, an excess of Bi (acting as a donor) leads to improvement of dielectric and piezoelectric properties while an excess of Na (acting as acceptor) results in properties degradation.Reference Prasertpalichat and Cann41 The achieved enhancement of the piezoelectric properties with Bi in excess of the stoichiometric material is modest, and overall properties are still much lower than in PZT. Softening in KNbO3-based material has not been documented in the literature.
Large strains in hard materials can be obtained when driven at fields larger than the coercive field, where the domain structure is completely reconstructed by switching from one equilibrium direction of polarization and strain to another.Reference Ren42,Reference Zhang and Ren43 The effect is based on the property of acceptor-doped materials to restore the zero-strain state and domain configuration after repeated application and removal of the electric field (Figure 2c). The restoring force has its origin in the interaction of an acceptor defect–oxygen vacancy complex with the polarization and strain. Similar results can be achieved in pseudo-cubic materials such as (Bi1/2Na1/2)TiO3-BaTiO3-(K0.5Na0.5)NbO3, but the mechanism is different. In this case, the application of the high electric field induces a ferroelectric state possessing a large reversible strain, such that the strain returns to zero upon the field removal. Fe doping enhances the effect by stabilizing the ferroelectric state at large fields through the interaction of acceptor dopant–oxygen vacancy complexes with strain and polarization.Reference Jo, Granzow, Aulbach, Rodel and Damjanovic44 In soft ferroelectrics, on the other hand, the switching process is irreversible, and after the first application of the field and after field removal, the material remains in the so-called remanent state with nonzero strain, such that the repeated application of the field does not change the strain state significantly, Figure 2d.Reference Jaffe, Cook and Jaffe1
The hardening effect is useful in lead-free materials for another reason. Lead-free materials possess a lower density and a higher vibration velocity than lead-based materials. They are thus of interest for high-frequency, high-power applications.Reference Lee, Ural, Chen, Uchino, Zhang and Jones45 These applications require a high mechanical quality factor (low mechanical losses) and therefore suppressed domain wall motion in the ferroelectric material, both of which can be achieved by acceptor doping. (K,Na)NbO3-based materials with useful properties are obtained by doping with Cu acceptor.Reference Matsubara, Kikuta and Hirano46
Finally, the designations “hard” and “soft” are generic terms and do not necessarily refer to acceptor- and donor-doped materials. Any ferroelectric with a high coercive field that is difficult to depole is said to have hard characteristics. Many lead-free materials fall in this category, including BiFeO3 and Bi4Ti3O12-based ferroelectrics with the layered Aurivillius structure.Reference Sagalowicz, Chu, Duran Martin and Damjanovic47
Summary
The high piezoelectric properties in lead-based and lead-free systems are intimately connected with strong dielectric anisotropy and elastic softening occurring near phase boundaries, and arise due to polarization rotation and extension mechanisms that are intrinsic in origin. The extension mechanism usually operates near the lines of Curie temperatures, while the rotation mechanism operates near MPBs or PPBs and is associated with a reduction in the crystallographic anisotropy of polarization and weakening of the first-order paraelectric-to-ferroelectric phase transitions. Other related mechanisms, including two-phase coexistence, monoclinic phases, and conformal domain miniaturization, are thermodynamically dictated but operate only near the phase boundaries and result in extrinsic mechanisms of strain generation. The doping strategies that have proven effective in tailoring the properties of hard and soft PZT have so far only been partially successful in lead-free systems. An exception is the hardening effect, which can be useful in applications where piezoelectric energy conversion and low energy loss are more important than large strain.
Thus, finding new lead-free compositions that exhibit piezoelectric properties with the temperature stability and versatility of PZT is not a simple task. Since the concentrated worldwide search for lead-free replacements of PZT began in the early 2000s, progress has been achieved mainly by chemical modifications of known materials—(K,Na)NbO3, BaTiO3, and (Na1/2Bi1/2)TiO3. The search for new materials using high-throughput density functional theory converged on these three families, which had already been semiempirically developed, and has failed to find new materials.Reference Armiento, Kozinsky, Fornari and Ceder48 This approach, however, only captures intrinsic mechanisms, and it is possible that future directions should focus on searches seeking materials with enhanced extrinsic contributions.

Dragan Damjanovic is a professor at the Institute of Materials, Swiss Federal Institute of Technology in Lausanne (EPFL), Switzerland. He received his BSc degree in physics from the Faculty of Natural Sciences and Mathematics at the University of Sarajevo, Bosnia and Herzegovina, and his PhD degree in ceramics science from The Pennsylvania State University (PSU). He completed postdoctoral research at PSU and EPFL. His interests include electromechanical coupling and related phenomena in oxide materials. Damjanovic can be reached by email at dragan.damjanovic@epfl.ch.

George A. Rossetti Jr. is a professor at the Institute of Materials Science at the University of Connecticut. He received his BS degree in chemical engineering and MS degree in materials engineering from Worcester Polytechnic Institute, and his PhD degree in solid-state science from The Pennsylvania State University. He completed postdoctoral research in solid-state chemistry at Princeton University. His research focuses on thermodynamics and crystallography of structural phase transformations, microstructure evolution, and structure–property relations in electroactive ceramics. Rossetti can be reached by email at george.rossetti_jr@uconn.edu.