

The leading approaches to scientific election forecasting in the United States consist of structural models, prediction markets, and opinion polling. With respect to the last, by far the dominant mode relies on vote-intention polling—for example: “If the election were held tomorrow, who would you vote for?” However, there exists an abiding opinion-polling strategy that shows great promise: citizen forecasting. That is, rather than query on vote intention, query on vote expectation—for example: “Who do you think will win the upcoming election?” This approach has been pursued most extensively in the United Kingdom (Murr Reference Murr2016) and the United States (Lewis-Beck and Tien Reference Lewis-Beck and Tien1999). Recent performance evaluations show that in the United Kingdom, vote expectations clearly offer more predictive accuracy than vote intentions (Murr, Stegmaier, and Lewis-Beck, Reference Murr, Stegmaier and Lewis-Beck n.d. ) and that in the United States, vote expectations appear to be superior to an array of rival forecasting tools (Graefe Reference Graefe2014). However, the timing of the data collection has forced most studies using citizen forecasts to forecast elections ex post—that is, after they occur. Indeed, to date, only three ex ante citizen-forecasting blog posts (Murr, Stegmaier, and Lewis-Beck Reference Murr, Stegmaier and Lewis-Beck2016; Reference Murr, Stegmaier and Lewis-Beck2017; Reference Murr, Stegmaier and Lewis-Beck2019) and only two ex ante citizen-forecasting papers have appeared before a national election (Lewis-Beck and Stegmaier Reference Lewis-Beck and Stegmaier2011; Murr Reference Murr2016). Both papers forecasted British General Elections, with the Murr (Reference Murr, Stegmaier and Lewis-Beck2016) study relatively most accurate among 12 academic forecasts (Fisher and Lewis-Beck Reference Fisher and Lewis-Beck2016).
With respect to the United States, the case at hand, none of the work has been ex ante and all studies have focused on the national level, with the exception of one study conducted at the state level (Murr Reference Murr2015). The latter point seems critical because the final selection of the president takes place in the Electoral College. Our citizen forecasting research is unique, being ex ante and focusing on the states. Utilizing survey questions on Amazon.com’s Mechanical Turk (MTurk), administered in July 2020, we rendered forecasts for the November 2020 presidential contest. This experiment, which has been conducted before-the-fact and looks at the states, provides a strong test of the quality of citizen forecasting in this American presidential election.
Our citizen forecasting research is unique, being ex ante and focusing on the states.
AMERICAN NATIONAL ELECTION STUDY EXAMPLES
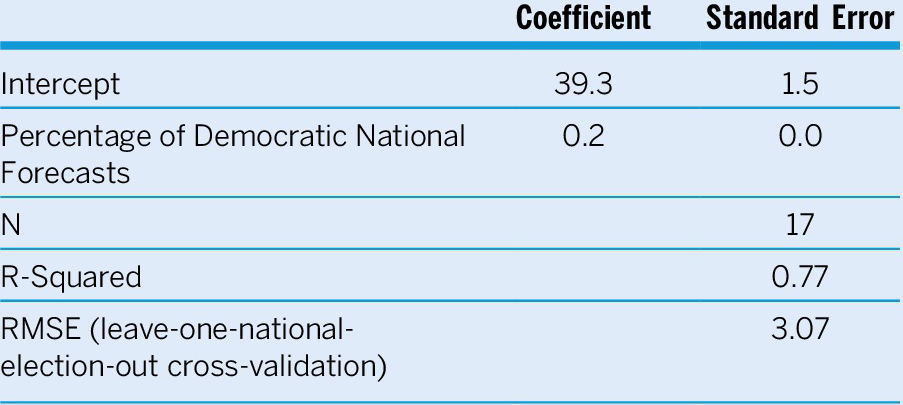
A standard dependent variable in American citizen-forecasting studies is the two-party popular vote share received by the president’s party, in the nation as a whole. The American National Election Study (ANES) survey question on voter expectations asks: “Who do you think will win in the November election?” Posed in each ANES pre-election survey, from 1952 to 2016, the question serves as a standard independent variable tapping voter expectations. We estimated a simple regression equation on the 17 elections across this period to show how voter expectations predict the popular vote (table 1 and table 2, columns 2–4) (Murr and Lewis-Beck Reference Murr and Lewis-Beck2020).
Linear Regression Model of National Two-Party Popular Vote for Democratic Candidate on Democratic National Forecasts, 1952–2016

Out-of-Sample One-Step-Ahead Forecasting of Democratic National Two-Party Popular Vote and Electoral Vote in the Last Three Elections

Note: In the predictions for 2008, the 88 electoral votes of 17 states without ANES respondents are split equally between Democrats and Republicans.
We observed that the model provides a snug fit to the data and close out-of-sample predictions. As a benchmark, for example, a Democratic “win” consists of a two-party popular vote of 50.1% or more. Which voter-expectation value will generate such a prediction? Answer: When 54% of respondents say that the Democratic candidate will win (i.e., 39.3 + 0.2(54.0) = 50.1).
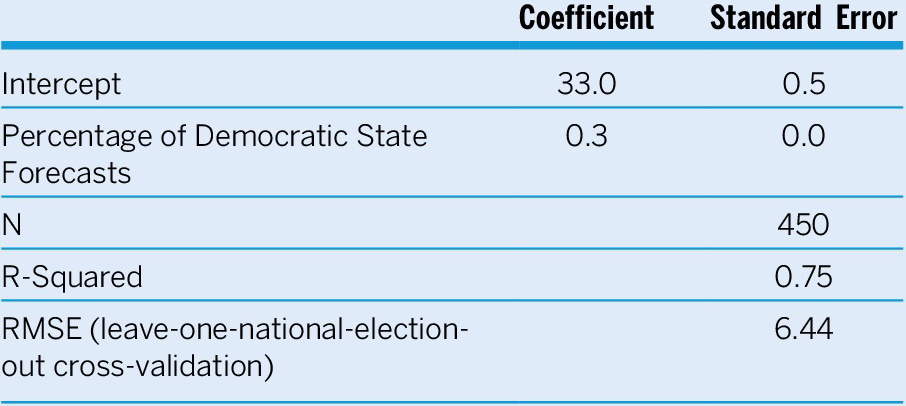
We can explore a similar equation at the state level because for 12 of these ANES surveys, it is possible to match respondents’ states to their expectation about “who will win in the state?” (table 3). We tested how well it predicts both the popular vote in states (see table 3) and the electoral vote in the nation as a whole (see table 2, columns 8–10).
Linear Regression Model of State Two-Party Popular Vote for Democratic Candidate on Democratic State Forecasts, 1952, 1972–1996, 2004–2016

Note: Data are weighted by the number of observations in a state.
Again, the model fits the data well and predicts the popular vote well in out-of-sample tests, although less so than at the national level. In terms of forecasting, to achieve a Democratic “win-the-state” popular-vote prediction of 50.1%, we need an expectations value of 57% (i.e., 33.0 + 0.3 (57.0) = 50.1).
These popular-vote predictions also imply a prediction of who wins the state, which in turn implies a prediction for the electoral vote in the nation as a whole. Table 2 shows that this model-based forecast of the electoral vote worked quite well in the last three elections, with two of them correct. Instead of using the regression model, we also can predict the winner to be the candidate who most citizens say will win. This data-based forecast performs similarly and is explored in the middle columns of table 2.
These ANES findings, at both state and national levels, provide strong evidence that citizen forecasting can “work.” Why should vote expectations predict well—perhaps even better than vote intentions? Their predictive power comes from their utilization of more information, drawing on citizens’ social networks (Leiter et al. Reference Leiter, Murr, Ramírez and Stegmaier2018; Murr Reference Murr, Arzheimer, Evans and Lewis-Beck2017). Stated simply, “two (or more) heads forecast better than one.” This increase in information depends on the “wisdom of the crowds” for its utility, as formally expressed in the Condorcet Jury Theorem. For example, citizens are forecasting independently and better than chance, on average, so their accuracy as a group increases with size (Murr Reference Murr2015). These results provide guidelines for our MTurk experiment in the states, discussed in the next section.
THE MTURK EXAMPLE
Utilizing Amazon.com’s MTurk, we gathered ex ante election-expectations data on a sample of citizens in each American state during the month of July 2020. We obtained responses to the national question: “Who do you think will be elected president in November?” We also obtained responses to a state question: “Which candidate for president do you think will win in this state?” The total N=2,483; within each state, the aim was to poll at least N=30.
“Which candidate for president do you think will win in this state?”
Of immediate interest is the percentage of respondents, in the nation as a whole, who believe that the Democratic candidate, Joe Biden, will win (table 4, column 2). That percentage is 51.35%, an encouraging value for Biden supporters. However, it is not enough, considering what that expectations score can deliver according to our national-level model in table 4 (columns 4 and 5), which predicts that Biden will lose. That is, he will win 39.3 + 0.2 (51.35) = 49.60% of the national popular vote.
Forecast of National Popular Vote

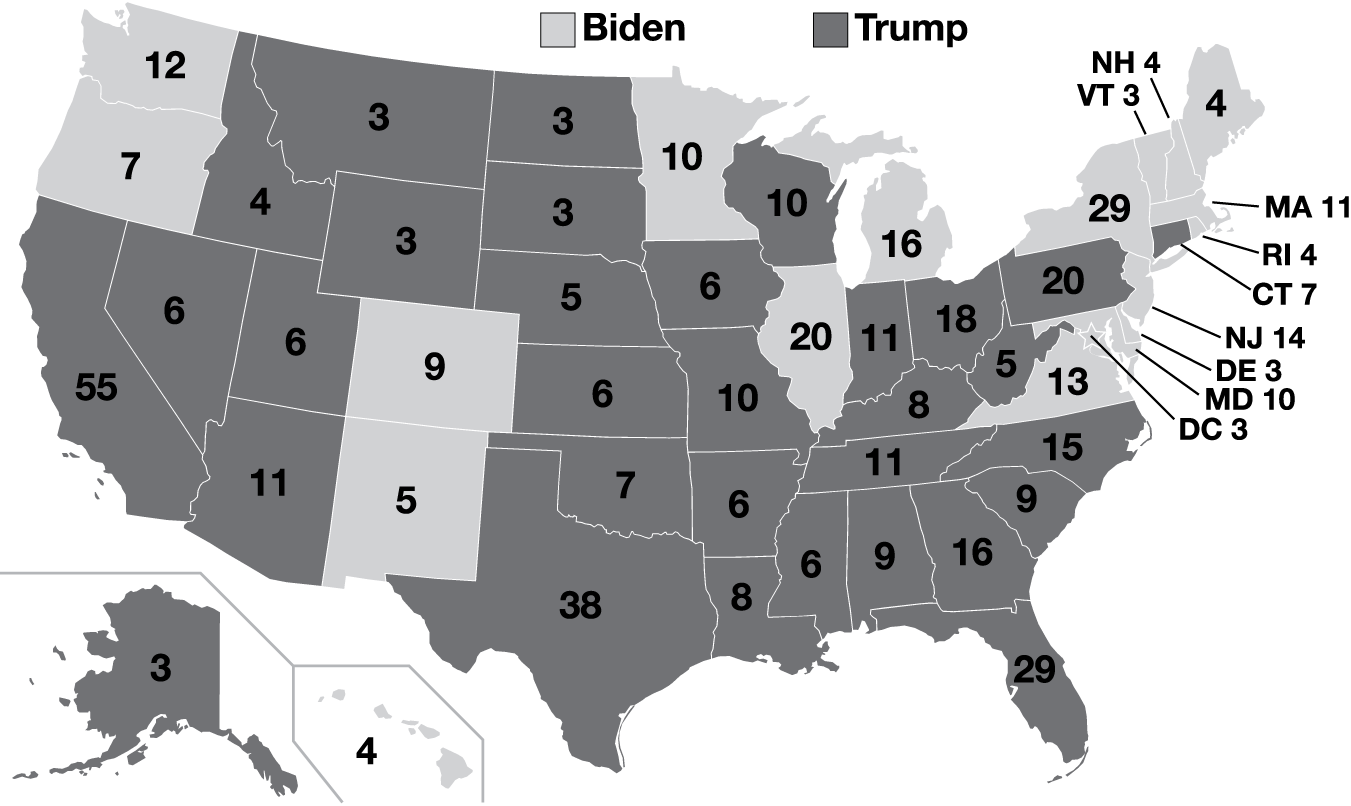
What is the prediction for the Electoral College? Suppose we look directly at the prediction for each state, simply declaring a “state win” for Biden if 50%-plus of respondents in that state forecast Biden. The expectation percentages, state by state, are listed in table 5, columns 3 and 7. We observe results with face validity—for example, the red state of Oklahoma shows 37% for Trump and the blue state of Massachusetts shows 59% for Biden. However, curious classifications exist, primarily California at 46% for Biden. We double-checked our calculations for this case, as well as other surprises, and found no errors. The calculations may not hold for the nation on Election Day, but if they do, Biden will receive 204 electoral votes and Trump 334. The ANES-derived forecast model (see table 3) suggests an even stronger Trump Electoral College victory, with 357 electoral votes. The electoral-votes summary is shown in table 6 and on the map in figure 1. (The uncertainty of our forecasts is discussed in the online supplemental material.)
Forecast of State Popular Vote and Winner

Forecast of Electoral Votes

Map of Model-Based Election Forecast by State
Note: The numbers indicate the state’s electoral votes.

DISCUSSION
The results of the ANES analysis, especially at the state level, clearly indicate that citizen forecasting can produce accurate state-by-state results. How much confidence should we place in the MTurk results? Consider the quality of the sample, using ANES as a case in point: although it uses probability sampling at the national level, it does not follow probability sampling at the state level. However, those state-level results make for convincing forecasts. Is the same true for the MTurk convenience samples?
Here is what we know. First, essentially because of Condorcet’s Jury Theorem and the “wisdom of the crowd,” random samples are not required for citizen forecasting (Murr Reference Murr2011). An independent sample is needed that predicts better than chance. The state forecasts are different from chance (p<0.001); whether they are better or worse than chance can be tested once the actual election results are in. One data-credibility check is how many respondents forecast a candidate winning both the state and the nation. In our MTurk sample, the percentage is 77%, close to the historical ANES average of 73%. Furthermore, the MTurk national forecast receives concurrent validity because it is essentially the same as the current national citizen forecast from The Economist/YouGov Polls (in which Biden=39%, Trump=40%, as of July 12–14, 2020).
MTurk workers appear to be doing as well as other more well-known national samples. Furthermore, its workers have characteristics that are shown to improve individual forecasting accuracy. For example, our MTurk workers are, on average, quite interested in the election campaign (i.e., scoring 2.5 on a 3.0 scale)—a characteristic positively correlated with accuracy in both state forecasts (Murr Reference Murr2015) and national forecasts (Lewis-Beck and Tien Reference Lewis-Beck and Tien1999). Moreover, Amazon monitors the quality and identity of the workers. For example, they must provide official forms of identification, and Amazon validates that they are working where they claim. Also, the workers we employed had approval ratings of 90% or more.
In summary, the charge of a fatally flawed sample is more difficult to make than might be supposed. However, another issue exists in addition to that of sample quality: the issue of sample timing. Recall that these are July 2020 data. Is that date too far away from the election to yield accurate forecasts? Extended work on the UK case has shown that 93% of citizen forecasts were accurate two quarters before the election (Murr, Stegmaier, and Lewis-Beck, Reference Murr, Stegmaier and Lewis-Beck n.d. ). For the United States, a current study exploring the accuracy–lead time tradeoff for the 2016 presidential contest gave an optimal lead (before T=1) of 48 days before—even 86 days before if we sacrifice a half-point (Jennings, Lewis-Beck, and Wlezien Reference Jennings, Lewis-Beck and Wlezien2020, 954). These numbers imply that the July estimates, grosso modo, may hold. Actual election results will provide a sharp answer to this question.
In summary, the charge of a fatally flawed sample is more difficult to make than might be supposed.
DATA AVAILABILITY STATEMENT
Replication materials are available on Dataverse at https://doi.org/10.7910/DVN/S1594S.
SUPPLEMENTARY MATERIALS
To view supplementary material for this article, please visit http://dx.doi.org/10.1017/S1049096520001456.