1 Introduction
Richtmyer–Meshkov (RM) instability develops when a shock wave refracts through an interface between two fluids with different densities (Richtmyer Reference Richtmyer1960; Meshkov Reference Meshkov1969). Extensive interfacial mixing of the fluids ensues with time. RM instability is the impulsive acceleration limit of the more general Rayleigh–Taylor (RT) instability (Rayleigh Reference Rayleigh1883; Taylor Reference Taylor1950). RM instability has become increasingly significant because it controls a variety of processes in nature and technology in high- and low-energy-density regimes such as inertial confinement fusion (ICF) (Lindl et al. Reference Lindl, Amendt, Berger, Glendinning, Glenzer, Haan, Kauffman, Landen and Suter2004) and astrophysical problems (Shimoda et al. Reference Shimoda, Inoue, Ohira, Yamazaki, Bamba and Vink2015). To understand this instability, extensive studies on the shock interacting with perturbed interfaces have been performed, and great progress has been achieved (Brouillette Reference Brouillette2002; Ranjan, Oakley & Bonazza Reference Ranjan, Oakley and Bonazza2011; Zhou Reference Zhou2017a,Reference Zhoub; Zhai et al. Reference Zhai, Zou, Wu and Luo2018). Most previous work focused on the evolution of a single-mode interface after shock impact (Sadot et al. Reference Sadot, Erez, Alon, Oron, Levin, Erez, Ben-Dor and Shvarts1998; Holmes et al. Reference Holmes, Dimonte, Fryxell, Gittings, Grove, Schneider, Sharp, Velikovich, Weaver and Zhang1999; Collins & Jacobs Reference Collins and Jacobs2002; Niederhaus & Jacobs Reference Niederhaus and Jacobs2003; Jourdan & Houas Reference Jourdan and Houas2005; Mariani et al. Reference Mariani, Vandenboomgaerde, Jourdan, Souffland and Houas2008; Zhang & Guo Reference Zhang and Guo2016; Liu et al. Reference Liu, Liang, Ding, Liu and Luo2018a), because the single-mode interface is the basis of constituting the complex interface. In fact, the typical ICF capsule consists of two layers of different materials in a spherical geometry, namely, an outside ablator layer and an inside fuel layer (Lindl et al. Reference Lindl, Amendt, Berger, Glendinning, Glenzer, Haan, Kauffman, Landen and Suter2004). As a result, it is important to investigate the mixing between the outer ablator shell and the inner fuel induced by RM instability. Besides, RM instability of a fluid layer also occurs naturally in supernovae when the shocks generated by star collapse interact with the multilayer heavy elements throughout interstellar space (Arnett et al. Reference Arnett, Bahcall, Kirshner and Woosley1989). In the cylindrical or spherical geometry, when a converging shock impacts a fluid layer, the interaction process is quite complicated. The geometric convergent effect (Bell–Plesset effect) (Bell Reference Bell1951; Plesset Reference Plesset1954), the RM instability, the RT effect induced by the high pressures behind the converging shock wave (Luo et al. Reference Luo, Zhang, Ding, Si, Yang, Zhai and Wen2018) and the interface coupling effect as well as the additional waves’ effects (Ding et al. Reference Ding, Li, Sun, Zhai and Luo2019) are coupled together, and it is very difficult to isolate one individual mechanism from others. For simplicity, the shock–fluid layer interaction in the planar geometry where the Bell–Plesset effect and the RT effect induced by high pressures behind the shock are absent, were generally considered previously.
Theoretically, Taylor (Reference Taylor1950) was the first to consider RT instability on a liquid layer and obtained linear solutions for amplitude growths of two interfaces. When the thickness of the fluid layer is sufficiently small, the interface coupling effect cannot be ignored. Subsequently, a nonlinear solution for RT instability growth of a thin massless fluid layer was proposed by Ott (Reference Ott1972) and formations of bubble and spike were explained. The linear solutions for RM instability growth of the stratified fluids were proposed by Mikaelian (Reference Mikaelian1985, Reference Mikaelian1990, Reference Mikaelian1995, Reference Mikaelian1996), and the interface coupling and necessary conditions for the freeze-out of the first interface growth were discussed. Liu et al. (Reference Liu, Li, Yu, Fu, Wang, Wang and Ye2018b) analysed RM instability growth of two superimposed fluid layers in vacuum and proposed third-order weakly nonlinear solutions for the middle interface growth with the perturbation model. Experimentally, the evolution of a thin fluid layer created by the gas curtain technique was captured by Jacobs et al. (Reference Jacobs, Klein, Jenkins and Benjamin1993), and three distinct flow patterns were observed. The distinct flow patterns are ascribed to the difference of initial amplitudes on both sides of the fluid layer (Budzinski, Benjamin & Jacobs Reference Budzinski, Benjamin and Jacobs1994). Then the flow patterns were classified into three types (‘upstream mushroom’ shape, ‘downstream mushroom’ shape and ‘sinuous’ shape) (Jacobs et al. Reference Jacobs, Jenkins, Klein and Benjamin1995), but it is difficult to predict or control which type would appear during a particular experiment.
Meanwhile, the linear solutions for the amplitude growths of two interfaces and nonlinear vortex models for the mixing width growth were given. Rightley et al. (Reference Rightley, Vorobieff, Martin and Benjamin1999) carried out experiments of shock-accelerated gas curtains with different injection nozzles to create initial conditions containing one or more perturbation wavelengths. Their results showed an abrupt mixing transition for a multi-mode initial perturbation that is not apparent for single-mode perturbations. The circulation in the shocked gas curtain was measured by Prestridge et al. (Reference Prestridge, Vorobieff, Rightley and Benjamin2000), and the nonlinear model proposed by Jacobs et al. (Reference Jacobs, Jenkins, Klein and Benjamin1995) was validated. Subsequently, a series of RM instability experiments on gas curtains were conducted (Tomkins et al. Reference Tomkins, Kumar, Orlicz and Prestridge2008; Orlicz et al. Reference Orlicz, Balakumar, Tomkins and Prestridge2009; Balakumar et al. Reference Balakumar, Orlicz, Ristorcelli, Balasubramanian, Prestridge and Tomkins2012; Tomkins et al. Reference Tomkins, Balakumar, Orlicz, Prestridge and Ristorcelli2013; Prestridge Reference Prestridge2018). The effects of initial conditions such as the amplitude and wavelength of the interface on late-time RM instability evolution were considered. Numerically, the interaction of a shock wave with successive layers of fluids was investigated by de Frahan, Movahed & Johnsen (Reference de Frahan, Movahed and Johnsen2015), and the effects of initial amplitude, relative phase and distance between interfaces on the amplitude growth were discussed. The authors also considered the effect of RT instability involved in the light/heavy/light fluid layer case.
In summary, the gas curtain technique prevails in experiments to generate a fluid layer. However, the concentration of the test gas inside the gas curtain is non-uniform (Tomkins et al. Reference Tomkins, Kumar, Orlicz and Prestridge2008; Orlicz et al. Reference Orlicz, Balakumar, Tomkins and Prestridge2009), and the gas curtain actually consists of an infinite number of gas interfaces. Therefore, it is difficult to analyse the wave patterns and flow features, especially the evolution of each individual interface, during the shock–gas curtain interaction. Besides, the profile of the gas curtain is mainly cylindrical or elliptical (Bai et al. Reference Bai, Zou, Wang, Liu, Huang, Liu, Li, Tan and Liu2010), which means that the two interfaces are corrugated with an opposite phase. The other cases such as the two interfaces corrugated with the same phase have rarely been studied. As a shock wave interacts with a fluid layer, due to the repeating interactions of the interfaces with the shocks/rarefaction waves travelling inside (de Frahan et al. Reference de Frahan, Movahed and Johnsen2015; Ding et al. Reference Ding, Li, Sun, Zhai and Luo2019), the flow field cannot be regarded as incompressible and the waves’ effects on the flow are significant.
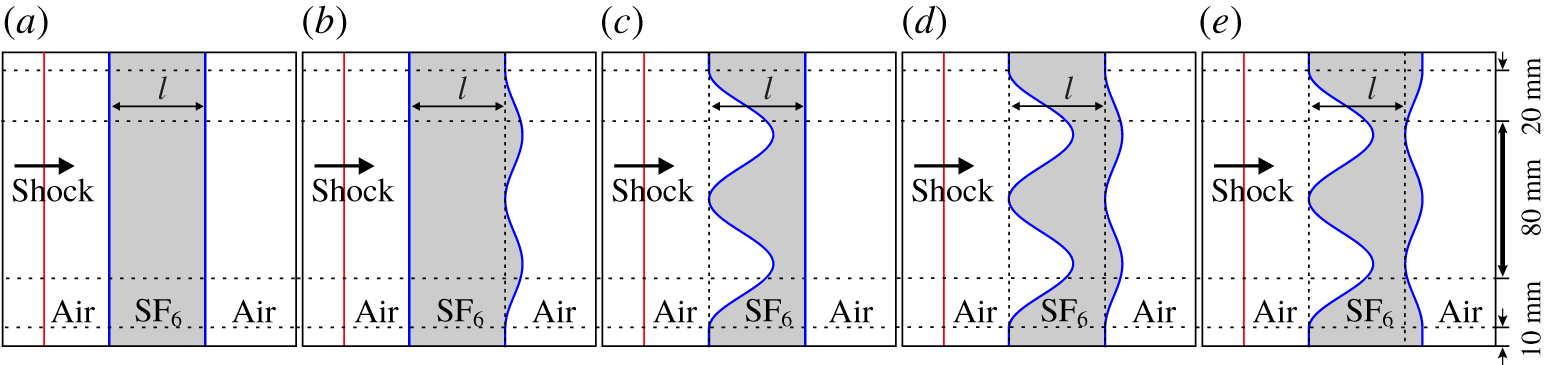
Five kinds of SF6 gas layer surrounded by air are considered in this work. Other gas types, such as a light gas layer, will be investigated in future work. For a gas layer, there are two interfaces. Considering that the interface is corrugated or not, four categories are involved: one-dimensional (1-D) case in which both interfaces are planar; downstream (DS) case in which only the second interface is corrugated but the first interface is planar; upstream (US) case in which only the first interface is corrugated but the second interface is planar; and ‘both’ case, in which both interfaces are corrugated. For the ‘both’ case, there are many situations, due to the difference of the relative phase. In this work, two typical cases, in which the phase differences between the two interfaces are 0 and  $\unicode[STIX]{x03C0}$, corresponding to in-phase (IP) case and anti-phase (AP) case, respectively, are considered. Other relative phase perturbations on two interfaces break the symmetry, generate vortex dipoles at an angle and even influence the positions of the refracted/reflected wave focal points, and are omitted in this work. As a result, five configurations are included in this work. Evolution of the shocked gas layer is captured by a high-speed schlieren photography. The effects of the waves, the relative phase of the two interfaces and the interface coupling on the gas layer evolution are highlighted.
Schematics of the initial configurations of the gas layer: (a) 1-D case, (b) DS case, (c) US case, (d) IP case and (e) AP case. The incident shock propagates from the left to the right.

2 Experimental method
As sketched in figure 1(a–e), five kinds of SF6 gas layer are involved. If the interface is disturbed, a sinusoidal corrugation is imposed because it is the simplest configuration. For a sinusoidal corrugation evolution, the initial amplitude is crucial.
For the DS case, a planar shock passes through the first planar interface, and the planar transmitted shock will interact with the second disturbed interface. This case concerns a planar shock interacting with a slow/fast interface. The small perturbation (the ratio of the initial amplitude to the wavelength is smaller than 0.1) is imposed on the second interface to examine the flow and to validate the theoretical models because most models were proposed based on the small perturbation hypothesis.
For the US case, a planar shock passes through the first disturbed interface, and the disturbed transmitted shock will interact with the second planar interface. This case refers to the interaction of a rippled shock with a planar interface, which has been investigated previously (Ishizaki et al. Reference Ishizaki, Nishihara, Sakagami and Ueshima1996, Reference Ishizaki, Nishihara, Wouchuk, Shigemori, Nakai, Miyanaga, Azechi and Mima1999; Zou et al. Reference Zou, Liu, Liao, Zheng, Zhai and Luo2017; Zhai et al. Reference Zhai, Liang, Liu, Ding, Luo and Zou2018; Liao et al. Reference Liao, Zhang, Chen, Zou, Liu and Zheng2019). Previous work showed that after the rippled shock impact, the interface amplitude imprinted by the rippled shock is much smaller than the rippled shock amplitude (Zou et al. Reference Zou, Liu, Liao, Zheng, Zhai and Luo2017; Zhai et al. Reference Zhai, Liang, Liu, Ding, Luo and Zou2018). If the amplitude of the first interface is small, the rippled transmitted shock will also inherit a small initial amplitude. Further, the amplitude will reduce as the rippled shock moves forwards. When the rippled shock impacts the second interface, the interface amplitude obtained may be too small to be measured precisely in experiments. As a result, to obtain a considerable amplitude growth of the second interface, a high initial amplitude of the first interface is chosen.
For the IP and AP cases, the emphasis is on the effect of the relative phase between the two interfaces on the flow. For comparison, a small initial amplitude is imposed on the second interface while a high initial amplitude is imposed on the first interface. Besides, the thickness of the gas layer is important to the developments of the waves and the interfaces. When the layer thickness is small, the interface coupling effect is significant. Especially, when two interfaces of a layer are corrugated with the same phase and the ratio of the thickness to the interface wavelength is smaller than  $1/3$, the amplitude growths of both interfaces are suppressed by the interface coupling effects (Ott Reference Ott1972). If the layer thickness is large, the rippled transmitted shock will travel a long distance before it impacts the second interface. During the propagation, both the perturbation and the phase of the rippled shock oscillate according to the first-order Bessel function (Bates Reference Bates2004). The thickness of the gas layer determines the perturbation and the phase of the rippled shock when it meets the second interface, and thus has a great effect on the amplitude growth of the second interface (Ishizaki et al. Reference Ishizaki, Nishihara, Sakagami and Ueshima1996).
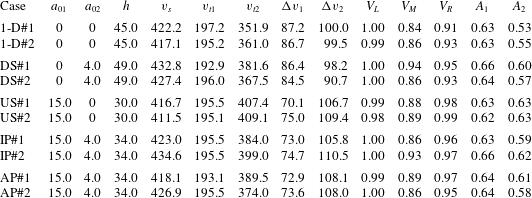
In this work, the effects of the waves, the relative phase of the two interfaces and the interface coupling on fluid layer evolution will be examined; a moderate thickness of the gas layer is therefore chosen. The length between the most upstream points on the two interfaces ( $l$) is maintained at 45 mm in all cases. For each perturbed case, the wavelength (
 $\unicode[STIX]{x1D706}$) and wavenumber (
 $k$) are fixed as 60 mm and
 $104.72~\text{m}^{-1}$, respectively. The initial amplitude of the single-mode perturbation on the first interface (
 $a_{01}$) and second interface (
 $a_{02}$) of a gas layer, and the distance between the balanced positions of the two interfaces (
 $h$), are given in table 1 for all cases. A pair of 10 mm long flat portions is arranged on both sides to connect the interface to the solid wall. The flat portions have limited effect on the evolution of the fluid layer concerned (Luo et al. Reference Luo, Liang, Si and Zhai2019) since the observing region is within
 $\pm$40 mm from the symmetry.
Experimental initial parameters for all cases:  $a_{01}$ (
 $a_{02}$), the amplitude of the first (second) interface;
 $h$, the distance between the balanced positions of two interfaces;
 $v_{s}$, the incident shock velocity;
 $v_{t1}$ (
 $v_{t2}$), the velocity of the transmitted shock TS1 (TS2);
 $\unicode[STIX]{x0394}v_{1}$ (
 $\unicode[STIX]{x0394}v_{2}$), the speed jump of the first (second) interface by fitting experimental data;
 $V_{L}$ and
 $V_{R}$, the volume fractions of air at left side of the first interface and at right side of the second interface, respectively;
 $V_{M}$, the volume fraction of SF6 inside the gas layer;
 $A_{1}$ (
 $A_{2}$), the Atwood number related to the first (second) interface. The unit is mm for
 $a_{01}$,
 $a_{02}$ and
 $h$; and
 $\text{m}~\text{s}^{-1}$ for
 $v_{s}$,
 $v_{t1}$,
 $v_{t2}$,
 $\unicode[STIX]{x0394}v_{1}$ and
 $\unicode[STIX]{x0394}v_{2}$. The numbers #1 and #2 represent the typical experimental runs.

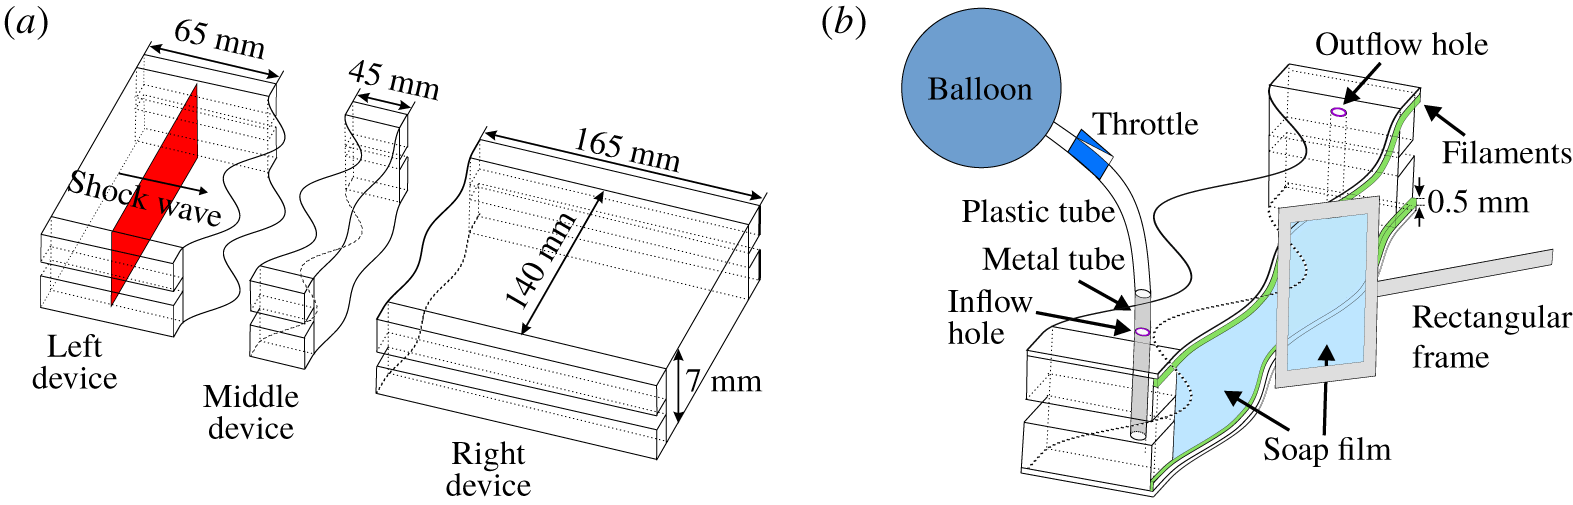
(a) Formation sketch of the SF6 gas layer surrounded by air and (b) enlargement showing the details of the middle device.

To create the SF6 gas layer, the soap film technique, which has proven its reliability for producing a discontinuous initial interface (Luo et al. Reference Luo, Wang, Si and Zhai2015; Ding et al. Reference Ding, Si, Chen, Zhai, Lu and Luo2017; Liu et al. Reference Liu, Liang, Ding, Liu and Luo2018a; Liang et al. Reference Liang, Zhai, Ding and Luo2019), is adopted. As shown in figure 2(a), three transparent devices with a width of 140 mm and a height of 7 mm are first manufactured using acrylic plates with a thickness of 3 mm. The lengths of the left, middle and right devices are 65, 45 and 165 mm, respectively. The adjacent boundaries of the middle device are carefully engraved to be of a sinusoidal shape with a depth of 0.5 mm. Two thin filaments with a height of 1.0 mm and a thickness of 0.5 mm are attached to the inner surfaces of the upper and lower plates of the middle device to restrict the soap film. Thus the filament bulges in the flow field with 0.5 mm height and its influence on the flow field will be discussed later.
Prior to the interface formation, the filaments are properly wetted by a soap solution with the mass fraction of 78 % distilled water, 2 % sodium oleate and 20 % glycerine. A rectangular frame, the edges of which have been dipped into an appropriate amount of soap solution, is pulled along the sinusoidal filaments on the middle device, and a closed space is formed. Then SF6 is pumped into the closed space from an inflow hole to discharge air through an outflow hole. A gas concentration detector is placed at the outflow hole to ensure the SF6 purity inside. Subsequently, the inflow and outflow holes are sealed. Finally, the left and right transparent devices are gently connected to the middle device and the combined one is inserted into the test section.
Prior to the experiment, air outside the gas layer and SF6 inside will mix mutually through the interface and air at both sides of the gas layer may be polluted differently by SF6. Therefore, the gas layer contains two interfaces separating three kinds of fluid. Note that only the ideal gas features of both SF6 and air are considered in this study. The gas components inside and outside the gas layer are determined by the shock velocities in experiments and 1-D gas dynamics theory, and the values are provided in table 1. There  $A_{1}=(\unicode[STIX]{x1D70C}_{2}-\unicode[STIX]{x1D70C}_{1})/(\unicode[STIX]{x1D70C}_{2}+\unicode[STIX]{x1D70C}_{1})$ and
 $A_{2}=(\unicode[STIX]{x1D70C}_{2}-\unicode[STIX]{x1D70C}_{3})/(\unicode[STIX]{x1D70C}_{2}+\unicode[STIX]{x1D70C}_{3})$ are Atwood numbers, where
 $\unicode[STIX]{x1D70C}_{2}$ and
 $\unicode[STIX]{x1D70C}_{1}$ are the densities of the gases on the right and left sides of the first interface, respectively, and
 $\unicode[STIX]{x1D70C}_{3}$ is the density of the gas at the right side of the second interface. The definition of the Atwood number coincides with the work of Jacobs et al. (Reference Jacobs, Jenkins, Klein and Benjamin1995). The three-dimensional (3-D) effect of the initial interface and the boundary layer effect have been discussed in detail in our previous work (Liang et al. Reference Liang, Zhai, Ding and Luo2019), and are ignored here.
Experiments are conducted in the same shock tube as previous work (Liang et al. Reference Liang, Zhai, Ding and Luo2019). The shock tube consists of a 1.7 m long driver section, a 3.9 m long driven section and a 1.0 m long test section. The cross-sectional area of the test section is  $140~\text{mm}\times 13~\text{mm}$. The incident shock Mach number measured by piezoelectric transducers is
 $1.25\pm 0.01$. Illuminated by a continuous light source (CEL-HXF300, maximum power output 249 W), the shocked flow is captured by a high-speed schlieren system. The frame rate of the camera (FASTCAM SA5, Photron Ltd) is 40 000 f.p.s., and the exposure time is
 $0.37~\unicode[STIX]{x03BC}\text{s}$. The spatial resolution of the image is
 $0.28~\text{mm}~\text{pixel}^{-1}$. The ambient pressure and temperature are 101.3 kPa and 293 K, respectively.
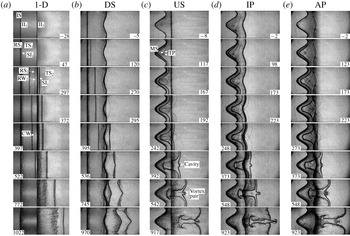
Schlieren pictures of the gas layer evolution in different cases. IS, incident shock; II1 and II2, the initial first and second interfaces, respectively; TS1 and TS2, the transmitted shocks through the first and second interfaces, respectively; SI1 and SI2, the shocked first and second interfaces, respectively; RS1, the shock reflected from the first interface; RS2, the shock reflected from the filaments; RW2 and RW1, the rarefaction waves reflected from the second and first interface, respectively; CW, compression wave reflected from the first interface; MS, Mach stem; TP, triple point. Numbers denote the time in  $\unicode[STIX]{x03BC}\text{s}$.

3 Interfacial morphology and wave pattern
The schlieren pictures of the shocked gas layer for various cases are shown in figure 3. The moment when the incident shock (IS) contacts the first interface is defined as the initial time. For the 1-D case, as presented in figure 3(a), after the IS impacts the initial first interface (II1), a transmitted shock (TS1) and a reflected shock (RS1) are generated. The shocked first interface (SI1) is accelerated and begins to move. Then the TS1 impacts the initial second interface (II2), a transmitted shock (TS2) moves forwards outside the layer followed by the shocked second interface (SI2). Interestingly, both the reflected shock (RS2) and the reflected rarefaction waves (RW2) are observed inside the layer ( $297~\unicode[STIX]{x03BC}\text{s}$), while the shock RS2 should be absent for a shock impinging on a slow/fast interface. The coexistence of both the RS2 and the RW2 was also observed in previous work (Vandenboomgaerde et al. Reference Vandenboomgaerde, Rouzier, Souffland, Biamino, Jourdan, Houas and Mariani2018), in which the shock is reflected from grid bars supporting the initial interface.
In this work, it is the filament that protrudes in the flow that interacts with the RS1 and therefore the RS2 is generated. Note that the filament only extends very little into the main flow, and thus only a very small portion of the RS1 is reflected. It is believed that the RS2 will not have significant influence on the flow, and the discussion on the RS2 is ignored hereinafter. The RW2 impacts the SI1 and the compression wave (CW) is reflected from the SI1 ( $397~\unicode[STIX]{x03BC}\text{s}$). The CW is difficult to distinguish because of the spatial resolution limitation. The CW moves downwards inside the layer, and will interact with the SI2. After the SI1 passes through the initial position of the II2, its thickness increases significantly. On the one hand, the filaments bulging in the flow field at the position of the II2 impede the motion of the SI1 near the acrylic plates, resulting in a prominent 3-D effect. On the other hand, after the SI1 passes across the position of the II2, the atomized soap droplets that remain near the II2 mix with the SI1, causing the increase of the interface thickness.
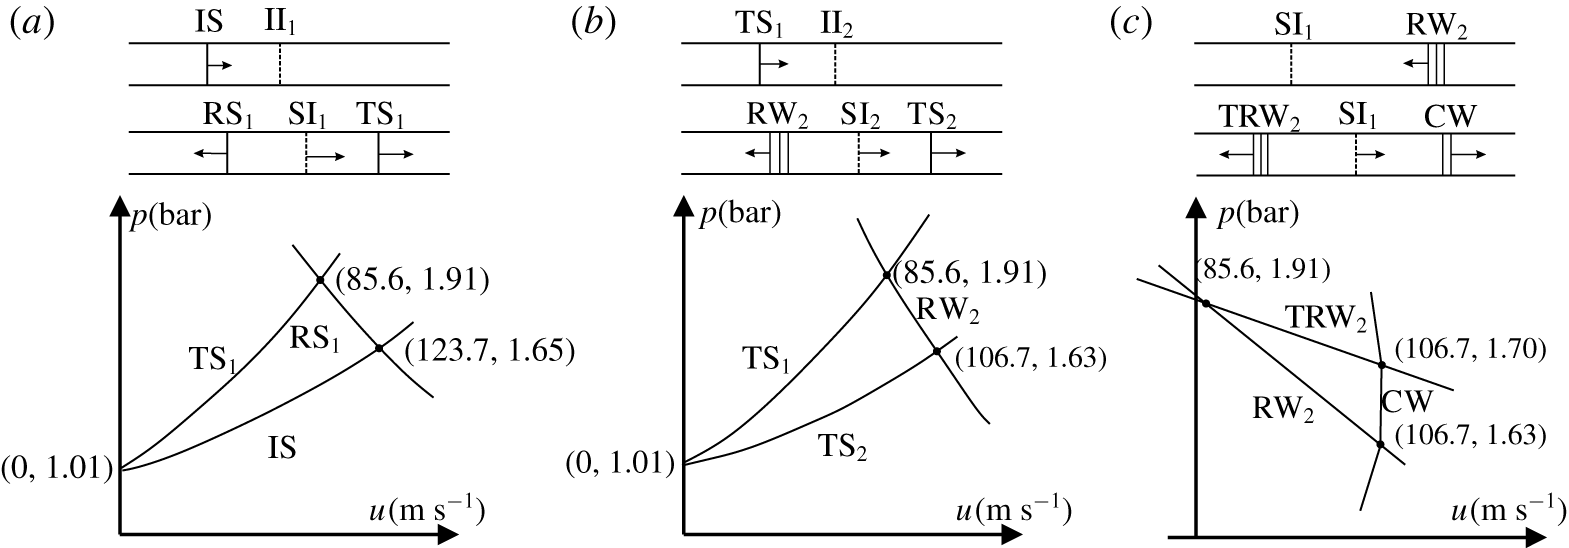
The pressure–material velocity ( $p$–
 $u$) shock polar analysis. (a) The interaction of the incident shock (IS) with the first interface. (b) The interaction of the transmitted shock (TS1) with the second interface. (c) The interaction of the rarefaction waves (RW2) with the shocked first interface. TRW2 is the transmitted rarefaction wave when the RW2 interacts with the SI1.

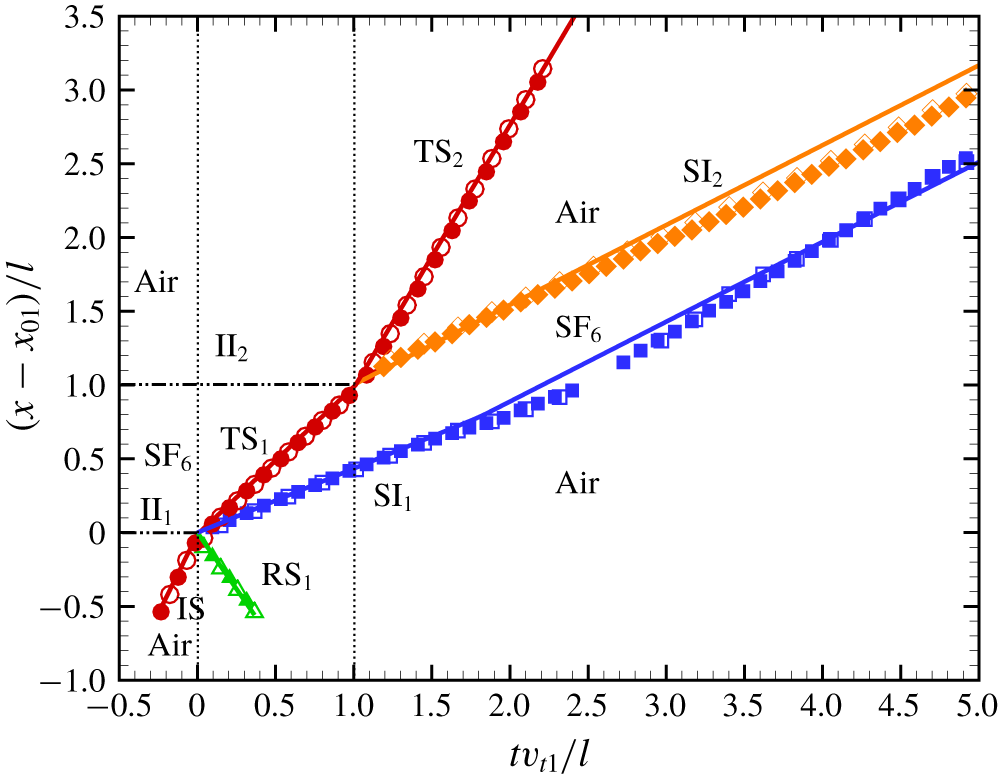
One-dimensional  $t$–
 $x$ diagrams. Solid and hollow symbols represent the measurements from the 1-D#1 and 1-D#2 cases, respectively. Solid lines represent the theoretical results calculated by 1-D gas dynamics theory. Horizontal dash-dot-dotted lines represent the positions of the II1 and II2, and vertical dotted lines represent the times when shock impacts the II1 and II2.

The 1-D interaction is illustrated by means of the pressure–material velocity ( $p$–
 $u$) shock polar analysis, as shown in figure 4, in which the interaction of the IS with the first interface, the interaction of the TS1 with the second interface, and the interaction of the RW2 with the SI1 are given. Figure 5 shows the dimensionless
 $t$–
 $x$ diagram of interfaces and waves for the 1-D cases. The time is normalized as
 $tv_{t1}/l$ and the displacement is scaled as
 $(x-x_{01})/l$, where
 $x$ is the displacement of interfaces/waves,
 $x_{01}$ is the upstream point position of the II1 and
 $v_{t1}$ is the velocity of the TS1. Therefore, the dimensionless times of 0 and 1 represent the moments when the II1 and II2 are shocked, respectively. The shock polar gives the theoretical state at the instant of the interaction while the
 $t$–
 $x$ diagram gives an idea of how this ideal initial state damps. For the first interface, after dimensionless time of 1.6, the velocity of the SI1 increases because of the RW2 acceleration. The motion of the SI1 in experiments is well predicted by 1-D gas dynamics theory, which verifies that the RS2 has little effect on the SI1 motion. For the shocked second interface, a linear motion is observed, which means the CW acceleration effect is limited. The motion of the SI2 in experiments is slightly slower than the prediction by 1-D gas dynamics theory, because the TS1 is partially reflected from the filaments and thus the energy absorbtion of the SI2 from the TS1 reduces. Eventually, both interfaces approach the same velocity because the waves are away from the layer and the fluid can be regarded as incompressible. Overall, the waves’ effects on the interface motion cannot be ignored.
Schlieren pictures of the gas layer evolution in the DS case are shown in figure 3(b). The interaction of the IS with the II1 is the same as that in the 1-D case. Differently, after the TS1 impacts the perturbed II2, the rippled RW2 with the same phase as the II2 is generated ( $295~\unicode[STIX]{x03BC}\text{s}$). Generally, the heavy fluid (SF6) penetrating into the light fluid (air) is defined as a spike and the light fluid penetrating into the heavy fluid is defined as a bubble. For the second interface, after the TS1 impact, the phase inversion occurs (
 $395~\unicode[STIX]{x03BC}\text{s}$), and the initial bubble of the II2 becomes a spike and the initial spike becomes a bubble. The rippled RW2 impacts the moving SI1, and makes it unstable. This is a gravitational instability driven by the acceleration induced by the rippled reflected waves and the pressure perturbation behind them (Ishizaki et al. Reference Ishizaki, Nishihara, Sakagami and Ueshima1996, Reference Ishizaki, Nishihara, Wouchuk, Shigemori, Nakai, Miyanaga, Azechi and Mima1999). When a rippled rarefaction wave impacts a flat interface, the pressure behind the shock front is lower than that before the shock front; the interface perturbation has an opposite phase to the rarefaction wave (Hahn et al. Reference Hahn, Drikakis, Youngs and Williams2011). As a result, the final phase of the SI1 is opposite to that of the RW2 and is consequently the same as the final phase of the SI2. After the SI1 passes through the position of the II2, its thickness also increases. At late stages the two interfaces of the layer evolve with similar sinusoidal shapes.
Figure 3(c) shows the evolution of the gas layer in the US case. After the IS passes through the II1, a rippled TS1 with the same phase as the II1 moves forwards. Meanwhile, a Mach reflection with a Mach stem (MS) and a pair of triple points (TP) are observed on the TS1 ( $117~\unicode[STIX]{x03BC}\text{s}$). Before the rippled TS1 impacts the II2 (
 $142~\unicode[STIX]{x03BC}\text{s}$), the amplitude of the rippled TS1 (
 $a_{s1}$), defined as half of its width, is measured as
 $6.67\pm 0.14~\text{mm}$ (
 $a_{s1}/\unicode[STIX]{x1D706}=0.111$) from the schlieren picture. After the rippled TS1 impacts the II2, the RW2 has an opposite phase to the TS1. The post-shock amplitude of the SI2 (
 $a_{2}^{+}$) imprinted by the rippled TS1 at
 $242~\unicode[STIX]{x03BC}\text{s}$ is measured as
 $2.36\pm 0.56~\text{mm}$ (
 $a_{2}^{+}/\unicode[STIX]{x1D706}=0.039\pm 0.009$), satisfying the small perturbation hypothesis. The perturbation on the SI2 inherits the same phase as the TS1 and develops gradually. Phase inversion does not occur. A cavity is observed at the bubble centre of the SI2 (
 $242~\unicode[STIX]{x03BC}\text{s}$), and its penetration depth increases gradually. A cavity was also observed in gas curtain experiments (Orlicz et al. Reference Orlicz, Balakumar, Tomkins and Prestridge2009), which is driven by the high pressures behind the MS (Liang et al. Reference Liang, Ding, Zhai, Si and Luo2017; Zou et al. Reference Zou, Liu, Liao, Zheng, Zhai and Luo2017). A counter-rotating vortex pair appears at the cavity after
 $392~\unicode[STIX]{x03BC}\text{s}$. The bubble of the SI1 finally collides with the spike of the SI2 (
 $923~\unicode[STIX]{x03BC}\text{s}$) and the gas layer evolves into an ‘upstream mushroom’ shape as reported previously (Budzinski et al. Reference Budzinski, Benjamin and Jacobs1994; Jacobs et al. Reference Jacobs, Jenkins, Klein and Benjamin1995; Mikaelian Reference Mikaelian1996).
Figures 3(d) and 3(e) show schlieren pictures of the gas layer evolutions in the IP and AP cases, respectively. Only the relative phase of the layer is different between the two cases such that the phase effect on the layer evolution is highlighted. The time of the rippled TS1 impacting the II2 ( $198~\unicode[STIX]{x03BC}\text{s}$) in the IP case is delayed relative to the AP case (
 $148~\unicode[STIX]{x03BC}\text{s}$). The reflected waves from the II2 share the same phase as the II1 in the IP case but share an opposite phase to the II1 in the AP case. After the TS2 leaves the second interface, the SI2 perturbation in the IP case inverts phase, but the phase inversion has completed in the AP case. Relative to the US case, the head of the cavity is more circular in the IP case. Moreover, because the TS1 has an opposite phase to the II2 in the AP case, more vorticity is deposited, resulting in a faster evolution of the SI2. At
 $373~\unicode[STIX]{x03BC}\text{s}$, the head of the cavity exceeds the spike tip of the SI2 and becomes a new spike tip. In the IP case, the bubble of the SI1 collides with the bubble of the SI2 (
 $923~\unicode[STIX]{x03BC}\text{s}$) and the layer finally evolves into a ‘bow and arrow’ shape, which has never been observed in previous work. In the AP case, the bubble of the SI1 collides with the spike of the SI2 (
 $917~\unicode[STIX]{x03BC}\text{s}$) and the layer finally evolves into a ‘sinuous’ shape as reported previously (Jacobs et al. Reference Jacobs, Klein, Jenkins and Benjamin1993, Reference Jacobs, Jenkins, Klein and Benjamin1995; Budzinski et al. Reference Budzinski, Benjamin and Jacobs1994; Mikaelian Reference Mikaelian1996).
4 Amplitude growth of the fluid layer
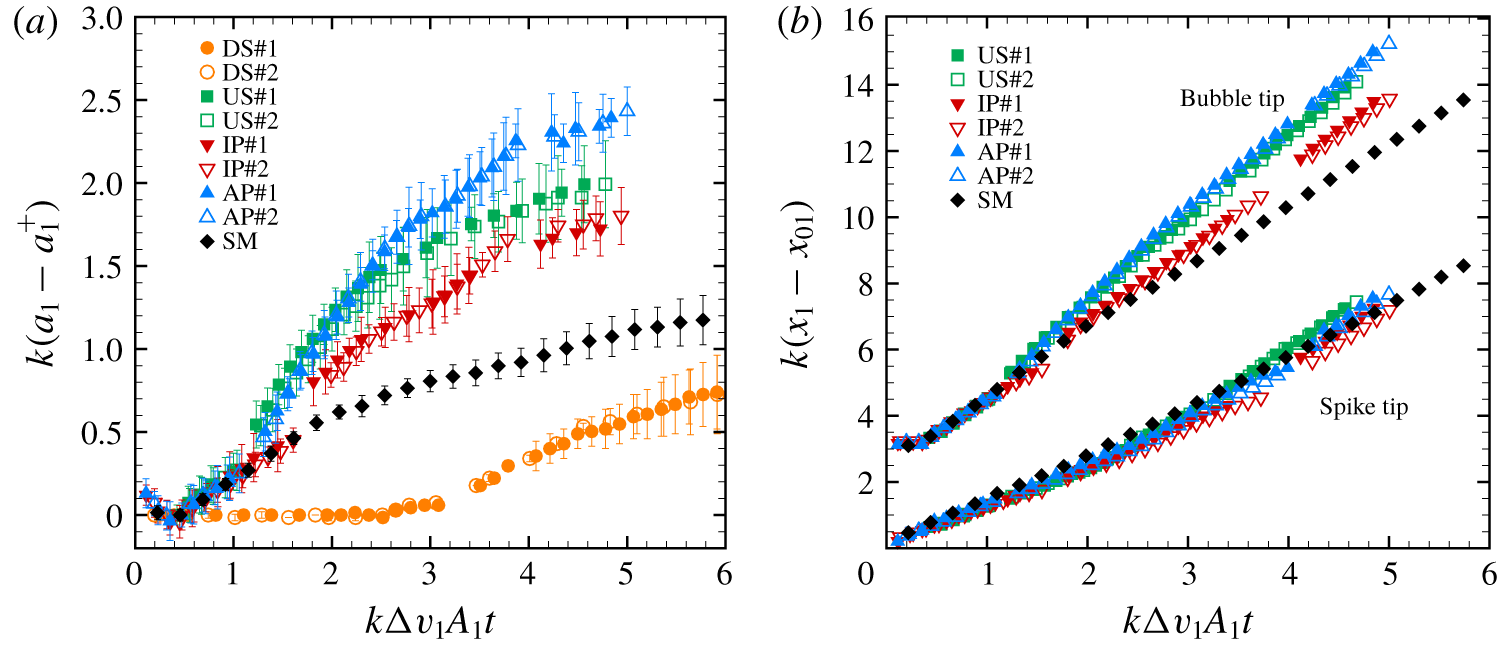
Time variations of the first interface amplitude in dimensionless form for four cases are shown in figure 6(a). The centre of the material interface in schlieren pictures is considered as the interface boundary, and the error bar is half of the interface thickness. The time is normalized by  $k\unicode[STIX]{x0394}v_{1}A_{1}$ and the amplitude is scaled as
 $k(a_{1}-a_{1}^{+})$, where
 $a_{1}^{+}$ is the post-shock amplitude when the SI1 can be observed in experiments. The values of
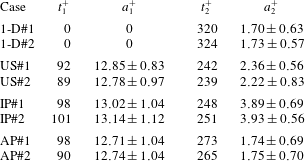
 $a_{1}^{+}$ and the corresponding time
 $t_{1}^{+}$ for the cases are provided in table 2. In the DS case, the first interface is still planar before the RW2 impact (dimensionless time
 ${\sim}2.35$). In the other three cases, the first interface amplitudes are amplified after the RW2 impact (dimensionless time
 ${\sim}1.2$ in the US and AP cases and dimensionless time
 ${\sim}1.5$ in the IP case), and they are larger than that in the single-mode case with the same initial amplitude and wavelength obtained from our previous work (Liang et al. Reference Liang, Zhai, Ding and Luo2019). This fact shows that the waves moving between interfaces have a great effect on the first interface evolution.
Comparisons of (a) the dimensionless amplitude of the first interface and (b) the dimensionless displacements of spike and bubble tips of the first interface. ‘SM’ means the result from the single-mode interface evolution.

Values of  $t_{n}^{+}$ and
 $a_{n}^{+}$ in cases with
 $n$ being 1 or 2 for the first or second interface, and the units are
 $\unicode[STIX]{x03BC}\text{s}$ and mm, respectively.

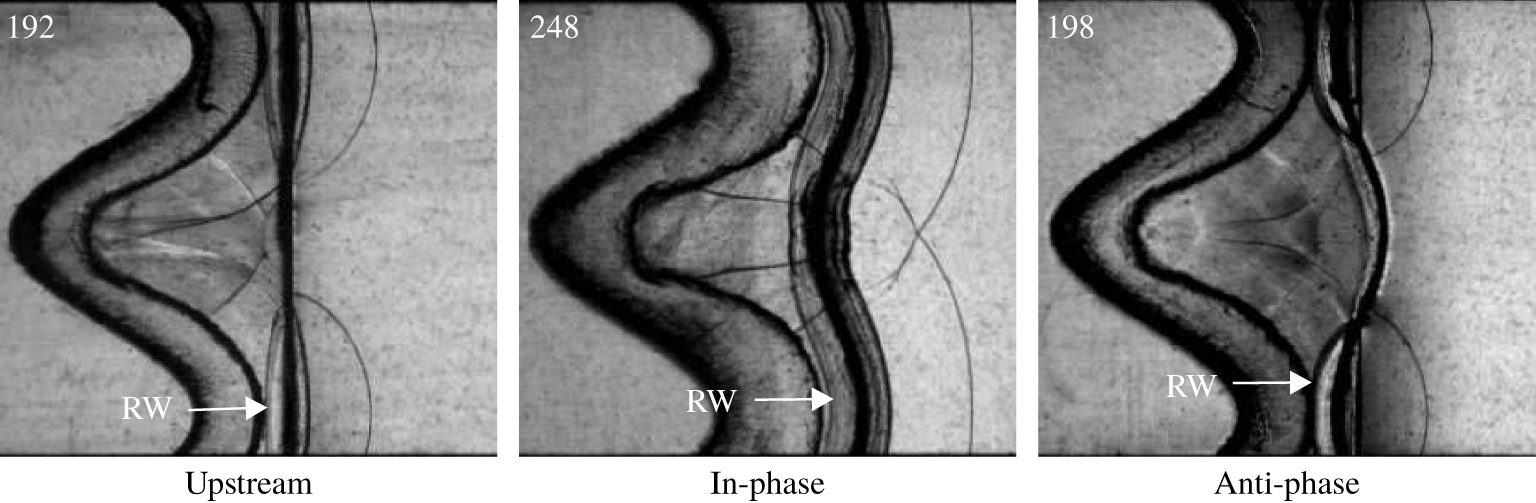
Figure 6(b) shows the time variations of the dimensionless displacements of the spike and bubble tips on the first interface. Relative to the single-mode case, the bubble tip movement is accelerated in the US, AP and IP cases generally after the RW2 impact. The velocities of the bubble tip in the US and AP cases are even larger than those in the IP case. Note that in the US and AP cases the RW2 shares an opposite phase to the first interface, while in the IP case the RW2 has the same phase as the first interface. Relative to the IP case, the non-collinearity of the first interface with the RW2 is more prominent in the UP and AP cases, as shown in figure 7, and more vorticity is deposited on the bubble. The acceleration of the bubble tip from light fluid into heavy fluid also causes the occurrence of RT instability.
Schlieren pictures of the gas layer when the RW2 impacts the first interface for different settings.

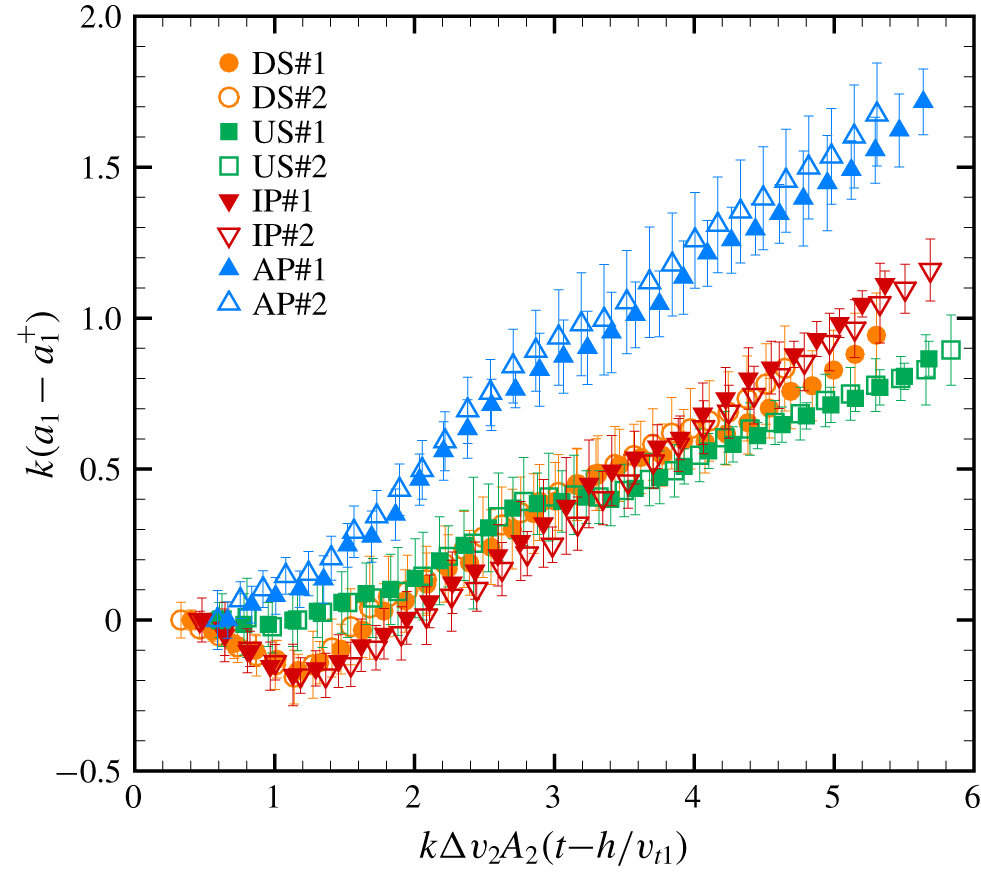
Time variations of the second interface amplitude are shown in figure 8. The time is normalized by  $k\unicode[STIX]{x0394}v_{2}A_{2}$ and the amplitude is scaled as
 $k(a_{2}-a_{2}^{+})$. The values of
 $a_{2}^{+}$ and the corresponding time
 $t_{2}^{+}$ for cases are listed in table 2. The amplitudes in both the DS and IP cases reduce first because of phase inversion. The amplitude in the US case increases from the beginning because the phase inversion is absent there. For the AP case, the phase inversion process has completed before the TS2 leaves the second interface, and the amplitude reduction cannot be captured due to the limitation of the temporal resolution. The amplitudes of the second interface are similar in both the DS and IP cases, which means the rippled TS1 has a similar effect on the second interface to the planar TS1 because the rippled TS1 shares the same phase as the second interface. The smallest amplitude growth rate is observed in the US case, which indicates that little vorticity is deposited on the planar interface by the rippled TS1. The largest amplitude growth rate is observed in the AP case because the rippled TS1 with an opposite phase to the second interface deposits more vorticity on the interface. The interface coupling effect may also induce a larger growth, which will be discussed later.
Comparison of the dimensionless amplitude of the second interface.

5 Linear and nonlinear theories
For a gas layer containing three kinds of gas in the present study, Mikaelian (Reference Mikaelian1985, Reference Mikaelian1995) proposed a linear model (MIK model) to quantify the interface coupling effect on amplitude growth rates of two interfaces. The MIK model also considers the effects of initial amplitudes, wavelengths, the relative phases of the two interfaces and the thickness of the layer on interface coupling. The MIK model can be written as follows:
 $$\begin{eqnarray}\displaystyle \left.\begin{array}{@{}c@{}}\displaystyle \frac{\text{d}a_{1}}{\text{d}t}=\frac{\unicode[STIX]{x0394}v_{1}\unicode[STIX]{x1D6F1}^{2}}{\cos \unicode[STIX]{x1D703}}(a_{01}-a_{02}\sin \unicode[STIX]{x1D703}),\\ \displaystyle \frac{\text{d}a_{2}}{\text{d}t}=-\frac{\unicode[STIX]{x0394}v_{2}\unicode[STIX]{x1D6F1}^{2}}{\cos \unicode[STIX]{x1D703}}(a_{02}-a_{01}\sin \unicode[STIX]{x1D703}),\end{array}\right\} & & \displaystyle\end{eqnarray}$$
where
 $$\begin{eqnarray}\displaystyle \left.\begin{array}{@{}c@{}}\displaystyle \unicode[STIX]{x1D6F1}^{2}\equiv k(R-1)/[1+R^{2}+2R\coth (kh)]^{1/2},\\ \displaystyle \sin \unicode[STIX]{x1D703}=(2W_{1}/W_{2})/[1+(W_{1}/W_{2})^{2}],\\ \displaystyle (W_{1}/W_{2})_{\pm }=1+ST+(S/R)[1+(R-1)/\unicode[STIX]{x1D712}_{\pm }],\\ \displaystyle R=\unicode[STIX]{x1D70C}_{2}/\unicode[STIX]{x1D70C}_{1}~(=\unicode[STIX]{x1D70C}_{2}/\unicode[STIX]{x1D70C}_{3}),\quad \unicode[STIX]{x1D712}_{\pm }=[-b\pm (b^{2}-4ac)]/2a,\\ \displaystyle a=(1+ST)(\unicode[STIX]{x1D70C}_{1}+\unicode[STIX]{x1D70C}_{3})+S(\unicode[STIX]{x1D70C}_{2}+\unicode[STIX]{x1D70C}_{1}\unicode[STIX]{x1D70C}_{3}/\unicode[STIX]{x1D70C}_{2}),\\ \displaystyle b=-(1+S+ST)(\unicode[STIX]{x1D70C}_{3}-\unicode[STIX]{x1D70C}_{1}),\\ \displaystyle c=S(\unicode[STIX]{x1D70C}_{3}+\unicode[STIX]{x1D70C}_{1})-S(\unicode[STIX]{x1D70C}_{2}+\unicode[STIX]{x1D70C}_{1}\unicode[STIX]{x1D70C}_{3}/\unicode[STIX]{x1D70C}_{2}),\quad S\equiv \sinh (kh),\\ \displaystyle S\equiv \sinh (kh),\quad T\equiv \tanh (kh/2),\end{array}\right\} & & \displaystyle\end{eqnarray}$$
with  $\unicode[STIX]{x1D712}_{+}$ and
 $\unicode[STIX]{x1D712}_{-}$ for the first and second interface growths, respectively. The MIK model shows that the amplitude growth rate of one interface is influenced by the amplitude, wavelength and phase of the other interface because of the interface coupling effect. One can also conclude that both
 $\text{d}a_{1}/\text{d}t$ and
 $\text{d}a_{2}/\text{d}t$ are enlarged when the phases of the two interfaces are opposite, and thus the largest amplitude growth rates of the two interfaces are observed in the AP case.
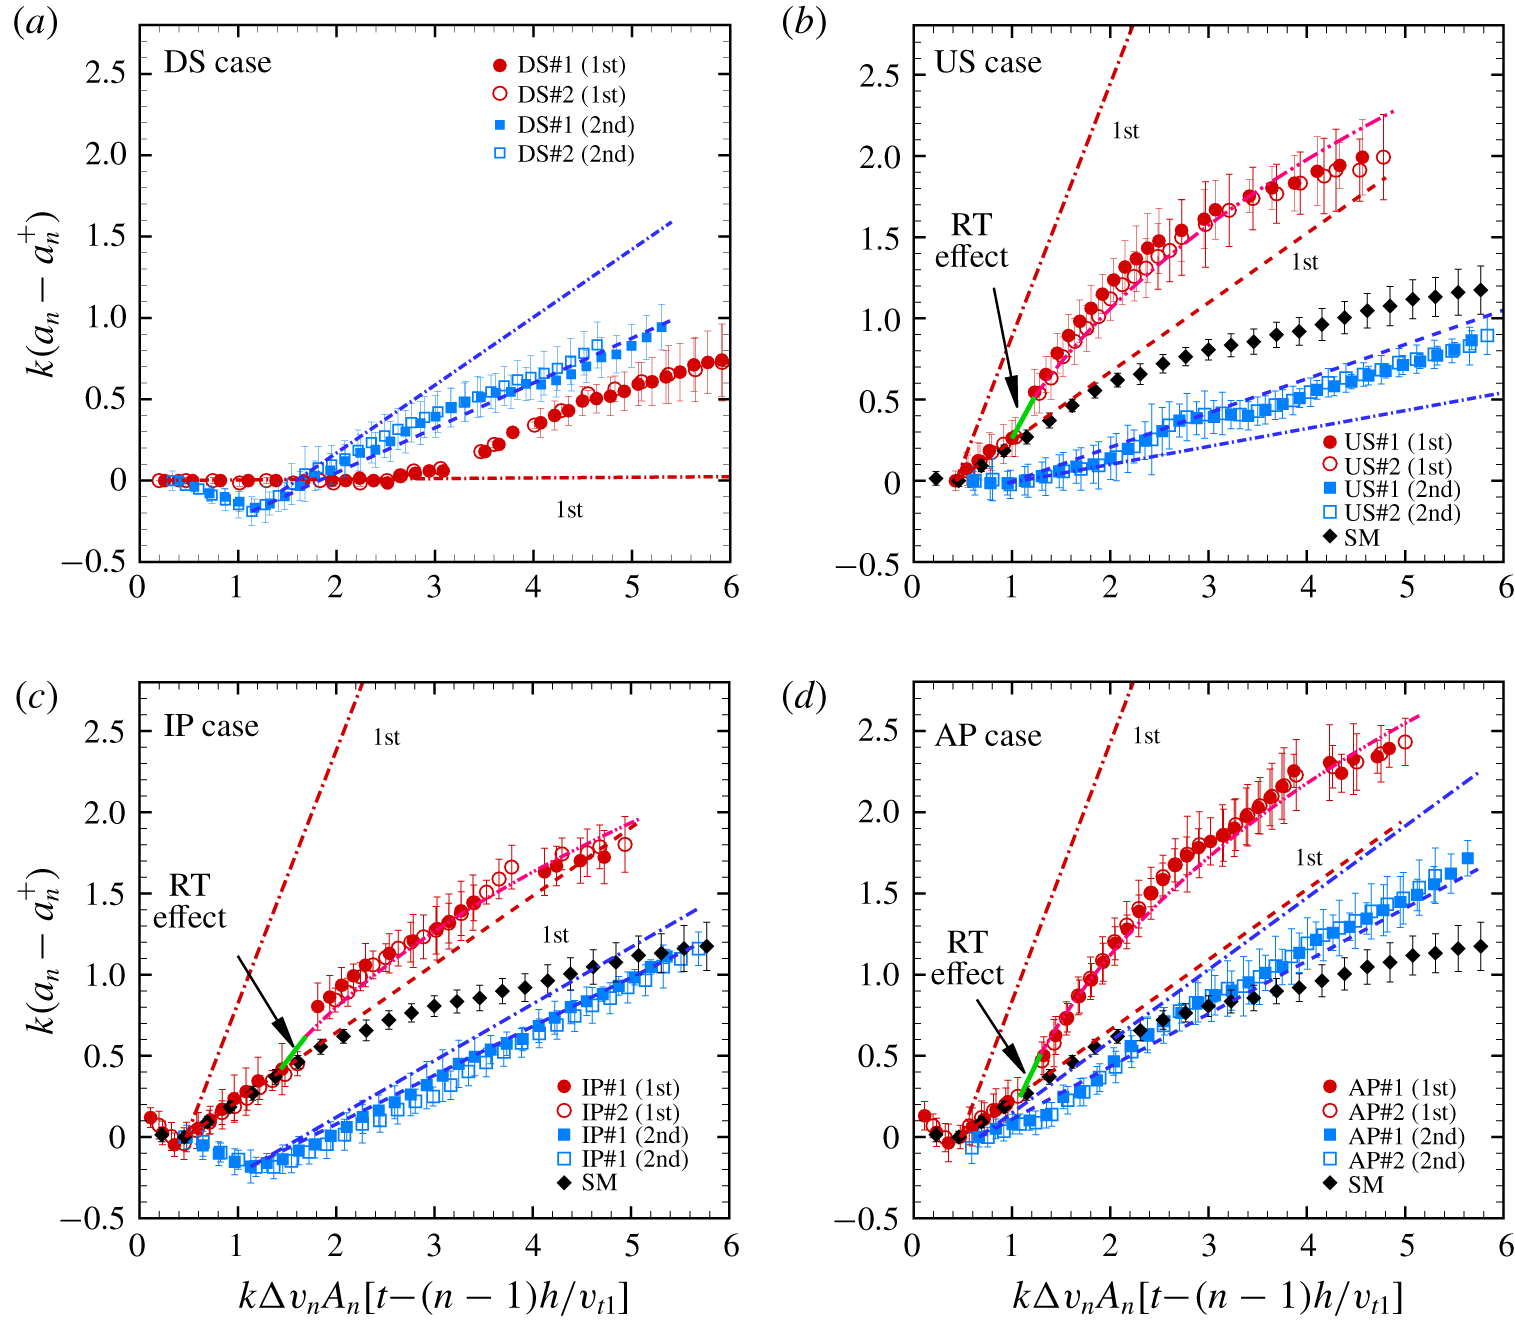
Comparison of the dimensionless amplitudes of two interfaces between experiments and predictions. Dash-dotted (dashed) lines represent the predictions from the MIK (mMIK) model. Solid (dash-dot-dotted) lines represent the first interface amplitude growth predicted by the ZGRT (ZGRM) model. The 1st and 2nd in the legends represent the first and second interface, respectively. The value of  $n$ is 1 or 2 for the first or the second interface, respectively.

The predictions of the amplitude growths of the first (second) interface from the MIK model after phase inversion are shown in figure 9(a–d). For the DS case, the prediction for the first interface agrees well with the experimental result before the RW2 arrival. Subsequently, the MIK model cannot predict the first interface amplitude growths well because it cannot deal with the shock/rarefaction waves’ effects. The second interface growth rate is overestimated by the MIK model because the amplitude of the second interface after the TS1 impact is smaller than the initial one. For the other three cases, the MIK model overestimates the first interface growth, which is ascribed to ignoring the secondary compression effect because of the high initial amplitude of the first interface (Rikanati et al. Reference Rikanati, Oron, Sadot and Shvarts2003; Jourdan & Houas Reference Jourdan and Houas2005; Dell, Stellingwerf & Abarzhi Reference Dell, Stellingwerf and Abarzhi2015). For the US case, the MIK model underestimates the second interface growth due to ignoring the weak vorticity induced by the rippled TS1. For the IP and AP cases, however, the MIK model overestimates the amplitude growth of the second interface especially for the AP case, because the rippled TS1 has an opposite phase to the second interface and the shock compression effect is stronger. Overall, the prediction by the MIK model deviates from the experiments due to the waves’ effects being ignored.
Experimental parameters for different cases:  $\unicode[STIX]{x1D713}_{1}$ and
 $\unicode[STIX]{x1D713}_{2}$ are reduction factors of the first and second interfaces in the mMIK model, respectively;
 $S_{1}$ is the distance between the average position of the first interface with the second interface position where the RW2 is first reflected;
 $S_{2}$ is the length between the head and the tail of the RW2 when the RW2 impacts the average position of the first interface;
 $c$ is the local sound speed behind the TS1;
 $\unicode[STIX]{x0394}t$ is the duration of the interaction of the RW2 with the first interface;
 $g$ is the acceleration imposed on the first interface by the RW2;
 $\unicode[STIX]{x0394}v_{1}^{\ast }$ is the motion velocity of the first interface after the RW2 impact; and
 $\unicode[STIX]{x1D719}$ is the accession factor for the first interface in the ZGRM model.

In this work, the shock compression effect and the secondary compression effect on amplitude growth are considered. The suppression effect of the IS on the first interface is considered by replacing  $a_{01}$ with
 $a_{1}^{+}$ according to the impulsive theory (Richtmyer Reference Richtmyer1960). The suppression effect of the TS1 on the second interface is considered by replacing
 $a_{02}$ with the average of
 $a_{2}^{+}$ and
 $a_{02}$ according to the modified impulsive theory (Meyer & Blewett Reference Meyer and Blewett1972). The secondary compression effect on the evolution of the interface with high initial amplitude is considered by introducing a reduction factor (
 $\unicode[STIX]{x1D713}$) to modify the initial amplitude growth rate (Buttler et al. Reference Buttler, Oró, Preston, Mikaelian, Cherne, Hixson, Mariam, Morris, Stone and Terrones2012; Luo et al. Reference Luo, Dong, Si and Zhai2016; Liang et al. Reference Liang, Zhai, Ding and Luo2019). Then the modified MIK model (mMIK model) considering the compression effect can be written as
 $$\begin{eqnarray}\displaystyle \left.\begin{array}{@{}c@{}}\displaystyle \frac{\text{d}a_{1}}{\text{d}t}=\frac{\unicode[STIX]{x1D713}_{1}\unicode[STIX]{x0394}v_{1}\unicode[STIX]{x1D6F1}^{2}}{\cos \unicode[STIX]{x1D703}}(a_{1}^{+}-a_{02}\sin \unicode[STIX]{x1D703}),\\ \displaystyle \frac{\text{d}a_{2}}{\text{d}t}=-\frac{\unicode[STIX]{x1D713}_{2}\unicode[STIX]{x0394}v_{2}\unicode[STIX]{x1D6F1}^{2}}{\cos \unicode[STIX]{x1D703}}\left[\frac{a_{02}+a_{2}^{+}}{2}-a_{1}^{+}\sin \unicode[STIX]{x1D703}\right],\end{array}\right\} & & \displaystyle\end{eqnarray}$$
where  $\unicode[STIX]{x1D713}_{1}$ and
 $\unicode[STIX]{x1D713}_{2}$ are reduction factors of the first and second interface growth rates, respectively, and the values are acquired from our previous work (Liang et al. Reference Liang, Zhai, Ding and Luo2019), as given in table 3. The amplitude predictions from the mMIK model of the first (second) interfaces in different cases are shown in figure 9(a)–(d) with dashed lines. For the second interface growth, the mMIK model gives a reasonable prediction for all cases, which indicates that the effects of the CW and RT stabilization on the second interface evolution can be ignored. For the first interface growth, the mMIK model also works well in the linear stage. After the RW2 impact, the first interface is accelerated, which means RT instability induced by the non-uniform flow behind the RW2 accelerates the interface evolution, and thus the mMIK model loses efficacy. Therefore, it is imperative to consider the effect of RT instability induced by the RW2 on the first amplitude growth.
Schematics of wave patterns inside the fluid layer at the moments when (a) the TS1 impacts the II2 and (b) the RW2 head impacts the SI1.

Zhang & Guo (Reference Zhang and Guo2016) proposed nonlinear models to predict the single-mode amplitude growths in RT instability (ZGRT model) and RM instability (ZGRM model) considering the universal curves of all spikes and bubbles at any density ratio, respectively. In this work, the effect of RT instability induced by the RW2 on the first interface is considered. The expression of the ZGRT model is written as
 $$\begin{eqnarray}\frac{\text{d}v}{\text{d}t}=-\unicode[STIX]{x1D6FC}k(v^{2}-v_{qs}^{2}),\end{eqnarray}$$
where
 $$\begin{eqnarray}\unicode[STIX]{x1D6FC}=\frac{3}{4}\frac{(1+A)(3+A)}{[3+A+\sqrt{2}(1+A)^{1/2}]}\frac{[4(3+A)+\sqrt{2}(9+A)(1+A)^{1/2}]}{[(3+A)^{2}+2\sqrt{2}(3-A)(1+A)^{1/2}]}\end{eqnarray}$$
and
 $$\begin{eqnarray}v_{qs}=\left(\frac{Ag}{3k}\frac{8}{(1+A)(3+A)}\frac{[3+A+\sqrt{2}(1+A)^{1/2}]^{2}}{[4(3+A)+\sqrt{2}(9+A)(1+A)^{1/2}]}\right)^{1/2}.\end{eqnarray}$$
The unknown parameters include the acceleration  $g$ and the duration (
 $\unicode[STIX]{x0394}t$) of the interaction between the RW2 and the first interface.
As shown in figure 10(a),  $S_{1}$ is defined as the distance between the average position of the first interface and the position of the second interface where the RW2 is first reflected. The
 $S_{1}$ values obtained from the experiments as shown in table 3 in the US and AP cases are smaller than that in the IP case because the RW2 is first reflected from the bubble tip or flat portion of the second interface in the former two cases, but from the spike tip of the second interface in the latter case. Relative to the first interface, the RW2 moves towards the first interface with the local sound speed
 $c$ behind the TS1. The time interval (
 $\unicode[STIX]{x1D6FF}t$) when the RW2 meets the first interface is calculated as
 $\unicode[STIX]{x1D6FF}t=S_{1}/c$. The length between the head and the tail of the RW2 (
 $S_{2}$), as shown in figure 10(b), is calculated as
 $S_{2}=(\unicode[STIX]{x1D6FE}+1)(\unicode[STIX]{x0394}v_{2}-\unicode[STIX]{x0394}v_{1})\unicode[STIX]{x1D6FF}t/2$ based on 1-D gas dynamics theory, where
 $\unicode[STIX]{x1D6FE}$ is the specific heat ratio of the test gas inside the layer. Inspired by the work of Morgan, Likhachev & Jacobs (Reference Morgan, Likhachev and Jacobs2016) we assume that the RW2 accelerates the first interface in a short period with a constant acceleration
 $g$, and therefore
 $\unicode[STIX]{x0394}t$ and
 $g$ are calculated as
 $$\begin{eqnarray}\displaystyle & \displaystyle \unicode[STIX]{x0394}t=\frac{2S_{2}}{\unicode[STIX]{x1D6FE}(\unicode[STIX]{x0394}v_{1}-\unicode[STIX]{x0394}v_{2})+\unicode[STIX]{x0394}v_{1}^{\ast }-\unicode[STIX]{x0394}v_{2}+2c}, & \displaystyle\end{eqnarray}$$
 $$\begin{eqnarray}\displaystyle & \displaystyle g=(\unicode[STIX]{x0394}v_{1}^{\ast }-\unicode[STIX]{x0394}v_{1})/\unicode[STIX]{x0394}t, & \displaystyle\end{eqnarray}$$
where  $\unicode[STIX]{x0394}v_{1}^{\ast }$ is the velocity of the first interface after the RW2 impact and is obtained by fitting the experimental results.
The values of the parameters adopted in the ZGRT model are given in table 3. The predictions of RT instability by the ZGRT model are calculated and conjuncted to the end of the first interface linear growth, as shown in figure 9(b–d). The ZGRT model predicts a faster amplitude growth of the first interface in the US, IP and AP cases than the mMIK model. After the RW2 impact, it is deemed that the first interface does not accelerate any more, and RT instability is absent. The nonlinear growth of the first interface is induced by only RM instability. For a single-mode RM instability evolution, the ZGRM model has already been proven effective (Bai, Deng & Jiang Reference Bai, Deng and Jiang2018; Liu et al. Reference Liu, Liang, Ding, Liu and Luo2018a; Zhang, Deng & Guo Reference Zhang, Deng and Guo2018; Liang et al. Reference Liang, Zhai, Ding and Luo2019). The expression of the ZGRM model is written as
 $$\begin{eqnarray}v=\frac{v_{RM}}{1+\unicode[STIX]{x1D6FC}kv_{RM}t},\end{eqnarray}$$
where  $v_{RM}$ is the linear growth rate of the first interface from (5.3),
 $$\begin{eqnarray}v_{RM}=\frac{\unicode[STIX]{x1D719}\unicode[STIX]{x1D713}_{1}\unicode[STIX]{x0394}v_{1}^{\ast }\unicode[STIX]{x1D6F1}^{2}}{\cos \unicode[STIX]{x1D703}}(a_{1}^{+}-a_{02}\sin \unicode[STIX]{x1D703}).\end{eqnarray}$$
Note that  $\unicode[STIX]{x0394}v_{1}$ in (5.3) should be replaced by
 $\unicode[STIX]{x0394}v_{1}^{\ast }$ because of the RW2 acceleration effect (the growth rate of the first interface after the RW2 acceleration is considered as an initial value). An empirical accession factor
 $\unicode[STIX]{x1D719}$ (as given in table 3) is proposed to represent the amplitude growth rate enlargement induced by the RW2. Note that the empirical accession factor
 $\unicode[STIX]{x1D719}$ is a fitting coefficient to adjust the growth rate enlargement for each individual case. Because the RW2 is rippled and analytical solutions for the vorticity deposition induced by rippled rarefaction waves are lacking, it is difficult to obtain the theoretical value of
 $\unicode[STIX]{x1D719}$ with the known initial conditions. The value of
 $\unicode[STIX]{x1D719}$ is the largest in the AP case and it is the smallest in the IP case, which coincide with the analysis of vorticity deposition on the first interface. It is seen that the ZGRM model predicts the amplitude growths of the first interface well in nonlinear stages in the US, IP and AP cases, as shown in figure 9(b–d). For the planar first interface in the DS case, both ZGRT model and ZGRM model are not applicable. The perturbation growth of the planar first interface seeded by rippled rarefaction waves needs further studies.
6 Conclusions
Shock-tube experiments on Richtmyer–Meshkov instability of a SF6 gas layer surrounded by air are performed to evaluate the interface coupling effect and waves’ effect on the fluid layer evolution. Five kinds of SF6 layer with corrugations either on one interface or on both interfaces are created by the extended soap film technique such that the shortcomings of the gas curtain are eliminated. Schlieren photography combined with high-speed video camera exhibit legible experimental pictures. Shocks/rarefaction waves going back and forth inside the fluid layer are identified.
The interface motion and wave patterns in the 1-D gas layer case are discussed. The filaments used to constraint the soap film interface reflect an additional shock which will not affect the flow greatly. After the rarefaction waves reflected from the second interface impact, the first interface is accelerated. As a result, the waves inside the fluid layer are not negligible. For the layer with only the second interface corrugated, phase inversion occurs after the shock impact. The first interface remains planar until the arrival of reflected waves and it has the same phase as the second one eventually, which is closely related to phase of the rarefaction waves. For the layer where only the first interface is corrugated, the initial planar second interface inherits perturbation from the rippled transmitted shock and becomes unstable. The gas layer finally evolves into an ‘upstream mushroom’ structure, which has also been observed in previous work. For the layer with both interfaces corrugated, the effect of relative phase between the two interfaces on the layer evolution is highlighted by imposing the same phase or opposite phase to both interfaces. The phase of the second interface determines the phase of the reflected rarefaction waves, and further affects the amplitude growth of the first interface. The results show that the amplitude of the first interface grows faster when the two initial interfaces have opposite phases. The phase of the second interface also determines the direction of the vorticity deposited on the cavity of the second interface. Finally, the layer with the same phase on two interfaces evolves into a ‘bow and arrow’ shape, which is observed for the first time in a shock-tube experiment, while the layer with an opposite phase on the two interfaces evolves into a ‘sinuous’ shape.
The amplitude growths of the two interfaces are obtained from experiments. Both the first and second interfaces in a fluid layer with an opposite phase have the largest amplitude growth among cases, which can be partially explained from the phase difference between the waves and the interfaces. For each case, the linear model proposed by Mikaelian (Reference Mikaelian1985, Reference Mikaelian1995) is adopted to predict the linear amplitude growth, and it is found to be invalid because the compression effects were ignored. By considering the shock compression effect and the secondary compression effect for high initial amplitudes, a modified linear model is proposed, which can well predict the first interface amplitude growth before the arrival of the reflected rarefaction waves. In early nonlinear stages, the effect of Rayleigh–Taylor instability induced by the rarefaction waves on the first interface amplitude growth can be well evaluated by the model developed by Zhang & Guo (Reference Zhang and Guo2016). This model can also predict the late Richtmyer–Meshkov instability development of the first interface. It is the first time in experiments to quantify the interfacial instability induced by the rarefaction waves inside the heavy fluid layer.
Although five types of layer have been investigated in this work, there are many more possible situations by varying shape, phase, amplitude, thickness and gas type. The initial conditions have great effects on the fluid layer evolutions and the amplitude growths of two interfaces. The present work only deals with one choice of the interface wavelength, SF6 layer thickness and in-phase or anti-phase surface corrugations. More experiments are desirable to isolate the effects of initial conditions, such as the amplitude, wavelength, thickness of the fluid layer and Atwood number on the fluid layer evolution.
Acknowledgements
This work was supported by the Natural Science Foundation of China (Nos. 11772329, 11625211, 11722222 and 11621202), by the Fundamental Research Funds for the Central Universities, and by the Research Grants Council of Hong Kong (No. GRF 152151/16E).
Declaration of interests
The authors report no conflict of interest.