I. INTRODUCTION
The stability of two-phase alloys under irradiation is often determined by a delicate balance between ballistic mixing effects in cascades, which tend to homogenize the alloy, and radiation-enhanced diffusion, which brings the alloy back toward equilibrium. At low temperature, ion-beam mixing dominates and alloys are often driven to single-phase solid solutions. At higher temperatures, diffusion predominates and the system again becomes two-phase. These two behaviors are now well understood, and it is only the detailed kinetic parameters that require elucidation. Less understood, however, are the synergistic effects of these two dynamics at intermediate temperatures, making predictions of microstructural evolution in this regime far more challenging. Several years ago, for example, Nelson et al. Reference Nelson, Mazey and Hudson1 reported that irradiation of two-phase γ–γ′ Ni–Al alloys in this intermediate temperature regime led to an initial shrinkage of the γ′ precipitates, followed by the surprising result that the precipitates acquired a new, smaller size that remained constant under prolonged irradiation. These experiments were repeated more systematically by Schmitz et al. Reference Schmitz, Ewert, Harbsmeier, Uhrmacher and Haider2 with similar results. More recently it has been reported that similar self-organization reactions occur in a series of immiscible binary Cu alloys. Reference Krasnochtchekov, Averback and Bellon3,Reference Chee, Stumphy, Vo, Averback and Bellon4 In these cases, it was shown, in fact, that the system acquires a well-defined microstructural character in steady state, which is specified by the temperature and ion flux. Reference Krasnochtchekov, Averback and Bellon3,Reference Chee, Stumphy, Vo, Averback and Bellon4 In other words, precipitates that are too large for a given flux shrink in size while those below that characteristic size grow. These findings could have particular importance for designing materials for advanced nuclear reactors, since the microstructure of such self-organizing materials can be stable when subjected to high dose irradiations at elevated temperatures, and possibly they can even self-heal from imperfections introduced during the initial fabrication process.
Theoretical and computer modeling have now provided the basis for understanding these experiments, namely the different length scales in the relocation distances of the two dynamics. Consider, for example, if the atomic relocation distances in cascades were the same as for thermal diffusion, one atomic distance. Then, depending on the irradiation flux and temperature, one process or the other will dominate, and the precipitates will either grow or shrink.
Reference Martin and Bellon5
In most cases, however, the displacement distances in cascades, R, are larger, a few interatomic distances.
Reference Averback and de la Rubia6,Reference Enrique, Nordlund, Averback and Bellon7
For instance, in a Cu50Ag50 solid solution, molecular dynamic simulations indicated that 1 MeV Kr ion irradiation would generate a nearly exponential distribution of relocation distances with a decay length R = 3.08 Å = 1.13 a
nn, where a
nn is the nearest neighbor distance.
Reference Enrique, Nordlund, Averback and Bellon7
A consequence of this finite range mixing is that the effect of ballistic mixing on compositional inhomogeneity is scale dependent. For a compositional inhomogeneity with a characteristic length scale λ, when
 $\lambda \;\le\; R$
mixing in cascades is ballistic, not diffusive. On the other hand, thermal hopping of atoms via point defects is diffusive, requiring more and more jumps for solute atoms to cross the diffusion field and join the precipitate as the precipitates grow. Thus, diffusive jumps can dominate on small length scales, but ballistic jumps will win out at longer length scales. This has been referred to as the “patterning” regime.
Reference Enrique and Bellon8,Reference Enrique and Bellon9
On very large length scales, λ >> R the atomic relocation process in cascades becomes diffusive, and then the growth or shrinkage of precipitates is simply determined by whether or not thermal diffusion is greater than cascade mixing.
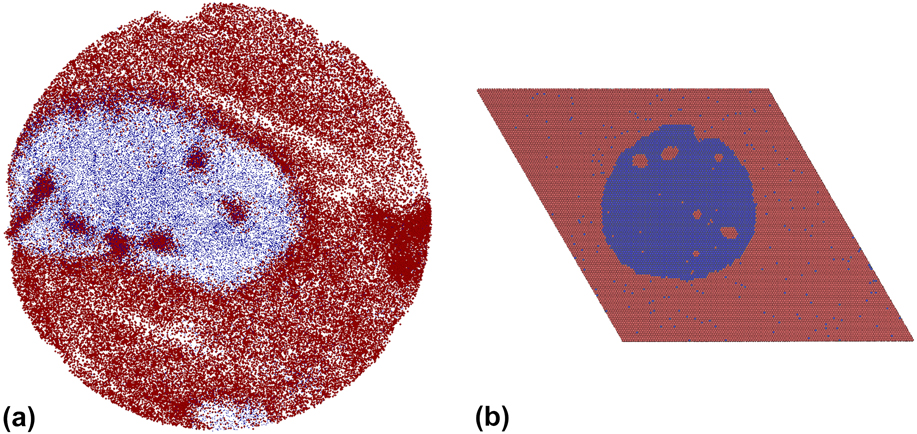
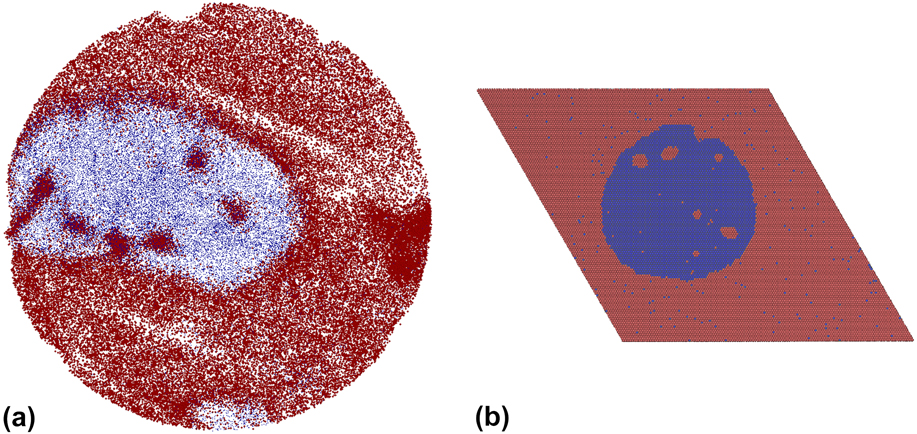
While the origin of such self-organization in irradiated two-phase alloys is understood, rather little experimental work has been reported characterizing the microstructural details of the precipitates that form. Previous work on dilute immiscible Cu alloys has shown, for example, that the nanoprecipitates formed in the patterning regime have high supersaturation of matrix atoms and that they are compositionally inhomogeneous. In one study on Cu–Fe, Reference Stumphy, Chee, Vo, Averback, Bellon and Ghafari10 which used atom probe tomography (APT), it was found, moreover, that at temperatures just above the patterning regime, where Fe precipitates were continuously growing in Cu, small “inner precipitates” of a Cu-enriched phase were observed in the Fe precipitates, as illustrated in Fig. 1(a). These small precipitates were designated as “cherry pits.” Such structures, to our knowledge, have never been observed during thermal precipitation, in the absence of irradiation. This surprising observation in Cu88Fe12 prompted kinetic Monte Carlo (KMC) simulations Reference Shu, Bellon and Averback11 to be carried out on a model A–B alloy. As we detail later, these simulations indicate that cherry-pit structures can form in nominally two-phase alloys, but only under very specific conditions [Fig. 1(b)]. The current work was therefore undertaken to go beyond our preliminary observations in Cu–Fe and with the help of KMC simulations Reference Shu, Bellon and Averback11 develop a systematic understanding of the formation of cherry pits during irradiation. For this, more thorough investigation of cherry-pit formation, we have selected dilute Cu–V alloys. Like Cu–Fe, Cu–V is highly immiscible in the solid state and should show patterning. V, however, is more immiscible in Cu than Fe is, so it is expected that this would facilitate the stabilization of compositional patterns at higher irradiation temperatures than possible in Cu–Fe. Additionally, Cu–V avoids the face centered cubic (FCC)-body centered cubic (BCC) allotropic transformation that occurs in Fe precipitates. This transformation may have played a role in the transition from the patterning regime to the macroscopic growth regime in Cu–Fe since Mossbauer spectroscopy indicated that Fe-rich precipitates in the patterning regime had a FCC structure, whereas electron diffraction established that Fe-rich precipitates in the macroscopic growth regime were BCC. Reference Stumphy, Chee, Vo, Averback, Bellon and Ghafari10
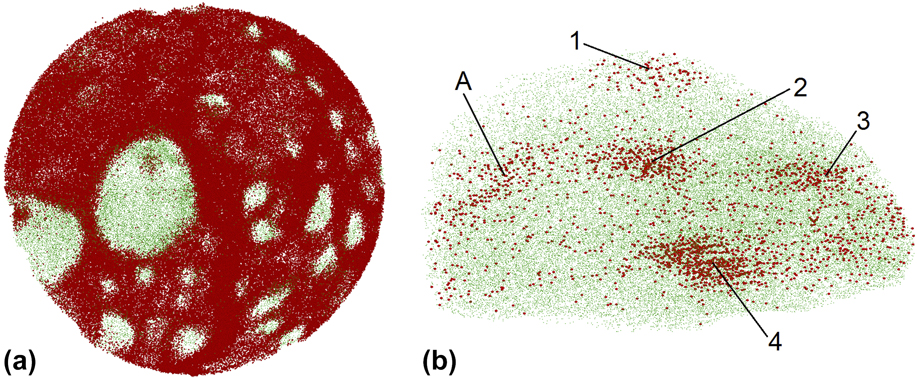
(a) A 1-nm-thick atom reconstruction map of an irradiated Cu88Fe12 APT sample; from Ref. Reference Stumphy, Chee, Vo, Averback, Bellon and Ghafari10. The Fe-rich phase is in the macroscopic phase separation regime, and Cu cherry pits are seen inside of the Fe-rich precipitate. Fe atoms (blue) have been minimized to make the Cu atoms (red) more visible. The diameter of the layer is ∼52 nm. (b) KMC simulation showing a steady-state structure in an A–B model alloy with cherry pits under specified conditions with respect to the behavior of A (red) in B (blue) and B in A; from Ref. Reference Shu, Bellon and Averback11.
II. EXPERIMENTAL METHODS
The methods used for the fabrication, irradiation, and analysis of APT samples were very similar to those previously reported for Cu–Fe in Ref. Reference Stumphy, Chee, Vo, Averback, Bellon and Ghafari10 and so we only briefly describe them here. The samples consisted of Cu–V films that were deposited on the tips of fine W wires. The W wires were first prepared by electropolishing them to form a tip with a radius of <200 nm. Cu1−x V x films, with x ∼0.09 and 0.91, were subsequently deposited on these tips using two independent DC magnetron sputtering guns. The thickness of the films was ≈200 nm. The base pressure of the deposition system was ∼3 × 10⁻⁸ Torr. Irradiations were performed using 1.8 MeV Kr+ ions, which have an implantation range of ∼300 nm, Reference Ziegler, Ziegler and Biersack12 and thus greater than the thickness of the Cu–V films. The current density of the beam was ≈1.4 μA cm−2; this allowed for reasonable irradiation times (≈1 h) while avoiding beam heating. The samples were irradiated “head-on,” i.e., with the axis of the W wire parallel to the ion beam. Irradiations were performed at room temperature (RT) and at four other temperatures in the range of 300–500 °C, with doses up to 3.0 × 10¹⁶ ions cm−2. TRIM calculations Reference Ziegler, Ziegler and Biersack12 indicate that our highest dose corresponds to a damage level of ≈65 displacements per atom. Control specimens were annealed in the same temperature range, but not irradiated. As in past studies Reference Chee, Stumphy, Vo, Averback and Bellon4 we used pre-irradiation step at RT, using a dose of 5.0 × 10¹⁵ ions cm−2. This pretreatment was found in other Cu-based alloys to prevent surface segregation, Reference Krasnochtchekov, Averback and Bellon3,Reference Chee, Stumphy, Vo, Averback and Bellon4 which sometimes occurs during heating without this step. We believe that the segregation occurs by grain boundary diffusion, and that the pre-irradiation at RT induces sufficient grain growth to suppress it. After the irradiation or annealing treatment, the APT samples were sharpened to a final tip radius of 50–60 nm using an FEI Strata DB235 focused ion beam (FEI, Hillsboro, OR). This procedure of sharpening the tips after irradiation was used to minimize any possible influences of the surface.
The atom-probe analysis was performed at Northwestern University Center for Atom Probe Tomography (NUCAPT) using a CAMECA LEAP4000XSi system (CAMECA SAS, Gennevilliers, France). Measurements were performed in the pulsed laser mode with the tip temperature at 65 K and a vacuum of ∼5 × 10⁻¹¹ Torr. The green-wave length laser was set for a pulse energy of 80 pJ and a frequency of 500 kHz. The number of atoms collected from a single tip varied, ranging from 7 million to 50 million atoms. Analyses of the APT data included use of the CAMECA proprietary software IVAS.
III. RESULTS
A. Preliminary data processing
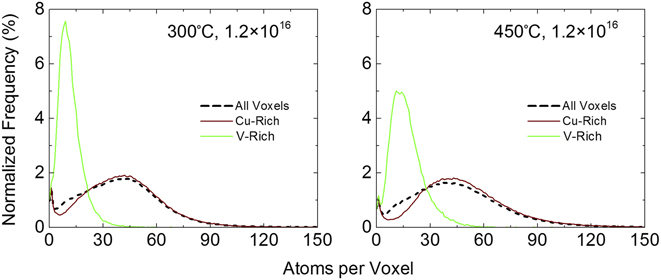
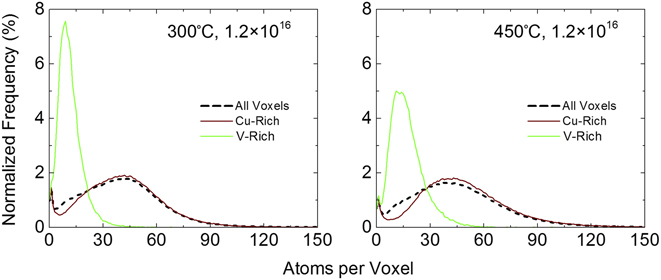
The CAMECA analysis software IVAS, used in conjunction with the LEAP instrument, generates reconstruction files that include the precise locations and chemical identities of atoms in the analyzed specimen volumes. For analysis purposes, coarse grained data are obtained by forming a lattice of cubes, 1 nm on a side, with each cube, or volumetric pixel (voxel), containing information on the total number of atoms in the voxel and the molar fractions of each alloy component. Typical distributions for atomic density are shown in Fig. 2 for two Cu91V9 samples irradiated at different temperatures; here the number of voxels containing n atoms is plotted as a function of n. Three distributions are shown: one that includes all voxels, one that includes only Cu-rich voxels, i.e., voxels with a majority of Cu atoms, and one that includes only V-rich voxels. Elemental Cu and V have atomic densities of 85 and 72 atoms nm−3, respectively. With the detector efficiency of the LEAP being ≈50%, Reference Seidman13 we expected the Cu-rich and V-rich distributions to peak at ∼43 and 36 atoms per voxel, respectively. In Fig. 2, the distributions for Cu-rich voxels peak just below 45 atoms per voxel, as expected. The peaks in the distributions for V-rich voxels, however, are located at or below 15 atoms per voxel, well below the expected value. This low atomic density observed in the V-rich voxels suggests that the evaporation fields of Cu and V are dissimilar. This result is somewhat surprising since the theoretical evaporation field of V, 30 V/nm, Reference Miller, Cerezo, Hetherington and Smith14 is identical to the experimental value reported for Cu, so that the ion trajectories should not show local magnification effects. Reference Marquis and Vurpillot15 Voxels located on the edge of the reconstruction also contribute to the low voxel counts seen in Fig. 2, as some atoms from these voxels were not collected in the detector. Voxels with fewer than 5 atoms were thus omitted from further analyses.
Atomic density distributions for selected tips at two different temperatures. Distributions are shown for all voxels, Cu-rich voxels, and V-rich voxels. The irradiation doses are given in ions per square centimeter.
B. V distribution and precipitate morphology
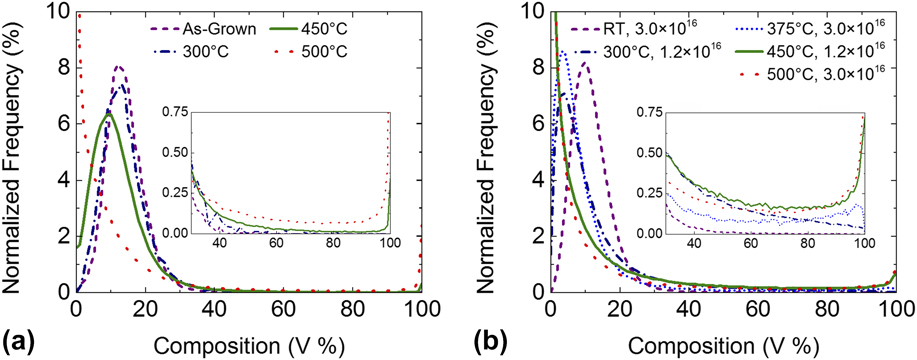
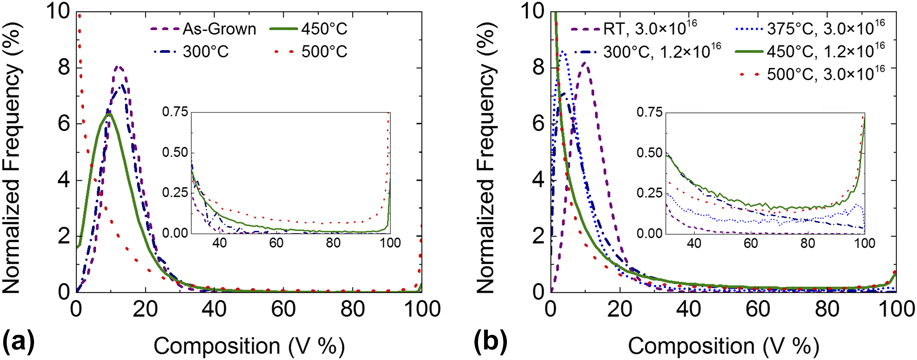
Distributions for the V concentration in voxels in Cu91V9 samples are shown in Fig. 3; Fig. 3(a) shows the annealed samples and Fig. 3(b) the irradiated samples. The as-grown sample [Fig. 3(a)] is slightly V-rich (14% V), but otherwise its distribution is nearly identical to that for the sample irradiated at RT [Fig. 3(b)]. These results demonstrate that irradiation at sufficiently low temperatures does not induce alloy decomposition, contrary to what was observed in the cases of Cu–W and Cu–Mo. Reference Vo, Chee, Schwen, Zhang, Bellon and Averback16 Precipitation of V in Cu thus requires thermally activated diffusion processes, and therefore, Cu–V behaves similarly to Cu–Ag, Cu–Co, Cu–Nb, and Cu–Fe. Reference Chee, Stumphy, Vo, Averback and Bellon4 It is seen in Fig. 3 that irradiated Cu91V9 begins to undergo decomposition at 300 °C, with the peak in the voxel distribution shifting to lower V concentrations. At 450 °C, a second peak develops in the distribution at high V concentrations, and with the Cu matrix becoming nearly pure. For the thermally annealed samples, decomposition is not significant until 500 °C.
Composition histograms for selected Cu91V9 specimens, including (a) an as-grown sample and three thermally annealed samples and (b) five irradiated samples, one at each utilized temperature. The irradiation doses are given in ions per square centimeter.
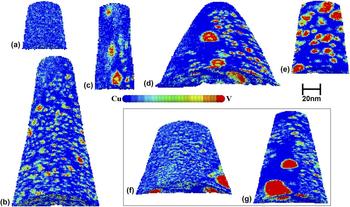
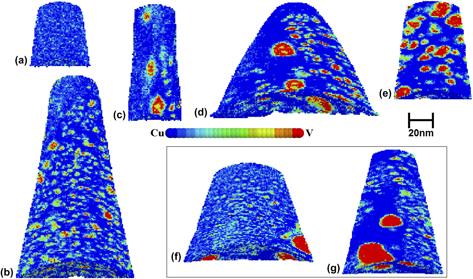
The morphologies of the irradiation-induced precipitates in Cu91V9 are illustrated in the atom probe voxel reconstructions shown in Fig. 4 (from blue, Cu-rich, to red, V-rich). The voxels for the sample irradiated at RT are different shades of blue, indicating a solid solution, as expected based on the V voxel distribution in Fig. 3(b). The sizes of the precipitates increase with increasing temperature. Note that the precipitate “colors” for irradiation at 300 °C are mostly green (∼50 at% V) with few reds (>90 at%). The noteworthy features in these reconstructions, and the focus of this work, are the small “inner” precipitates located within the larger V precipitates for the samples irradiated at 350, 450, and 500 °C. These so-called cherry-pit structures are most numerous at 450 °C. The annealed (but unirradiated) samples have a few large precipitates; these precipitates are nearly pure V, but none contain cherry pits. This suggests that the formation of cherry pits is a nonequilibrium, irradiation-induced phenomenon.
Cross-section slices in the reconstructions of Cu91V9 APT tips showing voxel compositions. The tips shown in (a)–(e) were irradiated under the following conditions: (a) RT, 3.0 × 10¹⁶ ions-cm−2 (8.5% V); (b) 300 °C, 1.2 × 10¹⁶ ions-cm−2 (9.9% V); (c) 375 °C, 3.0 × 10¹⁶ ions-cm−2 (9.6% V); (d) 450 °C, 1.2 × 10¹⁶ ions-cm−2 (10.0% V); (e) 500 °C, 3.0 × 10¹⁶ ions-cm−2 (8.3% V). The tips shown in (f) and (g) were annealed at 450 °C (11.7% V) and 500 °C (8.0% V), respectively. The V concentration given in parenthesis for tips (a–g) corresponds to the concentration measured by APT. The composition color key is composed of 15 distinct colors, meaning each color represents a composition range of 6.67%.

It might be noticed that the shapes and orientation of many of the V precipitates in Figs. 4(b), 4(d), 4(f), and 4(g) appear oblong, or oval-like, depending on the location of the precipitate in the tip. The elongated axes of these precipitates nearly always lie in the tangential plane of the tip surface. This is an artifact of the APT generally observed when there is a difference in the evaporation fields of the two phases, Reference Stumphy, Chee, Vo, Averback, Bellon and Ghafari10,Reference Vurpillot, Bostel and Blavette17,Reference De Geuser, Lefebvre, Danoix, Vurpillot, Forbord and Blavette18 as appears to be the case for the Cu and V phases.
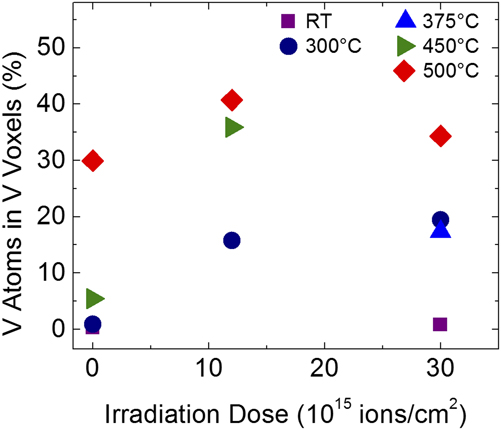
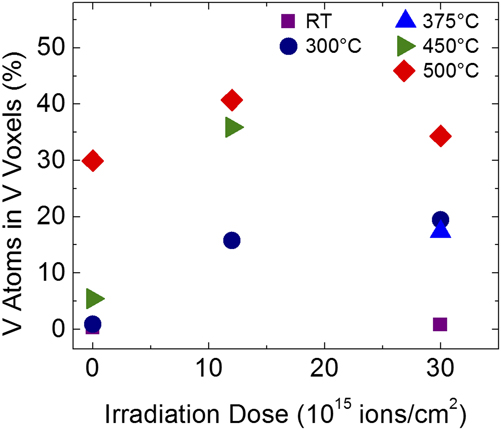
Because many of the V precipitates contain large supersaturations of Cu, we arbitrarily set a cut-off concentration of 50 at% to identify voxels as part of a precipitate or part of the matrix. For grouping voxels into individual precipitates, V-rich voxels sharing faces, edges, or corners (i.e., first, second, or third nearest neighbors) were considered to be part of the same precipitate. Using these conditions, we plot in Fig. 5 the fraction, f, of the total amount of V that is contained in precipitates as a function of ion dose (due to the trajectory aberrations discussed in Sec. III. A, the procedure used here may underestimate the total amount of V that has precipitated but it does not affect the trends reported below). Here it is observed that f increases with increasing temperature. In addition, the data for 300 and 500 °C show that steady-state behavior is achieved after a dose of ∼1 × 10¹⁶ ions cm−2, with f remaining constant at higher doses. We note too that during irradiation at 500 °C, the solubility of V in Cu is ∼6 at%; this is well above the ≈0.003 at% expected for thermal equilibrium. This large supersaturation is a direct indication that irradiation-induced ballistic mixing is effectively competing with thermally activated diffusion, as will be discussed in Sec. IV. While a few larger precipitates are seen in the reconstruction of the sample annealed at 450 °C, Fig. 4(f), the fraction of V that has precipitated is small (f ≈ 5%). By 500 °C, this fraction has increased to ≈30%, Fig. 4(g), and thus comparable to the sample irradiated at that temperature.
Fraction of V, f, contained in precipitates as a function of dose for various temperatures. Data for zero dose correspond to samples annealed at the temperature specified by the symbols.
C. Patterning behavior of V in Cu
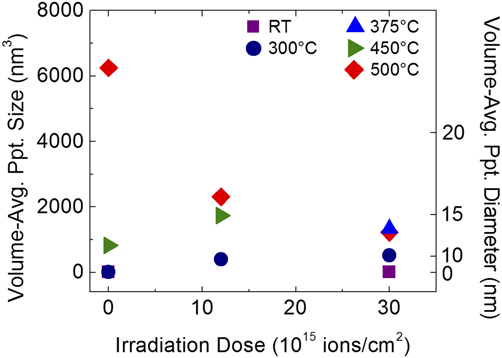
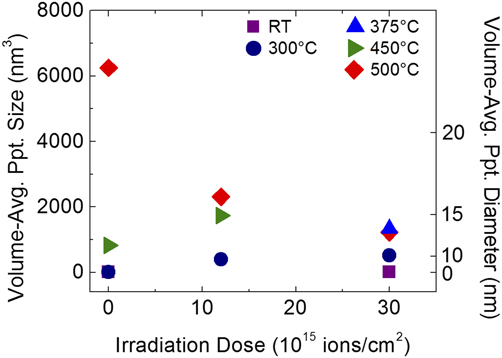
The volume-averaged sizes of the V precipitates are plotted as a function of irradiation dose for the different irradiation temperatures in Fig. 6. For irradiations at 300 °C, the average precipitate size grows only to ≈10 nm for doses above 1 × 10¹⁶ ions cm−2. This appearance of a steady-state size is indicative of the nanoscale patterning previously reported by Chee et al. Reference Chee, Stumphy, Vo, Averback and Bellon4 in other immiscible Cu alloys. Irradiation-induced patterning of V precipitates in Cu remains stable to at least 500 °C, the highest temperature examined. The average sizes of the precipitates in the temperature range of 375–500 °C also remain quite small, <15 nm. Notably, the average precipitate size in the sample annealed at 500 °C, but not irradiated, is larger than 15 nm. Possibly, the ballistic mixing process is competing with thermal precipitation at this temperature to reduce the precipitate size, however, very few precipitates are observed during thermal annealing at 500 °C and so that the statistical significance of this result is unclear. Precipitation at temperatures higher than 500 °C was not studied, as we observed extensive surface segregation of V at 550 °C and higher temperatures.
Volume-average V precipitate sizes for samples irradiated from RT to 500 °C and an as-grown sample. The data for samples irradiated above 300 °C show similar average precipitate sizes, and based on the two irradiation doses analyzed at 500 °C, the alloy is still in the patterning regime at this temperature.
D. Cherry-pit microstructure
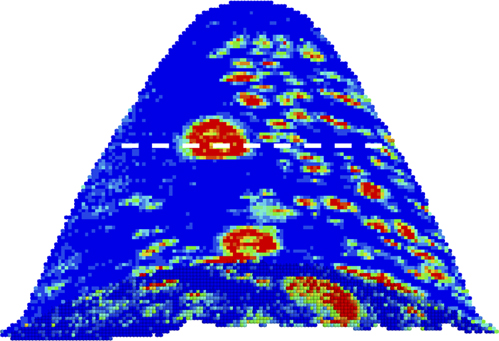
The remarkable new contribution of this work concerns the cherry-pit structures in Cu91V9, which were observed in samples irradiated at 375, 450, and 500 °C. At 500 °C, the Cu-enriched regions inside of the V-rich precipitates are less well defined than those at 375 and 450 °C. However, with only two precipitates having cherry pits within them in the sample irradiated at 375 °C, no statistical analysis could be performed at this temperature. At 450 °C, seven such precipitates were observed, with two of them being present in the cut plane shown in the reconstruction in Fig. 7.
Reconstruction of Cu91V9 sample irradiated at 450 °C to a dose of 1.2 × 10¹⁶ ions-cm−2. The horizontal line corresponds to the x–y plane shown in Fig. 9(a).
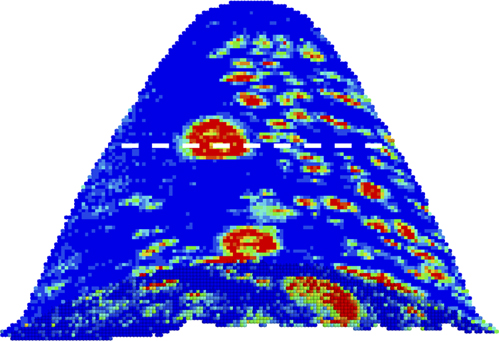
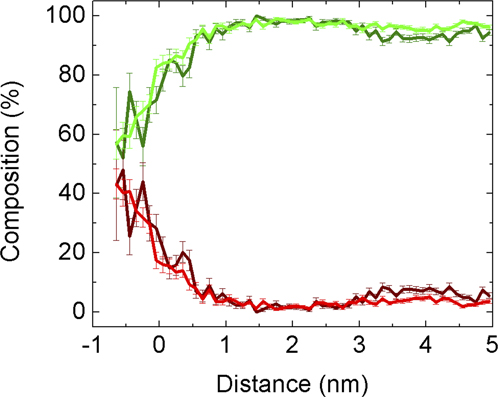
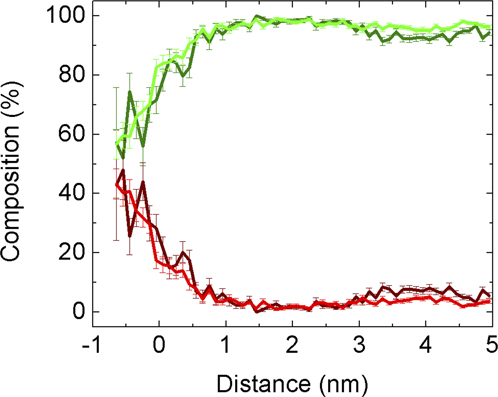
The cherry pits were analyzed by first creating “proximity” histograms Reference Hellman, Vandenbroucke, Rüsing, Isheim and Seidman19 around the cherry pits. These so-called proxigrams are created by first forming isoconcentration contours around the pits and then selecting a particular contour to represent the “interface” concentration. For the two pits observed in the large precipitate denoted by the dotted line in Fig. 7, the maximum Cu concentration is 40 at%; we thus accordingly set 20 at% as the interface concentration. The proxigram is then used to determine the average composition as a function of distance from this interface, as illustrated in Fig. 8. The cherry pits achieve a maximum concentration of just over 40% Cu, although there is some uncertainty in the absolute concentrations due to the different evaporation fields between the two phases.
Proximity histograms for the two cherry pits observed in the cross-section slice located in the precipitate marked with the horizontal line in Fig. 7. The isoconcentration surface that marks the cherry-pit/precipitate interface, at d = 0 nm, is set at composition of 20% Cu. The green and red lines are V and Cu concentration, respectively. The dark-colored curves correspond to one cherry pit, while the brighter curves correspond to the other cherry pit.
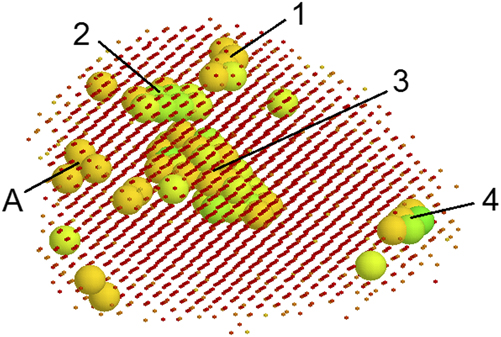
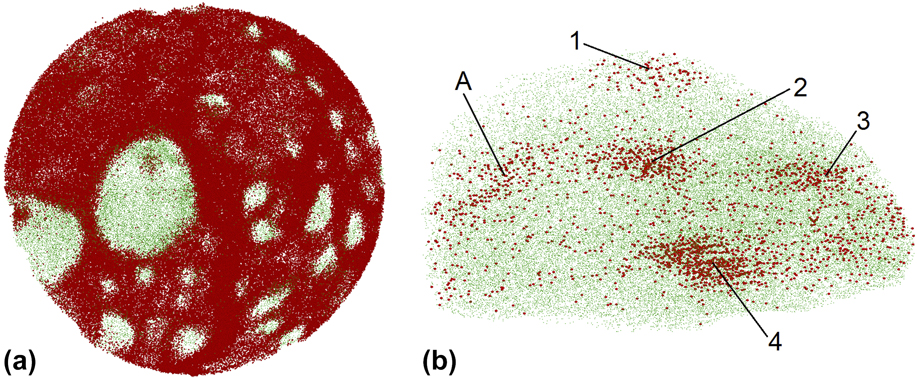
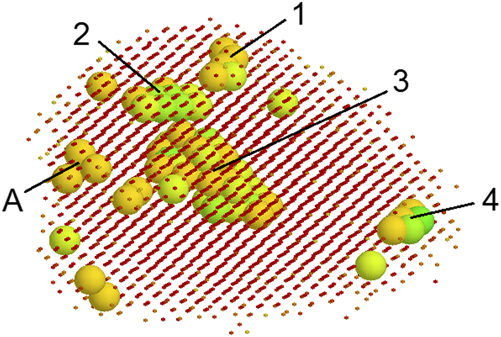
Many of the V precipitates formed at 450 °C during irradiation contain multiple pits. While this may not be directly observable in cross-sectional slices such as the one shown in Fig. 9(a), all of the Cu-enriched clusters can be observed in three-dimensional reconstructions of the V-rich precipitates, as shown in Fig. 9(b). For quantitative analysis, the cherry pits were analyzed using voxel compositions, similar to the analysis of V-rich precipitates used above. The same V-rich precipitate shown in the atom reconstruction maps in Figs. 9(a) and 9(b) is shown as a voxel reconstruction in Fig. 10. As done for the proxigram analysis in Fig. 8, a 20% Cu threshold was chosen to differentiate between the Cu-enriched cherry pits and the V-rich precipitates (and the Cu-rich matrix). While the same nearest-neighbor grouping used to identify precipitates was also performed to identify cherry pits, a minimum grouping of five voxels was set as a requirement for identifying the Cu-enriched clusters as cherry pits. This threshold was used so that comparisons in the number of cherry pits per precipitate were not unduly affected by extremely small clusters of Cu atoms. The precipitate examined in Figs. 9 and 10 appears to have five cherry pits when looking at the atom reconstruction [Fig. 9(b)], but using the voxel analysis, it is found that the region A does not meet the threshold requirement identifying cherry pits.
Atom reconstructions of portions of the Cu91V9 sample irradiated at 450 °C. (a) A two-dimensional x–y cut plane, ∼85 nm in diameter and 1 nm thick, with two V-rich precipitates that have a cherry pit inside of them. This cut plane is located along the dotted line in Fig. 7. The large precipitate located near the center of the cut plane is shown in a three-dimensional atom reconstruction in (b), where four Cu-enriched cherry pits (labeled 1–4) are revealed, as well as one Cu-enriched region, labeled A. The dimensions of the precipitate shown in (b) are ∼13 nm in height and 23 nm in width. The V atoms (green) in both images have been reduced in size relative to the Cu (red) atoms for ease of visualization.
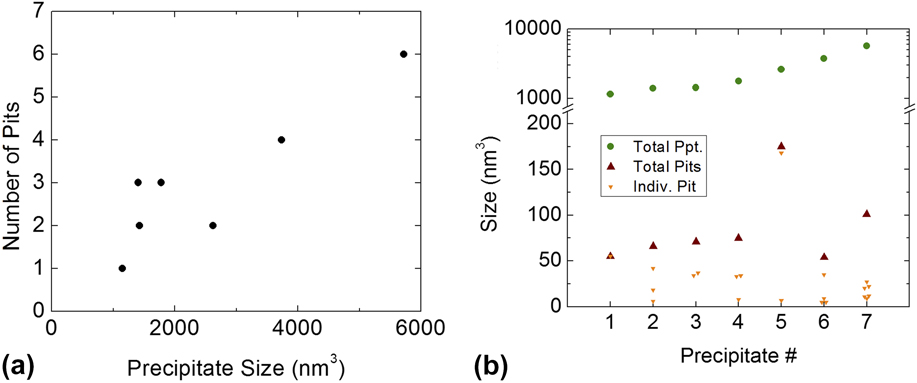
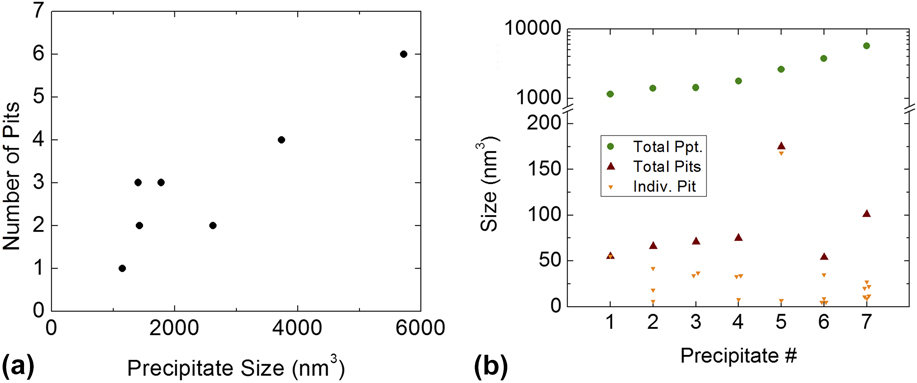
The voxel reconstruction of this specimen was examined layer-by-layer to locate all of the cherry pits. The seven largest V-rich precipitates all contained cherry pits, with one containing six individual cherry pits. The number of cherry pits found within the precipitates increased approximately linearly with precipitate volume, as shown in Fig. 11(a). Figure 11(b) shows, moreover, that the size of individual pits is roughly independent of the precipitate size, so that the volume of the pits scales approximately with the size of the precipitates. No pits were found in precipitates smaller than 103 nm3.
(a) The number of cherry pits as a function of precipitate size, and (b) the relationship between the precipitate size and the volume of pits inside of 7 distinct precipitates.
IV. DISCUSSION
The present study using atom-probe tomography has shown that ion irradiation of Cu91V9 thin film alloys between 350 and 500 °C leads to compositional patterning, quite similar to that reported for other immiscible Cu alloys. The remarkable new findings here concern the stabilization of a cherry-pit morphology in larger V-rich precipitates, that is, these V precipitates contain Cu-rich “inner” precipitates within them. Before discussing this main result in detail, it is first useful to analyze the compositional patterns stabilized by irradiation in Cu–V as they bear directly on cherry-pit formation. First, we note that since ion irradiation at RT does not induce precipitation, see Figs. 3(a) and 4(a), it can be concluded that the atomic mixing in energetic cascades is, for the most part, random, and that compositional patterning in Cu91V9 derives from a competition between finite-range ballistic mixing and thermally activated decomposition. Such behavior was reported for Cu–Co, Cu–Ag, Cu–Fe, and Cu–Nb Reference Krasnochtchekov, Averback and Bellon3,Reference Chee, Stumphy, Vo, Averback and Bellon4 and discussed in the introduction. In all of these systems, patterning is observed over a range of irradiation temperatures, from T min to T max. Since compositional patterning has been proposed to impart high intrinsic radiation resistance, Reference Chee, Stumphy, Vo, Averback and Bellon4 and since advanced reactor designs call for higher operating temperatures, it is useful to identify materials with high values of T max. Among the above Cu-based systems, this study shows that Cu–V has the largest maximum patterning temperature, with T max extending at least to 500 °C. For comparison, in Cu88Fe12, T max ≈ 275 °C, Reference Stumphy, Chee, Vo, Averback, Bellon and Ghafari10 and in Cu90Co10, T max ≈ 330 °C. Reference Krasnochtchekov, Averback and Bellon3 Past work Reference Chee, Stumphy, Vo, Averback and Bellon4,Reference Enrique and Bellon8,Reference Enrique and Bellon20 suggests that a high T max results from the combination of a low thermal diffusivity of the solute atoms in the host matrix and a highly immiscible alloy.
In addition to the high value of T max in Cu91V9, it is observed that the average size of the V precipitates remains surprisingly constant as the temperature is increased from 375 to 500 °C. In Cu–Co, Cu–Ag, Cu–Fe, in contrast, the average size of the precipitates grew throughout the patterning regime. Because ballistic mixing is essentially an athermal process, any change in microstructure caused by altering the temperature is due to a change in the thermally activated diffusivity. At sufficiently low temperatures, diffusion is limited by the recombination of vacancies and interstitials. However, as the temperature is increased, and the mobility of vacancies correspondingly increases, the majority of defects no longer recombines but rather annihilate at sinks (i.e., grain boundaries). If the distance between sinks is independent of temperature, the diffusion length of each defect remains unchanged as the temperature increases. The radiation-enhanced diffusivity, D RED, therefore remains nearly constant within this sink-limited regime. Reference Russell21 Using chemical rate equations, Reference Sizmann22 a study of Cu–W alloys irradiated with 1.8 MeV Kr+ examined where that system transitioned from the recombination-limited regime to the sink-limited regime. Reference Tai, Averback, Bellon, Ashkenazy and Stumphy23 In those calculations, a grain size of 30 nm was used, and it was determined that above ∼200 °C, the Cu–W alloys were in the sink-limited regime. For Cu–V thin films grown in SiO2, the grain size was found to be a little larger, ∼30–50 nm using x-ray diffraction and transmission electron microscopy, meaning that the sink-limited regime for Cu–V would occur at temperatures slightly higher than observed for Cu–W. The lack of an increase in the average precipitate size from 375 to 500 °C is therefore reasonable. Note, the low T max in Cu–Co, Cu–Ag, Cu–Fe prevented these systems from ever lying in both the patterning and sink-limited regime.
We now turn to the stabilization of cherry-pit structures in Cu–V. Our discussion is based on a recent KMC simulation study of cherry-pit formation in model immiscible A-B alloy systems. Reference Shu, Bellon and Averback11 This study showed that a requirement for cherry pits to form in the patterning regime, as found here for Cu–V, is that the equilibrium solubility and diffusivity of the A matrix atoms in the B-rich precipitates be equal to or lower than the solubility and diffusivity of the B atoms in the A-rich matrix. If these conditions are not met in the patterning regime, A atoms injected from the matrix into the precipitates will be able to diffuse back to the precipitate/matrix interfaces, thus preventing the formation of pits. For the simple case of a “symmetric” alloy system, where solubilities and diffusivities are the same for dilute A(B) and B(A) alloys, the pit volume fraction measured in the simulations in the patterning regime was ∼4%. This is very similar to the volume fractions measured experimentally, which ranged from 1.5 to 5%, see Fig. 11(b). The absolute pit and precipitate sizes were smaller in the above KMC simulations than found experimentally, here, but, unlike the pit volume fraction, these sizes are very sensitive to the choice of the average ballistic recoil distance. A consequence of these smaller steady-state precipitate sizes in the simulations is that the precipitates in the patterning regime were found to only contain single pits. This result is consistent with the experimental findings that number of pits increased approximately linearly with precipitate volume. The simulations showed, moreover, that multiple pits should form in larger precipitates, as for instance found in the macroscopic growth regime, see Fig. 1(b). Lastly, we note that the cherry pits are a dynamical structure in the simulations, with pits going through repeated cycles of nucleation, growth, and absorption by the matrix. This dynamical character of the cherry pits, unfortunately, cannot be confirmed using post-irradiation characterization methods as done here.
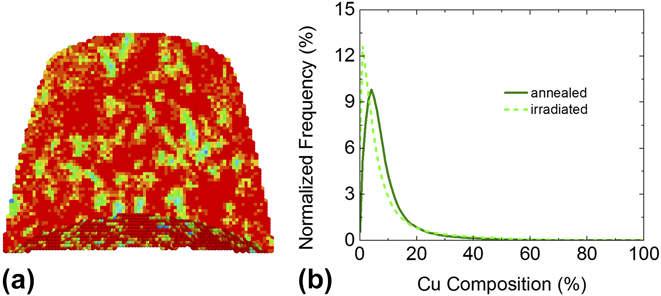
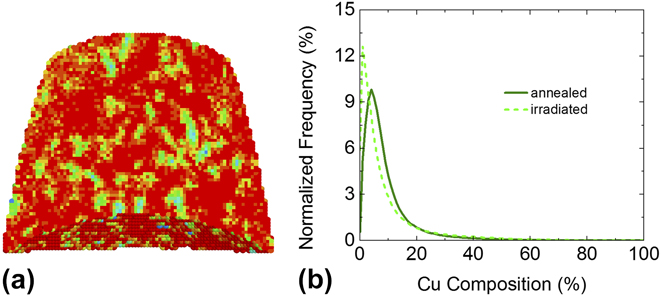
A direct quantitative comparison between the above KMC simulations Reference Shu, Bellon and Averback11 and the present experimental results is not possible, mainly because the simulations rely on a simplified kinetic model with fixed point defect concentration. In reality, due to the nonconservative character of point defects, their concentration varies significantly with parameters such as the damage rate and the irradiation temperature. Reference Sizmann22 Nevertheless, one important requirement for cherry-pit formation as observed in the simulations is that the matrix atoms that are ballistically injected in solute-rich precipitates should have enough mobility to form small precipitates. This condition was tested experimentally by irradiating a V-rich Cu–V alloy at 450 °C, a temperature for which compositional patterning and cherry pits were observed in Cu91V9 alloys. The composition of this V-rich sample \was chosen to be V91Cu9 so that its Cu concentration is similar to the ones measured in the V-rich precipitates in Cu91V9, see the proximity histograms in Fig. 8. As illustrated in Fig. 12, Cu precipitation is indeed after irradiation at 450 °C in this V91Cu9 sample. The average Cu-rich precipitate volume, ∼45 nm3, is in fact similar to that of the pits identified in the Cu91V9 samples, see Fig. 11. On the other hand, the Cu-rich precipitates in V91Cu9 have a higher Cu content than the pits that formed within the V-rich precipitates in Cu91V9. It is interesting to note that the Cu-rich precipitates in the irradiated V91Cu9 sample did not contain V-rich pits. The Cu-rich precipitates are however quite small, and probably too small to sustain stable V-rich pits. Overall, these observations of Cu precipitation in V91Cu9 alloys irradiated at 450 °C provide further support for the rationalization of the novel nanostructures in ion-irradiated Cu91V9 alloys in terms of the cherry-pit structures identified in the KMC simulations.
The V91Cu9 sample irradiated to a dose of 3 × 10¹⁶ ions-cm−2 at 450 °C: (a) voxel reconstruction, ∼85 nm in width and 70 nm in height; (b) voxel composition histogram for the irradiated sample compared to that of a sample annealed at 450 °C. Color code for (a) is the same as in Fig. 4.
V. CONCLUSIONS
Ion irradiation at elevated temperatures, ∼300 to 500 °C, was found by APT to stabilize compositional patterns in Cu91V9 alloy thin films. Furthermore, these irradiations resulted in the formation of “cherry-pit” nanostructures, with V-rich nanoprecipitates containing one or several Cu-rich pits. This study thus established that cherry-pit formation can take place in the steady-state regime of compositional patterning under irradiation. In contrast, in a previous experimental investigation of irradiation-induced precipitation in Cu88Fe12, cherry-pit nanostructures were only observed in the macroscopic phase separation regime, where precipitates continuously grew with dose. These results are rationalized using recent atomistic kinetic Monte Carlo simulations, based on differences in solubilities and atomic mobilities in these two alloy systems. Furthermore, irradiation of V91Cu9 sample at 450 °C confirmed that Cu atoms have enough mobility under irradiation to form small Cu-rich precipitates, a necessary condition in the KMC simulations for cherry pits to be stabilized by irradiation. Since cherry-pit structures should not form and have not been observed at or near thermodynamic equilibrium, e.g., during thermal annealing, their presence in irradiated alloys reveals unique self-organization reactions in these nonequilibrium systems.
ACKNOWLEDGMENTS
This research was supported by the U.S. Department of Energy, Office of Basic Energy Sciences, Division of Materials Sciences and Engineering under Award DEFG02-05ER46217. The work was carried out in part in the Frederick Seitz Materials Research Laboratory (FS-MRL) Central Research Facilities, University of Illinois. The atom-probe tomographic measurements were performed at the Northwestern University Center for Atom-Probe Tomography (NUCAPT), which was supported by NSF, ONR, and the Initiative for Sustainability and Energy at Northwestern (ISEN). The authors are very grateful to Prof. D. Seidman for use of the NUCAPT facility and to Prof. D. Isheim for his wide-ranging assistance in using the atom probe. We thank Dr. X. Sauvage for stimulating discussions on atom trajectory aberrations in APT. Finally, the authors would like to thank D. Jeffers (FS-MRL) for his assistance with operation of the Van de Graaff accelerator used to irradiate our samples.