Introduction
H13 steel is a typical medium-carbon, hot-work tool steel that possesses superior thermal strength, red hardness, and resistance to thermal fatigue, and it has been widely applied to make various dies for the hot extrusion, forging, and high-pressure casting of aluminum and magnesium alloys [Reference Srivatsan1, Reference Committee, Davis, Abel, Committee, Davis and Abel2]. However, the making of dies using traditional manufacturing methods is a limited and time-consuming process. In particular, the fabrication of a molding cooling system is directly related to the service life of the die. Using traditional manufacturing technology, one can only design conventional drilled cooling channels, which restrict the channel consistency and the shapes of mold cavities. These deficiencies lead to uneven heat dissipation, an increase in the cooling cycle, large internal stress, and a shortened mold service life [Reference Mazur, Leary, Mcmillan, Elambasseril and Brandt3].
Selective laser melting (SLM), which is also called 3D printing, is a disruptive technology in which one can produce very complex geometries that are not available via traditional manufacturing methods [Reference Frazier4]. It is used across multiple industries, including the aerospace, biomedical, automotive [Reference Lewandowski and Seifi5], and mold industries [Reference Gibson, Rosen and Stucker6]. Three-dimensional printing allows cooling channels to match the cavity shape, thereby countering the limitation of conventional drilled cooling channels [Reference Mazur, Leary, Mcmillan, Elambasseril and Brandt3]. At the same time, SLM can achieve complex castings for single- or small-batch production and it enables the development of new products in the mold-making industry. Consequently, the use of the SLM of H13 die steel as the focus of study has attracted increasing attention. The performance of the SLM of H13 steel is an important standard for mold service life. Because of the large difference between traditional preparation and SLM forming methods, the microstructure of H13 steel prepared by SLM is altered greatly. In particular, it is not clear whether there is a second phase in the microstructure of H13 steel prepared by SLM, and the existence of this second phase is directly related to the service life of the mold. However, there has been little research on H13 steel prepared by SLM, and the influence of forming process parameters and mechanical properties has not yet been clarified. Consequently, it is necessary to accurately manage the SLM processing parameters of laser power, scanning speed, layer thickness, and scanning space to effectively apply H13 tool steel in the manufacture of SLM molds.
This study uses the phase identification of SLM-processed specimens and traditional specimens to determine the presence or absence of second-phase particles. Then, an in-depth investigation of the microstructure, microhardness, and tensile strength is made for two types of specimens.
Results and discussion
Relative density
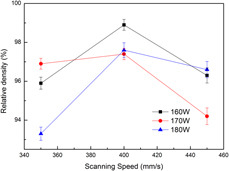
Different process parameters were optimized using the relative density of the specimens. The higher the relative density, the better the printing quality. A better printing quality is related to process parameters such as the laser power, scanning speed, and scanning space. The experimental results are shown in Fig. 1.
Effects of process parameters on the density of H13.
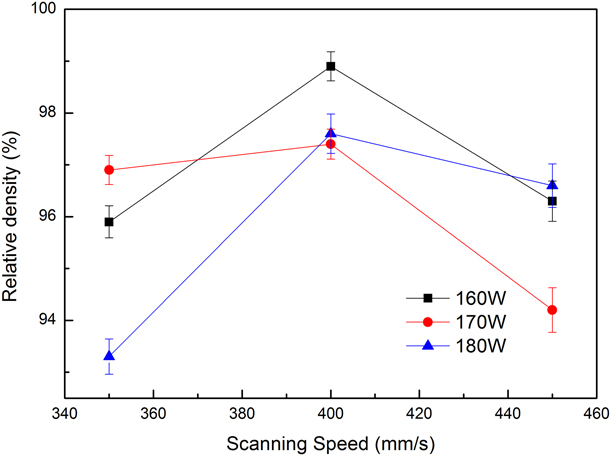
The highest relative density is achieved when the laser power, the scanning speed, and the scanning space are 170 W, 400 mm/s, and 100 μm, respectively.
As is commonly known, the energy density reflects the heat quantity absorbed by specimens during SLM printing. If the energy density is not sufficiently high, the powder is not melted completely, which results in poor wettability between the melt and the solidified layer. There is no melting powder around the molten pool, but it has almost no limit to the molten pool. According to the system energy density principle, the molten pool will solidify into a spherical shape owing to the function of the surface tension, and the system is asymptotically stable as shown in Fig. 2(a). In addition, the densities show a downward trend and some semimelted powder particles are entrained in the interior of the specimen with a nonuniform distribution. With the increase in the laser energy density, the powder can be melted completely, achieving excellent metallurgical bonding so that a relatively high print quality can be obtained [Reference Wang, Wang and Wu7]. However, strong vaporization and spatter will occur in the metal molten pool when the laser energy is higher than a certain value, as can be seen from Fig. 2(b), so numerous voids are produced by filling without metal liquid. At the same time, the splashing liquid will fall into the molten pool owing to gravity, forming a small spheroidization region, which will affect the molding quality.
Large size spheroidizing and void spatter formation during SLM process. (a) Large size spheroidizing schematic. (b) Spatter formation schematic.

There are serious consequences to the increased energy, i.e., the edges of the printing parts will warp, which is a phenomenon called layer spallation. A large degree of residual stress is manifested around the laser spot owing to the large thermal gradients [Reference Mercelis and Kruth8]. Moreover, because the expansion of the heated top layer is restricted by the underlying material, elastic compressive strains are induced. When the compressive stress approaches the yield strength, some parts will be compressed at a bending angle that is in the midrange of the tensile stress [Reference Wang, Wu, Fu, Mai, Yang, Liu and Song9, Reference Liu, Yang and Wang10, Reference Andani, Dehghani, Karamooz-Ravari, Mirzaeifar and Ni11]. At the same time, the top layer tends to shrink because of thermal contraction [Reference Parry, Ashcroft, Bracket and Wildman12]. This situation is very harmful to the raking system of the EOS SLM system so it should be avoided.
XRD analysis
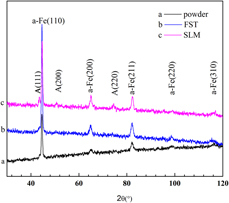
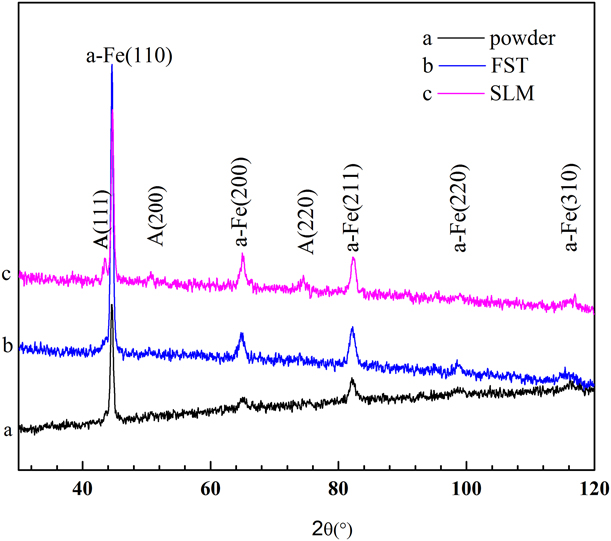
Figure 3 shows the X-ray diffraction (XRD) diagrams of the material powder, the FST specimen, and the SLM specimen. In the XRD spectra, the diffraction peaks of H13 steel between SLM and FST are similar. There is still a small amount of retained austenite (face-centered cubic structure, with a = 3.62 Å) in the H13 steel except for martensite (Fe1.945C0.055, tetragonal structure with a = 2.859 Å and c = 2.937 Å) in the two processed methods. Moreover, the width at half maximum is slightly greater, which indicates that the grain size of the SLM specimen is smaller than that of the FST specimen [Reference Suryanarayana and Grant Norton13]. In addition, the XRD peaks were found to be generally in agreement with the SLM and powder specimens, whereas austenite in the powder could not be found, indicating that the amount of residual austenite in the powder is very small.
XRD spectra of the specimen. (a) Powder specimen, (b) FST specimen, and (c) SLM specimen.
Microstructural characterization by SEM, TEM, and EBSD
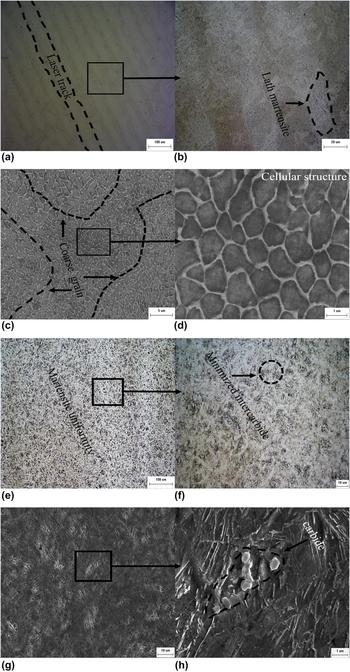
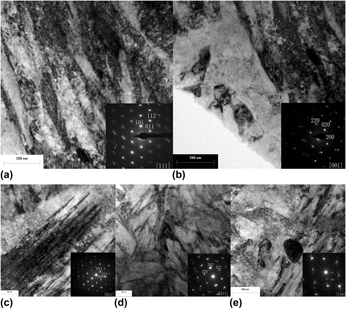
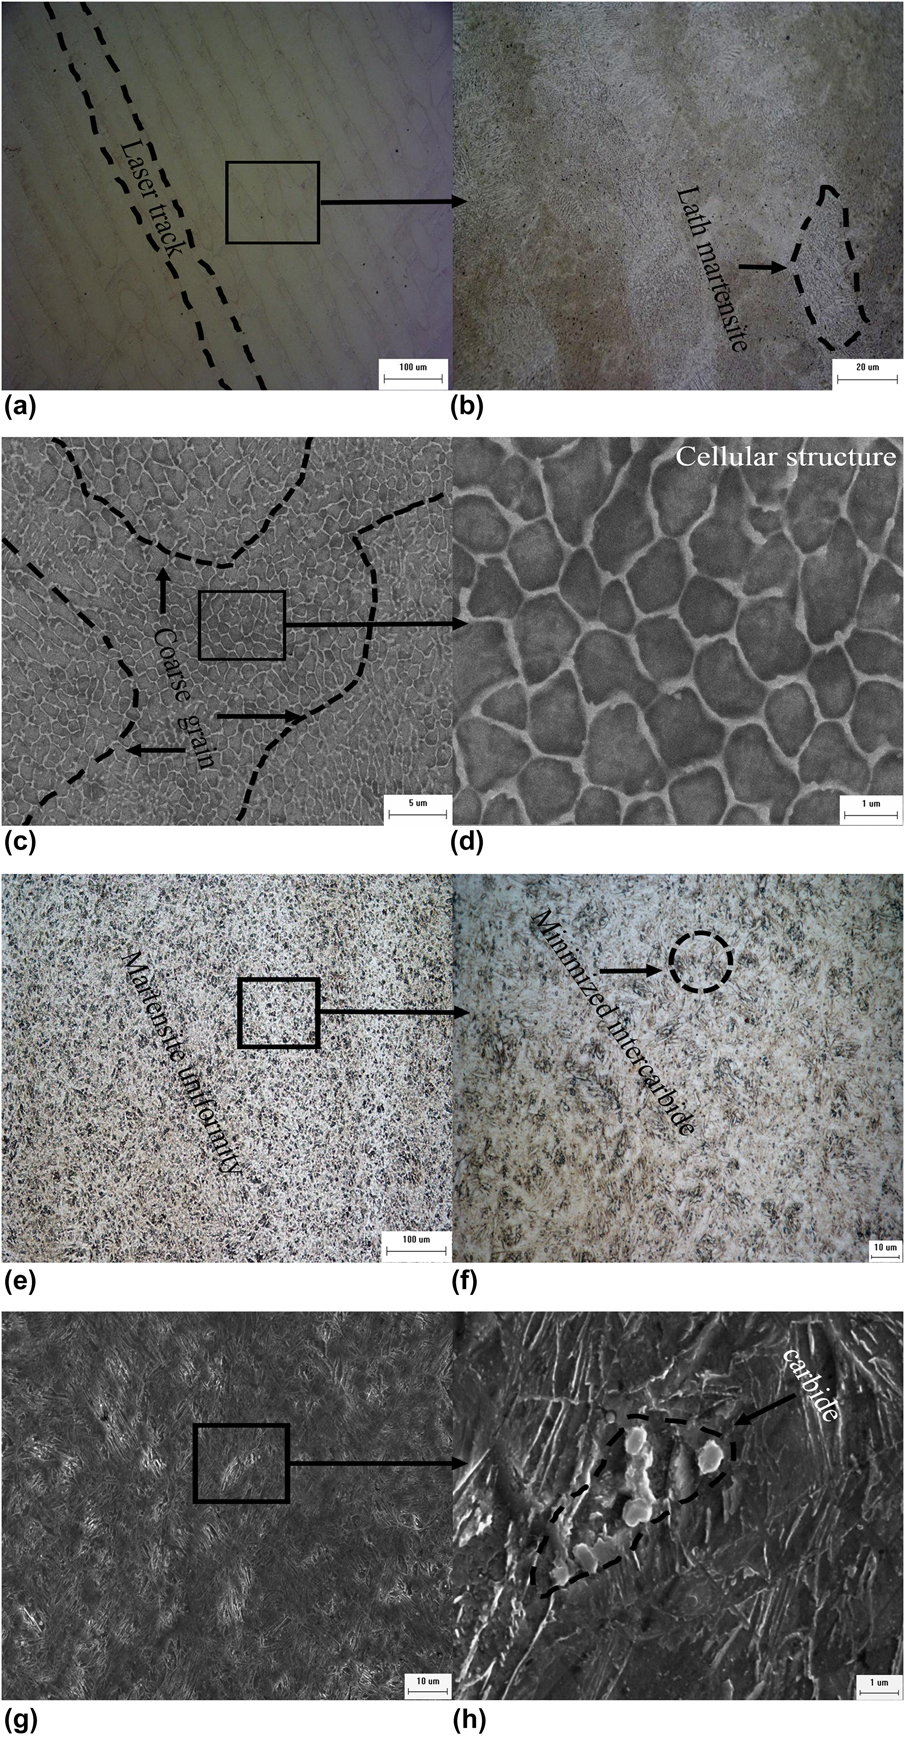
Figure 4 shows the optical microscope [Figs. 4(a), 4(b), 4(e), and 4(f)] and SEM [Figs. 4(c), 4(d), 4(g), and 4(h)] microstructural images of the SLM and FST specimens. The laser tracks and the cellular structure can be clearly seen in Figs. 4(a) and 4(c). In the microstructure of a large number of fine cellular crystals, the existence of some coarse grains is due to the influence of a complex temperature gradient and thermal conductivity. Figure 4(b) exhibits a high-power optical microscope photograph (×1000) of Fig. 4(a), from which the fine lath martensite can be clearly seen. Moreover, Fig. 4(d) shows the fine cell-like structure with a grain size of ∼1 μm, which contributes to the excellent mechanical properties. When the grain size is between 100 and 10 μm, the mechanical properties are consistent with the Hall–Petch formula. It is well known that the grain size of crystals increases as the yield strength of the crystals decreases. The reason for the formation of fine nanocrystals is the rapid cooling rate (10−4–10−6 K/s) during the SLM process. Because of the short time in which dendrites formed during the solidification process, the solute elements gather around the grain boundaries to form microsegregation and a cell-like structure [Reference Wang, Song, Yang and Bai14, Reference Stanford, Kibble, Lindop, Mynors and Durnall15]. This microstructure is found in 316L stainless steel, AlSi10Mg, and Inconel 718 alloys formed by SLM [Reference Stanford, Kibble, Lindop, Mynors and Durnall15, Reference Popovich, Borisov, Popovich, Sufiiarov, Masaylo and Alzine17, Reference Popovich, Borisov, Popovich, Sufiiarov, Masaylo and Alzine17]. Microstructural images of an FST H13 steel specimen under an optical microscope and SEM are shown in Figs. 4(e)–4(h). The microstructure after FST is very fine and uniform without segregation. Dispersed fine carbides can be seen on the martensitic matrix; these can help to improve the strength and hardness of the material because of the Mo, V, and other carbide precipitates. Figure 5 shows five TEM images of H13 steel. Figures 5(a) and 5(b), respectively, show the TEM photographs of lath martensite and austenite of the SLM specimen, whereas Figs. 5(c)–5(e), respectively, show the quenched acicular martensite, austenite, and precipitated carbide TEM photographs of the FST specimen. It can be seen from the TEM diagram that there is a greater amount of second-phase precipitates in FST H13 steel than in the SLM specimen. The observed microstructure in the light fields and selected area electron diffraction (SAED) analysis of the different microstructures reveal the existence of martensite and austenite in the two specimens. However, the ratio of residual austenite in the SLM specimen is higher than that in the FST specimen. The lattice constants of the corresponding martensite calculated using SAED are 0.292 nm (SLM) and 0.289 nm (FST), respectively. Because the cooling rate of H13 steel formed by SLM is too fast, the diffusion and precipitation of alloy elements such as Cr, Mo, and V in the solidification process are suppressed. Therefore, the solid solution in α-Fe causes lattice parameter distortion, so the lattice parameter is relatively large. TEM characterization shows that there is an M23C6 carbide phase in the FST specimen but not in the SLM specimen, which also confirms why the SLM lattice parameter is distorted.
Representative optical images at (a) low and (b) high magnification and SEM images at (c) low and (d) high magnification of H13-SLM sample. Representative optical images at (e) low and (f) high magnification and SEM images at (g) low and (h) high magnification of H13-FST sample.
TEM bright-field images shows (a, c) martensite, (b, d) austenite for the H13 steel under SLM and FST processed, respectively; (e) M23C6 carbide for the H13 steel under FST processed.

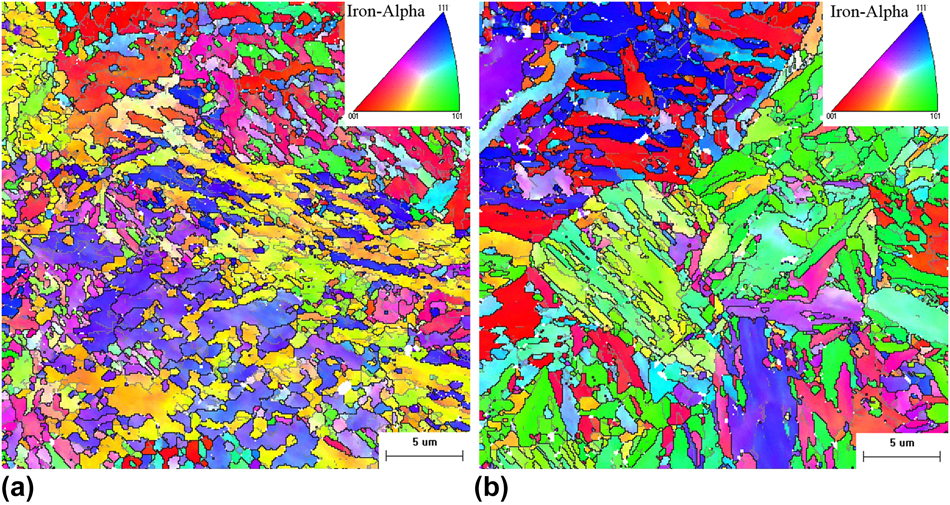
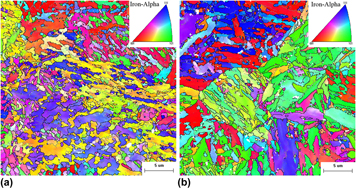
Figure 6 shows the unique grain color maps of SLM and FST specimens obtained using EBSD. Figure 6(a) shows the structure of grains parallel to the scanning direction. It should be noted, that in current research on H13 steel, no preferred crystallographic texture was observed, contrary to Inconel and Ti6Al4V produced by SLM techniques [Reference Antonysamy, Meyer and Prangnell18, Reference Helmer, Bauereiß, Singer and Körner19, Reference Popovich, Borisov, Popovich, Sufiiarov, Masaylo and Alzina20]. It can be seen that the average grain size of the SLM specimen is 1 μm owing to the rapid solidification that was discussed earlier. Some of the grains are too large, and this is due to secondary heating or even remelting of the former layers during the reheating of the latter layer, which leads to heat dissipation disorder during the solidification process. In addition, the grain size of the FST specimen is larger than that of the SLM specimen in Fig. 6(b). The rotation of the scanning direction by 67° usually breaks up the defined epitaxial columnar structure in the SLM specimen. However, the anisotropy between grains of the FST specimen is obviously stronger than that of the SLM specimen. The EBSD data indicate that the residual austenite content of the SLM specimen is 1% higher than that of the FST specimen. The amount of low-angle grain boundaries in the SLM specimen is larger than that in the FST specimen.
EBSD analysis of H13 tool steel sample maps: (a) SLM inverse pole figure maps and (b) FST inverse pole figure maps.

Mechanical properties
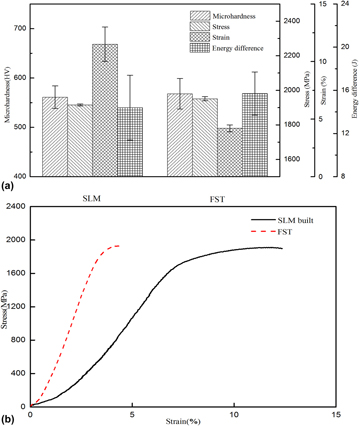
Figure 7(a) compares the mechanical properties of SLM and FST specimens, respectively. The microhardness, tensile strength, and impact toughness are basically the same, but the elongation of the SLM specimen is nearly a factor of three times greater than that of the FST specimen. The results of the Vickers microhardness (HV) tests were evaluated by comparing HV values of the SLM specimen for the x–y planes and the FST specimen. The microhardness values of the SLM specimen and the FST H13 steel were 561 and 568 HV, respectively. The hardness measurements do not show substantial variations, because the two specimens mainly consist of the martensite phase [Reference Stanford, Kibble, Lindop, Mynors and Durnall15].
Mechanical properties of SLM and FST. (a) Microhardness, stress, strain, and Charpy impact test results of SLM and FST. (b) Stress–strain curves under different treatments.
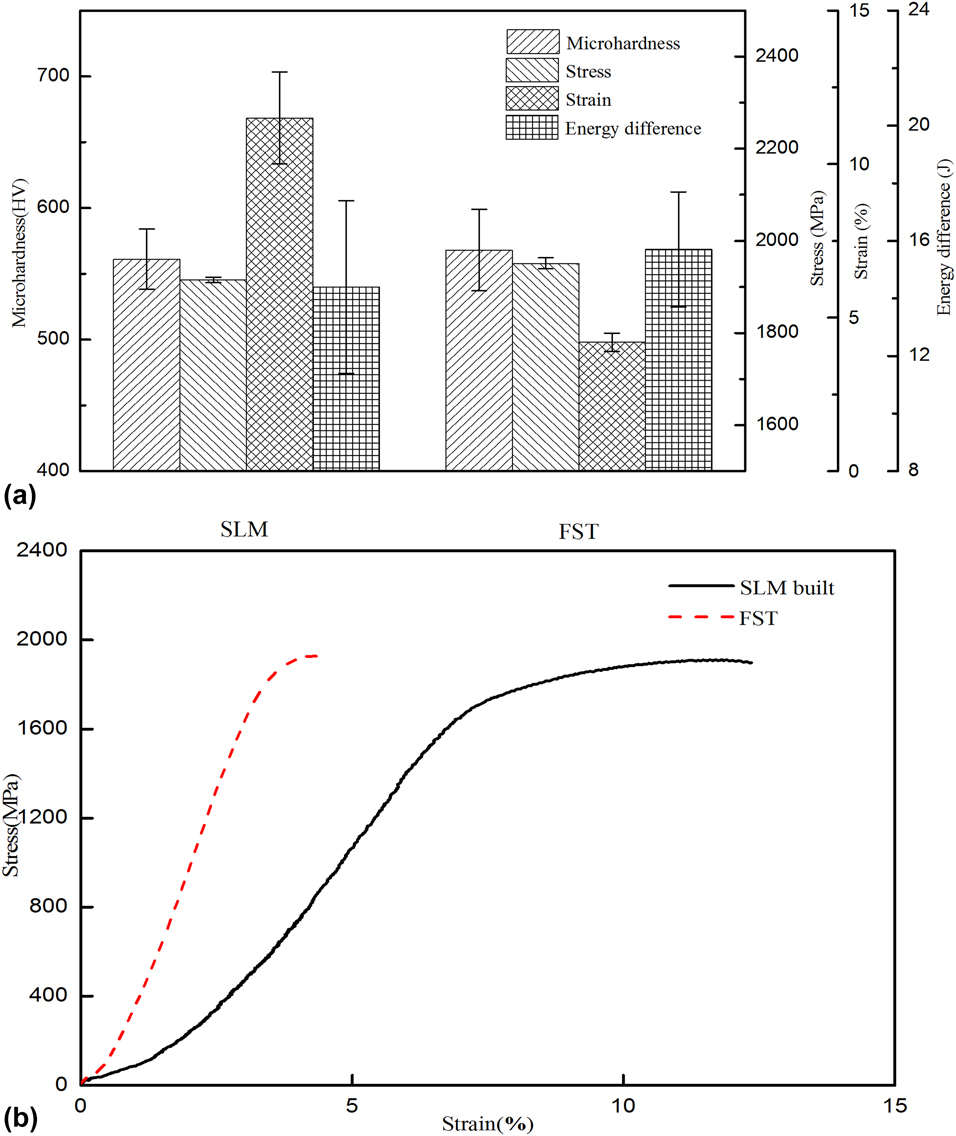
The same is true of the tensile strength, as shown in Fig. 7(b), where that of the SLM specimen is 1909 MPa and that of the FST specimen is 1962 MPa. However, the SLM specimen elongation (12.4%) is a factor of three greater than that of the FST specimen (4.4%). The specimens with a two-phase microstructure have the characteristics of continuous yield and rapid initial work hardening. The fine cellular structure of the SLM specimen is mostly lath martensite, but with a greater number of effective slip systems than that of acicular martensite [Reference Mertens, Vrancken, Holmstock, Kinds, Kruth and Van Humbeeck21]. The continuous yield of H13 steel is usually attributed to the increased number of moving dislocations during rapid cooling. The increase in the dislocation density is observed at low strain, thereby suppressing discontinuous yielding [Reference Matlock, Krauss, Ramos and Huppi22]. The grain size of the SLM specimen is small, the grain boundary area increases, and there are fewer inclusions, which result in the interfacial bonding force being enhanced [Reference Erdogan and Tekeli23]. The relation between the yield strength and the grain is given by [Reference Zhao, Li and Jiang24]
 $$\sigma = {\sigma _0} + k{D^{ - n}}\quad .$$
A fine grain size can more easily hinder crack growth, which significantly enhances the strength and elongation. The grain size is large and the second phase is precipitated during the FST processing method. Second-phase strengthening and the stress field of the precipitated particles strongly hinder dislocation movement to strengthen the material. However, this will also increase the brittleness of the low elongation material. To further study the fracture mechanism of different process conditions, the fracture morphologies of the tensile specimen were analyzed and the tensile properties of the specimens were explained [Reference Deighton25]. In addition, the larger proportion of low-angle grain boundaries leads to material with a better plasticity.
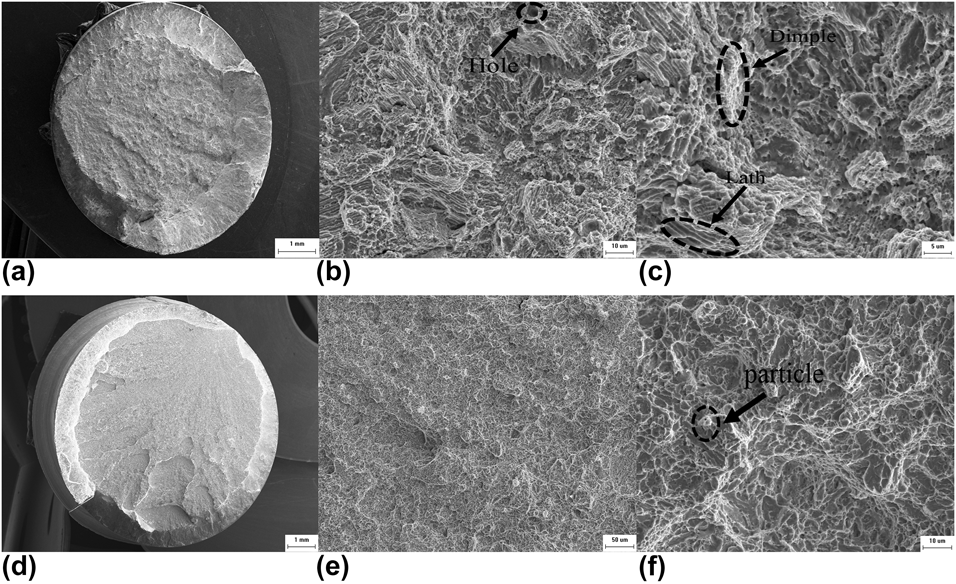
In Figs. 8(a) and 8(d), the tensile fractographies of SLM and FST specimens exhibit typical brittle fracture with two distinct areas: a shear lip and a fibrous region. Figure 8(a) shows the ratio of the shear lip of the SLM specimen. It can be seen that the ratio of the shear lip of the SLM specimen is larger than that of the FST specimen and that the fibrous region is not bright. Therefore, the SLM specimen can be more easily plastically deformed than the FST specimen. Figures 8(b) and 8(c) show the SEM morphology of the SLM tensile fractographies. It can be seen that there are small cracks and river patterns of tearing edges and fine dimples, which indicate a quasi-cleavage fracture mechanism. At the same time, the holes caused by spatter become the source of cracks in the tensile process. However, cracks mainly occur as small shallow and deformed dimples. The defects in the interface between lath martensite and retained austenite are the crack source. The martensite of the SLM specimen has a fine grain size and no precipitation of the second-phase particles, so the fracture occurs along the grain boundary. Microvoids propagate into retained austenite or along martensite particle boundaries in the direction of straining to crack. When the crack extends to the austenitic structure, the specimen has undergone formation and expansion of microcavity dimples and crack growth. Therefore, the specimen prepared by SLM has high strength and good plasticity. To further study the fracture mechanism, a high magnification of the fractographies was performed, as shown in Fig. 8(c). It was observed that lath martensite and dimple alternated, with brittle fracture and ductile fracture matching each other, giving the SLM specimen good tensile strength and elongation. Figure 8(e) shows that there is almost no dimpling on the fracture surface, the dissociation plane is very dense, and there is no obvious river pattern, which were characteristics of the cleavage and fracture of the FST specimen. Carbides were observed in the specimens near the fracture surface, which may be the source of cracks and which promote the fast relatively rough martensitic crack growth, as shown in Fig. 8(f). For the FST specimen, the fracture is obviously brittle with little plastic deformation [Reference Ahmad, Manzoor, Ali and Akhter26, Reference Sarwar and Priestner27, Reference Sarwar, Priestner and Ahmad28].
SEM images of the fractographies of tensile H13 steel specimens: (a, d) Macroscopic morphology of the fracture surface of SLM and FST sample; (b) solidification defects (hole) and (c) fine dimples and tearing edges from (a); (e) dissociation plane and (f) carbide particle from (d).

Impact toughness
Impact toughness refers to the ability of material to absorb energy when it is destroyed, and it is related to the strength and ductility of the material [Reference Dang-Shen, Jian, Chen, Zhang, Chen and De-Hui29].
A Charpy impact test was conducted to measure the impact toughness of H13 steel. The impact absorbed energies were determined to be ∼14.4 and ∼15.7 J for the specimens processed by SLM and FST, respectively. The high cooling rate introduces high residual stress, strong notch sensitivity, and incomplete porosity of the SLM specimen, which will slightly reduce its impact toughness. When the loading rate is high, plastic deformation cannot take place and abnormal fracture will occur in the specimen, thus increasing the brittle fracture tendency and decreasing the toughness. Charpy impact tests were conducted on the notched specimens. The results show that the stress state is stronger and that the internal stress of the material itself is large owing to the existence of the three-way stress at the root of the notch, which increases the crack sensitivity. The fracture surface of the impact specimens was carefully examined by performing SEM, as shown in Fig. 9.
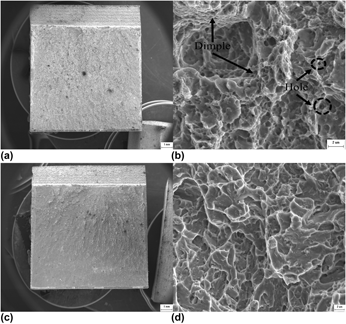
SEM images of the fractographies of Charpy H13 steels specimens: (a, c) Macroscopic morphology of the fracture surface of SLM and FST sample; (b) solidification defects (hole) and fine dimples from (a); (d) dissociation plane from (c).

In Figs. 9(a) and 9(c), the crack initiation zone, fibrous region, and instantaneous fault zone all exist on the fracture surface, with almost no shear lip appearing. The crack originates from the notch root and grows rapidly during high strain rate impact loading. The area of the instantaneous fracture area of the SLM specimen is small whereas the fibrous region is larger. As shown in Fig. 9(b), it can be seen from the microfracture morphology that there are deep dimples that consist of numerous shallow dimples in the origin area. Under the action of impact stress, dislocation slippage forms microdimples, which then gather to form large dimples to increase the effective fracture area, resulting in the formation of multiple crack sources near the notch on the fracture surface. Martensite is an effective grain that hinders the growth of quasi-cleavage cracks. During the propagation process, the microstructure of residual austenite is low in hardness and will be cut to form a large dimple [Reference Lambert-Perlade, Gourgues and Pineau30, Reference Wu and Davis31]. With respect to the fractographies of the FST specimens, there is a large fraction of cleavage facets seen in Fig. 9(d). It can be inferred that the impact fracture mechanism of the SLM specimen is a quasi-cleavage fracture and that of the FST specimen is a brittle cleavage fracture. In addition, the density of the SLM specimen is not as high as that of the FST specimen. Consequently, pores can easily act as crack sources, reducing the impact toughness.
Conclusion
In summary, H13 hot-work die steel was processed using the SLM technique. Our aim was to optimize the process parameters (laser power and scanning speed) for H13 steel specimens produced by SLM and to research their microstructural characteristics and mechanical properties. Some conclusions are as follows:
(1) Increasing the laser energy density causes the relative density to first increase and then decrease. A low laser energy density is not sufficient to melt the powder completely, and large-volume agglomeration occurs. However, a higher laser energy density will cause a large area of liquid spatter, form a hole, and reduce the density, and excessive energy density can even lead to stress concentration and surface cracking. The optimum process parameters are a laser power of 170 W and a scanning speed of 400 mm/s according to the maximum relative density of 99.2%.
(2) The existence of the martensite phase and retained austenite phase was determined by XRD, and the grain size of the SLM specimen was smaller than that of the FST specimen. SEM showed that the microstructure of SLM specimens was fine, comprising mostly cell-like but coarse grains with a grain size of 1 μm, but that there was no precipitation of carbides. The lattice constant of the SLM specimen’s martensite is higher than that of the FST specimen’s martensite. The existence of residual austenite and martensite was determined by TEM. The crystallographic orientation, ratio of retained austenite, and amount of low-angle grain boundaries was studied using EBSD.
(3) The strength hardness values of SLM and FST H13 steel specimens are basically the same (being 561 and 568 HV, respectively), as is their tensile strength (being 1909 and 1962 MPa, respectively). However, SLM specimen elongation (12.4%) is a factor of three greater than that of the FST specimen (4.4%). Because of the high residual stress and poor density, the impact energy of the SLM specimen (14.4 J) is lower than that of the forged quenched specimen (15.7 J).
Experimental
Experimental equipment and materials
The specimens were fabricated using an EOS-M290 SLM machine (EOS, Munich, Germany) that mainly includes a 400 W fiber laser (Yb: YAG), a high-speed, high-precision galvanometer scanning unit, and an f–θ lens. The EOS-M290 can scan at a maximum speed of 7000 mm/s and build parts with sizes up to 100 × 100 × 120 mm. The substrate material is 45# steel, and the surface was treated with ethanol before the experiment.
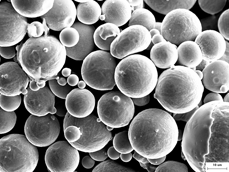
The H13 steel powder that was used has a size ranging between 15 and 50 μm, and its microstructure is shown in Fig. 10.
Microstructure of H13 die steel powder.

The H13 steel materials were produced in an intermediate frequency induction melting furnace. The melt was deoxidized with Al. After induction melting, the molten steel was cast into ingots. The produced ingots were thereafter used as consumable electrodes in electroslag remelting (ESR) experiments. The premelted slag was 65 wt% CaF2, 30 wt% Al2O3, and 5 wt% CaO. In the ESR process during which the H13 steel was forged at 1150 °C, the current was maintained at 1.0 kA. The heating rates of spheroidized annealing were 10 and 1050 °C/min, and the heat preservation time was 2.5 h. Thermal refining was accomplished by quenching in water and two tempering stages (at a temperature of 610 °C for 2 h and at a temperature of 580 °C for 2 h). The H13 steel after forging, spheroidized annealing, and thermal refining (FST) is referred to as the traditional specimen.
Experimental procedures
To optimize the laser power P and the scanning velocity V in the SLM process, in some experiments, the laser power was varied from first 160 W, to 170 W, then to 180 W, with a fixed hatch spacing of 100 μm, a layer thickness of 40 μm, and a scanning velocity of 350 mm/s; in the other experiments, the scanning velocity was varied from 350 mm/s, to 400 mm/s, then to 450 mm/s, with fixed hatch spacing of 100 μm, a layer thickness of 40 μm, and a laser power of 160 W. Ten cubic specimens (of 10 × 10 × 10 mm) were produced at various values of the laser power and the scanning velocity.
The laser energy input during fabrication can be better represented by the volume energy density. Here the volume energy density E is defined as the laser energy per volume and can be calculated by the following equation:
 $$E = {P \over {STV}}\quad ,$$
where P is the laser power, S is the hatch spacing, T is the layer thickness, and V is the scanning velocity [Reference Erdogan and Tekeli23].
The relative density was measured using Archimedes’ principle, in which an AUW220D electronic balance (with a precision of 0.0001 g) was used. The relative density can be calculated by the following equation:
 $$R = {{{\rho _{\rm{d}}}} \over {{\rho _{\rm{b}}}}} \times 100\% = {{{m_1} \times {\rho _{{{\rm{H}}_{\rm{2}}}{\rm{O}}}}} \over {{\rho _{\rm{b}}} \times \left( {{m_1} - {m_2}} \right)}} \times 100\% \quad ,$$
where ρd is the density of the H13 steel fabricated by SLM, ρb (7.85 g/cm3) is the standard density of H13 steel, m 1 is the weight of the specimen in air, m 2 is the weight of the specimen in water, and  ${\rho _{{{\rm{H}}_{\rm{2}}}{\rm{O}}}}$ (1.00 g/cm3) is the density of water [Reference Erdogan and Tekeli23].
The phase of the powder SLM-fabricated H13 specimens and traditional heat treatment specimens was determined by XRD using a Rigaku SmartLab diffractometer (Rigaku, Tokyo, Japan) equipped with a high-flux X-ray copper source (with a power of 9 kW). The scanning rate was 1.5°/min in the 2θ angular range of 30–120°. The microstructures were observed using a ZEISS EVO 18 scanning electron microscope (SEM; ZEISS, Jena, Germany), electron backscattered diffraction (EBSD), and a Tecnai G2 TF30 transmission electronic microscope (TEM; Thermo Fisher Scientific, Hillsboro, OR).
The Vickers hardness of the specimens was measured using an HXD-1000TMC/LCD microhardness tester (Cossim, Wuxi, China), with a dwell time of 10 s at a load of 500 gf. The tensile strength test was measured using an AG-X-100KN machine (Shimadzu, Kyoto, Japan) with a constant displacement rate of 0.2 mm/min at ambient temperature. Impact tests of specimens were performed using a JBW-750YD impact test machine (JBW-750YD: Shanghai, China). SLM samples were built horizontally (in the x–y plane). All of the tensile specimens are a nominal gauge section of length 35 mm and diameter 7 mm, and the Charpy impact sample size is 25 × 10 × 10 mm; these are processed with a deep 1-mm V groove. The fracture surfaces were also studied using SEM.
Acknowledgments
This work was supported by the National Natural Science Foundation of China (No. 51461025), KUST Lab Research Project (No. SYYJ08), and Science Project of Yunnan Education Committee (2016ZZX044). The authors gratefully appreciate the technical EBSD support received from Xusheng Yang and Xianghui Zhu of the Chongqing University of Technology.