INTRODUCTION
A century has passed since Robert T. Leiper fully elucidated the lifecycle of the major human schistosomes in Egypt (Leiper, Reference Leiper1915). Recognizing the characteristic egg-spine morphologies of Schistosoma haematobium and Schistosoma mansoni, he linked these parasites with obligatory freshwater intermediate snail hosts which are today recognized as species within the genera Bulinus and Biomphalaria (Brown, Reference Brown1994). By understanding the lifecycle as primarily being played out in freshwater, he pioneered simple control measures, which continue to this day, and avoided infection in man by reducing exposure to schistosome cercariae, the ephemeral larvae shed from aquatic snails which penetrate intact skin (Colley et al. Reference Colley, Bustinduy, Secor and King2014).
Since then, the history of schistosomiasis research and control is long and varied (Farley, Reference Farley1991; Jordan, Reference Jordan2000; Bergquist, Reference Bergquist2008). Whilst there have been areas in Africa and the Middle-East where the disease has much receded and even disappeared (Rollinson et al. Reference Rollinson, Knopp, Levitz, Stothard, Tchuente, Garba, Mohammed, Schur, Person, Colley and Utzinger2013), today the bulk of urogenital and intestinal schistosomiasis is found in rural Africa where it continues to induce ill-health and chronic suffering (WHO, 2013). In many sub-Saharan countries, schistosomiasis either alone or in combination with other neglected tropical diseases (NTDs) can be rife within rural communities that have limited access to safe water, adequate sanitation and hygiene, and have marginalized health care (Colley et al. Reference Colley, Bustinduy, Secor and King2014; Pullan et al. Reference Pullan, Freeman, Gething and Brooker2014). In these impoverished settings, the prevalence of HIV may be elevated, yet very little is known of the contributory role of female genital schistosomiasis (Kjetland et al. Reference Kjetland, Hegertun, Baay, Onsrud, Ndhlovu and Taylor2014), and the long-term management of these co-infections (Bustinduy et al. Reference Bustinduy, King, Scott, Appleton, Sousa-Figueiredo, Betson and Stothard2014).
Foundation of schistosomiasis control
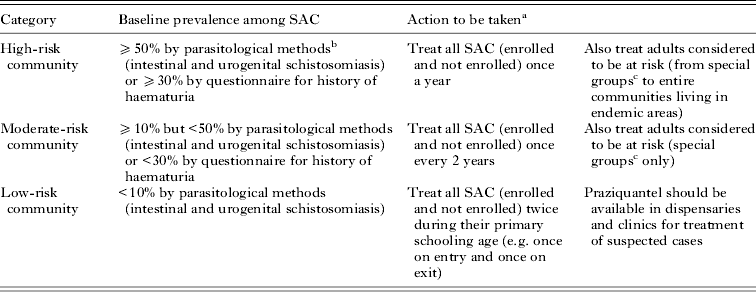
Like other NTDs amenable to control by mass drug administration (MDA) with orally administered medications, control of schistosomiasis is firmly based upon increased and regular access to praziquantel (PZQ), often given out in MDA within national control programmes (NCPs) (Fenwick et al. Reference Fenwick, Webster, Bosque-Oliva, Blair, Fleming, Zhang, Garba, Stothard, Gabrielli, Clements, Kabatereine, Toure, Dembele, Nyandindi, Mwansa and Koukounari2009; Stothard et al. Reference Stothard, Sousa-Figueiredo and Navaratnam2013b, Reference Stothard, Bustinduy and Montresor2014). The rationale for MDA typically follows a relatively simple treatment algorithm as guided upon parasitological diagnosis of school-aged children (SAC), as outlined in Table 1, and is set within a World Health Organization (WHO) approved strategy of preventive chemotherapy (PC) (WHO, 2006, 2013). However, as not all primary schools are examined, there are often significant gaps in our appreciation of the spatial distribution of disease. Owing to the often complicated geographical distribution and over-dispersion of disease (see below), there may be under- or over-treatment in some areas (Utzinger et al. Reference Utzinger, Raso, Brooker, de Savigny, Tanner, Ornbjerg, Singer and N'Goran2009) which has engendered debate (Brooker et al. Reference Brooker, Kabatereine, Gyapong, Stothard and Utzinger2009; Standley and Stothard, Reference Standley and Stothard2010; Cringoli et al. Reference Cringoli, Rinaldi, Albonico, Bergquist and Utzinger2013).
Recommended treatment strategy with PZQ for schistosomiasis (modified from WHO, 2006)

a Equivalent to: high-risk community – all SAC and adults require preventive chemotherapy annually; moderate-risk community – 50% of SAC and 20% of adults require preventive chemotherapy annually; low-risk community – 33% of SAC require preventive chemotherapy annually.
b For urogenital schistosomiasis, detection of haematuria by chemical reagent strips gives results equivalent to those determined by urine filtration.
c Special groups: pregnant and lactating women, groups with occupations involving contact with infected water such as fishermen, farmers, irrigation workers or women in their domestic tasks, to entire communities living in endemic areas.
In recent years, the mobilization and donation of PZQ has increased considerably (Fenwick et al. Reference Fenwick, Webster, Bosque-Oliva, Blair, Fleming, Zhang, Garba, Stothard, Gabrielli, Clements, Kabatereine, Toure, Dembele, Nyandindi, Mwansa and Koukounari2009), fostered by publication of its global need and projection within the WHO 2012–2020 roadmap (WHO, 2013). By outlining the future requirements more clearly, international pledges from major philanthropic agencies and donations from the pharmaceutical sector were formalized. For example, at the London Declaration on NTDs in January 2012, Merck-KGaA announced significant expansion of their annual donation of 20 million PZQ tablets to 250 million by 2016, ring fenced for treatment of SAC alone (Knopp et al. Reference Knopp, Becker, Ingram, Keiser and Utzinger2013a; Stothard et al. Reference Stothard, Sousa-Figueiredo and Navaratnam2013b). More recently in Paris during April 2014, further commitment of funds for the control of NTDs by improvement of water and sanitation was made public, hoping to foster inter-sectoral dialogue for better environmental management of disease.
The WHO roadmap clearly sets out global target numbers for annual treatment with PZQ in SAC and adults. That needed for SAC alone is just under 300 million tablets each year during the 2016–2019 period (WHO, 2013). Reaching these levels can be seen as both scale-up and maintenance phases of PC. From 2019 onwards, the global requirements for PZQ are envisaged to reduce in a scale-down phase. This commensurates with a projected general decline in prevalence of infection, as determined by parasitological methods, and contraction of disease landscape towards more progressively focalized areas and point sources of transmission (Rollinson et al. Reference Rollinson, Knopp, Levitz, Stothard, Tchuente, Garba, Mohammed, Schur, Person, Colley and Utzinger2013). In these ‘hotspots’, further reductions in transmission may be more stubborn to achieve, going beyond those which present MDA cycles can provide and requiring additional interventions (WHO, 2013). Somewhat counter-intuitively, perhaps in the drive towards elimination in these settings more aggressive PC strategies may be needed with more frequent MDA cycles.
From control to elimination
Across this changing epidemiological landscape with increased access to MDA, more accurate diagnosis of schistosomiasis will be required given the limitations of parasitological methods which are insensitive (Bergquist et al. Reference Bergquist, Johansen and Utzinger2009; Mutapi, Reference Mutapi2011; Knopp et al. Reference Knopp, Becker, Ingram, Keiser and Utzinger2013a). Some desirable future diagnostic tools and platforms have been identified (Solomon et al. Reference Solomon, Engels, Bailey, Blake, Brooker, Chen, Chen, Churcher, Drakeley, Edwards, Fenwick, French, Gabrielli, Grassly, Harding-Esch, Holland, Koukounari, Lammie, Leslie, Mabey, Rhajaoui, Secor, Stothard, Wei, Willingham, Zhou and Peeling2012; Silva-Moraes et al. Reference Silva-Moraes, Ferreira, Coelho and Grenfell2014). Once these new tools are available, they will be judged in terms of their reliability, affordability and scalability and not by supplanting parasitological methods entirely. The latter is important as infection and disease status of individuals and communities will need to be better addressed and sequentially monitored, as reference to parasitological baseline information will still remain for the foreseeable future (Lammie et al. Reference Lammie, Moss, Goodhew, Hamlin, Krolewiecki, West and Priest2012; Drain et al. Reference Drain, Hyle, Noubary, Freedberg, Wilson, Bishai, Rodriguez and Bassett2014). Nonetheless, future monitoring is set to take place over the forthcoming decades and will take advantage of several windows of opportunity within the NCP itself including its scale-up, maintenance and scale-down phases, with the overarching transition from control to elimination (Bergquist et al. Reference Bergquist, Johansen and Utzinger2009; Lammie et al. Reference Lammie, Moss, Goodhew, Hamlin, Krolewiecki, West and Priest2012; Prichard et al. Reference Prichard, Basanez, Boatin, McCarthy, Garcia, Yang, Sripa and Lustigman2012).
Parasitological diagnosis within a community is the underlying mainstay and guide for implementation and evaluation of MDA (Bergquist et al. Reference Bergquist, Johansen and Utzinger2009; Cavalcanti et al. Reference Cavalcanti, Silva, Peralta, Barreto and Peralta2013; Knopp et al. Reference Knopp, Becker, Ingram, Keiser and Utzinger2013a); however, there is not one generic diagnostic tool or method entirely ready or equal to achieve all of these tasks (Bergquist et al. Reference Bergquist, Johansen and Utzinger2009). To shed light on these aspects, we broadly review current methods used for diagnosis of schistosomiasis at the level of the individual, community and environment, highlighting strengths and weaknesses therein. We then discuss the future challenge managing the transition from control to elimination and use the Kingdom of Saudi Arabia (KSA) as a contemporary regional example (Hotez et al. Reference Hotez, Savioli and Fenwick2012). Here we illustrate that new, cost-effective diagnostics are needed alongside careful consideration and tailoring to embed them within the existing health system thus bridging this transition more securely.
DIAGNOSTICS AT THE INDIVIDUAL LEVEL
In short, there is no fail-safe method for detection of infection or disease in all putative cases; therefore, a combination of methods, sampling and diagnostic acumen is often needed (Utzinger et al. Reference Utzinger, N'Goran, Caffrey and Keiser2011; Poole et al. Reference Poole, Terlouw, Naunje, Mzembe, Stanton, Betson, Lalloo and Stothard2014). Depending on the presentation and stage of infection, diagnosis of schistosomiasis can be problematic having some unique and specific challenges (Stothard et al. Reference Stothard, Sousa-Figuereido, Betson, Adriko, Arinaitwe, Rowell, Besiyge and Kabatereine2011). This is broadly due to heterogeneities in exposure through water contact, temporal features within its complex lifecycle and the schistosome's evolved response to mitigate and avoid the host's immune system (Utzinger et al. Reference Utzinger, N'Goran, Caffrey and Keiser2011; Colley et al. Reference Colley, Bustinduy, Secor and King2014). Notably, as adult male and female worm pairs remain hidden and inaccessible being tucked away inside the blood vasculature system, they can be rarely quantified directly, but they can be happened upon at autopsy (Jaber and Kirby, Reference Jaber and Kirby2013) or often accidentally during abdominal surgery (Gulliver et al. Reference Gulliver, Agarwal and Vimplis2013).
As fecund adult female worms produce numerous eggs each day, diagnosis of infection typically centres upon eggs that are either ejected into the excreta of the human host, in the urine for S. haematobium and in stool for S. mansoni, or become lodged in host tissues, permitting later biopsy methods such as rectal snips or by cystoscopy (Colley et al. Reference Colley, Bustinduy, Secor and King2014). More importantly, trapped eggs release potent antigens that stimulate host immunity, which ultimately concludes in the formulation of granulomata, and other chronic inflammatory responses, to ‘wall off’ damage. It is the accumulation of such granulomata and fibrotic sequelae which gives rise to the primary mischief of chronic schistosomiasis, manifesting as bowel, hepatosplenic and urogenital tract disease (Colley et al. Reference Colley, Bustinduy, Secor and King2014). Less usual disease presentations are known, e.g. sequelae in the cerebrum and spine (Carod Artal, Reference Carod Artal2012).
It is this subtle distinction between the numbers of eggs released vs those that remain trapped that causes confusion over the importance between active egg-laying infections vs chronic disease. The correlate between number of eggs observed in excreta and level of overt pathology accumulated through time is not straightforward. To bring some epidemiological consensus, WHO guidelines classify the severity of infection by enumeration of shed eggs per gram (EPG) of stool, by Kato-Katz examination, as light (<100 EPG), moderate (>100–399 EPG) and heavy (⩾400 EPG) or eggs per 10 mL of urine by filtration, as light (<50 eggs) or heavy (⩾50 eggs) (WHO, 2006). Upon classification of the present intensity of infection, some prediction of the future occurrence of overt disease is possible. However, this relationship is imprecise and the clinical significance of even light egg intensity infections is being upwardly revised (Colley et al. Reference Colley, Bustinduy, Secor and King2014). Moreover, in high transmission environments it has been shown that preschool-aged children (PSAC) have overt morbidity yet ‘light’ egg-patent infection (Poole et al. Reference Poole, Terlouw, Naunje, Mzembe, Stanton, Betson, Lalloo and Stothard2014). Thus the detrimental effects of infection at such an early age are underestimated and it is important to note that the treatment needs of these infected PSAC with PZQ do not feature within the WHO 2012–2020 projection (Stothard et al. Reference Stothard, Sousa-Figueiredo, Betson, Bustinduy and Reinhard-Rupp2013a).
Any single measure of the intensity of egg-patent infection in stool or urine is an imprecise measure as it is a snap shot in time and does not estimate the duration of infection, which may be of several years and therefore poorly correlates with the cumulative total of trapped eggs. The significance of the distinction between active and chronic schistosomiasis may become blurred, especially in previously treated individuals, as does the disease status of an individual who has been ‘cured’ after treatment with PZQ which is measured by cessation of egg excretion (Stothard et al. Reference Stothard, Sousa-Figueiredo and Navaratnam2013b, Reference Stothard, Bustinduy and Montresor2014). In the context of control, it is this latter point that has important implications in the choice of diagnostics, for at the individual level those who are treatment-naïve or have had repeated treatment cycles of PZQ may have entirely different dynamics of egg excretion, confounding the application of diagnostic tools (Stothard et al. Reference Stothard, Sousa-Figuereido, Betson, Adriko, Arinaitwe, Rowell, Besiyge and Kabatereine2011; Stete et al. Reference Stete, Krauth, Coulibaly, Knopp, Hattendorf, Mueller, Lohourignon, Kern, N'Goran and Utzinger2012). By way of example, in a UK travel clinic setting re-infection can be safely ruled out while in the endemic setting resolution between incomplete cure and rapid re-infection is not always possible (Meltzer and Schwartz, Reference Meltzer and Schwartz2013).
Available diagnostic methods and proxy markers of morbidity
Whilst there are advanced methods in diagnostic imagery, i.e. magnetic resonance imagery and polymerase chain reaction (PCR) assays for detection of Schistosoma from extracted DNA from stool, urine or vaginal lavage, these do not feature within routine repertoire of NCPs (Webster et al. Reference Webster, Koukounari, Lamberton, Stothard and Fenwick2009; Kjetland et al. Reference Kjetland, Leutscher and Ndhlovu2012; Kato-Hayashi et al. Reference Kato-Hayashi, Yasuda, Yuasa, Isaka, Haruki, Ohmae, Osada, Kanazawa and Chigusa2013; Lodh et al. Reference Lodh, Mwansa, Mutengo and Shiff2013, Reference Lodh, Naples, Bosompem, Quartey and Shiff2014; Vinkeles-Melchers et al. Reference Vinkeles-Melchers, van Dam, Shaproski, Kahama, Brienen, Vennervald and van Lieshout2014). Figure 1 lists and outlines the strengths and weaknesses of commonly used diagnostic tools and methods which are either commercially available or in widespread use within NCPs. To compare the performance of each method in control or elimination settings, each technique is graded in simple terms of ‘–’ (not applicable), ‘+’ (applicable), ‘++’ (desirable) and ‘+++’ (optimal), at either baseline surveys, during PZQ efficacy investigations or in subsequent follow-ups likely as repeated in consecutive cross-sectional or longitudinal surveys.
Schematic depicting the present diagnostic tools for schistosomiasis that are either commercially available or in widespread use within NCPs, e.g. during baseline surveys, drug efficacy investigations and cross-sectional or longitudinal follow-ups. No mentioned diagnostics can infer precisely the adult worm burden or level of overt disease so a rating system of ‘–’ (not applicable), ’?’ (questionable), ‘+’ (applicable), ‘++’ (desirable) and ‘+++’ (optimal) is used. At the individual level, the distinction between traveller or endemic and adult or child should be made as this might frame the timing of last exposure. In so doing this highlights the possibility of hyper-infection where juvenile and adult worms co-circulate or are sufficiently mature to have commenced egg production. The background history of treatment with PZQ is also important and might confound diagnostic methods such as serology. [Notes: (A) serology is the ‘gold’ standard for first diagnosis, especially in the UK when travellers have returned home by 3-month post-exposure; (B) urine sampling is the most convenient but analysis of semen and vaginal lavage is important; (C) several different reagent strips exist and useful for detection of infection and disease, e.g. albuminuria and creatinine.]
Using blood and sera
Whilst eosinophilia is widely used in the UK and elsewhere as generic tests for helminthiasis (Logan et al. Reference Logan, Armstrong, Moore, Nebbia, Jarvis, Suvari, Bligh, Chiodini, Brown and Doherty2013; Paugam et al. Reference Paugam, Rabetokotany, Lesle, Challier, Dahane and Yera2013), schistosomiasis can be diagnosed on the basis of serology from clotted finger-prick blood by either immunological detection of circulating antigens, i.e. circulating cathodic antigen (CCA) and circulating anodic antigen (CAA) which are important not to be confused as they have distinct structural and diagnostic characteristics although both are released from the worms themselves, or upon detection of host antibodies to schistosome egg antigens (SEA) mainly by immunoglobulin G (Stothard et al. Reference Stothard, Sousa-Figueiredo, Standley, Van Dam, Knopp, Utzinger, Ameri, Khamis, Khamis, Deelder, Mohammed and Rollinson2009c, Reference Stothard, Sousa-Figuereido, Betson, Adriko, Arinaitwe, Rowell, Besiyge and Kabatereine2011). It is also possible to detect antibodies to adult worm or cercarial antigens but these assays are not yet in routine use and typical of antibody-based methods, these cannot differentiate between active and past infection (Coulibaly et al. Reference Coulibaly, N'Goran, Utzinger, Doenhoff and Dawson2013; Dawson et al. Reference Dawson, Sousa-Figueiredo, Kabatereine, Doenhoff and Stothard2013). The relative merits of serological detection, which are very sensitive, have been discussed elsewhere but an immediate drawback of these methods is that they do not discriminate between the different forms of intestinal or urogenital schistosomiasis, and are unable to identify mixed infections of both schistosome species.
In terms of commercial production, there is a robust SEA-enzyme linked immunosorbent assay (ELISA) kit retailed by SCIMEDX (New Jersey, USA) which is applicable in field-based laboratories, having a raw per-test cost of US$1·5 not including the price of a lancet, centrifugation equipment or staff processing time. Although ELISA assays for CCA and CAA exist, these are restricted to specialist laboratories that typically use in-house reagents. A point-of-contact (POC) lateral flow test is being developed for detection of CAA in sera and urine with funding support from the Schistosomiasis Consortium for Operational Research and Evaluation (SCORE) at the University of Georgia, USA.
The advantage of direct detection of CAA/CCA is that these antigens are released in the vomitus of extant worms and provide a useful proxy marker of adult worm burden or as a pharmacodynamic marker of worm death following treatment with PZQ. By contrast, no such relationship exists with antibody titres to SEA which remain positive long after treatment, being therefore unable to differentiate between active and past infections. Nevertheless, antibody methods have significant appeal in monitoring the rate of sero-conversion of naïve groups when elimination criteria are being developed. Anaemia is associated with schistosomiasis, as caused by a variety of mechanisms (Friedman et al. Reference Friedman, Kanzaria and McGarvey2005), and a significant correlation between increasing infection intensities and decreasing haemoglobin levels exists (Rollinson et al. Reference Rollinson, Klinger, Mgeni, Khamis and Stothard2005; Koukounari et al. Reference Koukounari, Fenwick, Whawell, Kabatereine, Kazibwe, Tukahebwa, Stothard, Donnelly and Webster2006; Fenwick et al. Reference Fenwick, Webster, Bosque-Oliva, Blair, Fleming, Zhang, Garba, Stothard, Gabrielli, Clements, Kabatereine, Toure, Dembele, Nyandindi, Mwansa and Koukounari2009; Green et al. Reference Green, Sousa-Figueiredo, Basanez, Betson, Kabatereine, Fenwick and Stothard2011). The POC technologies to measure finger-prick haemoglobin levels in remote and resource poor settings is well developed, portable and robust with Hemocue photometers (Hemocue Ltd; Ängelholm, Sweden) and can be amalgamated into general disease surveillance alongside schistosomiasis.
Using the stool
The detection of schistosome eggs in stool is often seen as the ‘gold’ standard and WHO treatment guidelines are developed upon the prevalence of egg-patent infections of S. mansoni, as determined upon examination of a single Kato-Katz thick smear by light microscopy. It is well known that a single Kato-Katz thick smear is insensitive but can be bolstered by repeated examination(s) of consecutive stool samples. In this operational setting, significant doubling or tripling of costs by increased sampling effort often goes beyond available resources and logistics of the survey team. In addition, in some cultural settings, in particular in Arabia, the provision of stool is problematic as being considered an unclean activity. Greater sensitivity can be accomplished with faecal concentration techniques using formol-ether (i.e. Ritchie technique) but this is more cumbersome and equipment needy than Kato-Katz (WHO, 2006). As mentioned previously, whilst the detection of eggs in stool can be considered definitive, the absence of eggs does not necessarily infer an absence of extant worms or chronic disease, thus better direct markers of morbidity are needed. This is especially true when considering the detection and grading of genital schistosomiasis in women and men (Kjetland et al. Reference Kjetland, Leutscher and Ndhlovu2012).
Recent proxy markers of morbidity that are commercially available include the use of rapid diagnostic tests (RDTs) for faecal occult blood (FOB) (Betson et al. Reference Betson, Figueiredo, Rowell, Kabatereine and Stothard2010, Reference Betson, Sousa-Figueiredo, Kabatereine and Stothard2012; Bustinduy et al. Reference Bustinduy, Sousa-Figueiredo, Adriko, Betson, Fenwick, Kabatereine and Stothard2013b). These may either take the form of immuno-chromatographic dipsticks or specialist reagent strips which have been shown to have strong associations with egg-patent infections of S. mansoni. With the development of RDTs that measure faecal calprotectin, preliminary application of these tests has shown strong associations with intestinal schistosomiasis, as might be expected because when eggs perforate the bowel they initiate both a release of blood and localized inflammation (Bustinduy et al. Reference Bustinduy, Sousa-Figueiredo, Adriko, Betson, Fenwick, Kabatereine and Stothard2013b). As FOB and calprotectin tests were developed for applications outside the use in detection of intestinal schistosomiasis (i.e. screening for colorectal cancer and inflammatory bowel disease syndrome), their market and commercial availability is likely set to be sustained over the next decade. Each test presently retails at US$0·5 and US$12·5 per test, respectively.
Whilst it is outside the remit of the present paper to discuss more broadly the sustainability of diagnostic tests (see Webster et al. Reference Webster, Koukounari, Lamberton, Stothard and Fenwick2009), it is worthy to note that without outside subsidy or philanthropic support the current diagnostic market for schistosomiasis in sub-Saharan Africa is likely not self-sustaining. Nonetheless, a first step towards encouragement of this market was taken in August 2013 when the Task Force for Global Health coordinated an inception meeting that developed key target product profiles for a variety of future diagnostic needs. It remains to be seen how the commercial diagnostic sector will respond or how the diagnostic market will expand.
Using the urine
The cardinal sign of urogenital schistosomiasis is frank blood in urine, being recognized in areas of endemic haematuria as being directly attributable to S. haematobium infection (Jordan, Reference Jordan2000). Using this feature, red-urine questionnaire methods have been used and incorporated into WHO treatment guidelines, e.g. when prevalence of recalled red-urine in SAC exceeds 30% the immediate area is considered high risk (WHO, 2006). Whilst the performance of the red-urine questionnaire has been debated (Stothard et al. Reference Stothard, Mgeni, Khamis, Seto, Ramsan, Hubbard and Kristensen2002a), for not all SAC accurately recognize their urine colour, it remains to be ascertained how the questionnaire fares when used in areas that have had prior MDA (Stothard et al. Reference Stothard, Mgeni, Khamis, Seto, Ramsan, Hubbard and Kristensen2002a, Reference Stothard, Mgeni, Khamis, Seto, Ramsan and Rollinsonb).
The operational ‘gold’ standard is syringe filtration of 10 mL of fresh urine collected between 10 am and 2 pm with filtrates viewed under the light microscope and enumeration of eggs. Recognized as being simple and cheap urine filtration became favoured over other methods, such as centrifugation, for being more pragmatic for school-based surveys where on-site electricity was not available. Like faecal examination, urine filtration may be conducted on samples on consecutive days but the gains in diagnostic sensitivity are not as dramatic as those in Kato-Katz (Stete et al. Reference Stete, Krauth, Coulibaly, Knopp, Hattendorf, Mueller, Lohourignon, Kern, N'Goran and Utzinger2012).
In resource-poor settings, reagent strips that detect microhaematuria have advantages over urine filtration and have been endorsed by WHO as providing broadly equivalent results and have been subjected to a recent systematic review. As there is a variety of reagent strip manufacturers (King and Bertsch, Reference King and Bertsch2013), it is known that the quality of product can vary, but foremost in reliability and use has been Hemastix® (Siemens Healthcare Diagnostics Products Ltd; Llanberis, UK). Each reagent strip is typically US$0·25 and the diagnostic performance of these strips as shown in a recent meta-analysis to be very favourable (King and Bertsch, Reference King and Bertsch2013), in a long-standing control programme (French et al. Reference French, Rollinson, Basanez, Mgeni, Khamis and Stothard2007; Stothard et al. Reference Stothard, French, Khamis, Basanez and Rollinson2009a; Knopp et al. Reference Knopp, Person, Ame, Mohammed, Ali, Khamis, Rabone, Allan, Gouvras, Blair, Fenwick, Utzinger and Rollinson2013b) on Zanzibar, Tanzania and in cross-sectional surveys in South Sudan (Robinson et al. Reference Robinson, Picon, Sturrock, Sabasio, Lado, Kolaczinski and Brooker2009).
In line with other reagent strips that detect additional urological parameters, e.g. urine-albumin or urine-to-creatinine ratio, these have also been proven useful to detect infection and be useful as a proxy marker of urinary tract disease (Sousa-Figueiredo et al. Reference Sousa-Figueiredo, Basanez, Khamis, Garba, Rollinson and Stothard2009; Stothard et al. Reference Stothard, Sousa-Figueiredo, Khamis, Garba and Rollinson2009b). With advances in portable machine readers, e.g. CLINITEK Status® (Siemens Healthcare Diagnostics Products Ltd; Llanberis, UK), possibilities now exist for automation of reading strips. Noteworthy is another commercially available urine-albumin assay (Hemocue Ltd; Ängelholm, Sweden), which has proven particularly useful in morbidity surveys in SAC (Rollinson et al. Reference Rollinson, Klinger, Mgeni, Khamis and Stothard2005) and PSAC (Poole et al. Reference Poole, Terlouw, Naunje, Mzembe, Stanton, Betson, Lalloo and Stothard2014).
As circulating Schistosoma antigens are excreted in the host urine, the development of urine-based lateral flow immuno-chromatographic dipsticks was proven possible and first developed into commercial production by EVL, the Netherlands in 2002 as the 1-step CCA assay (Stothard, Reference Stothard2009). After initial evaluations in the field (Stothard et al. Reference Stothard, Kabatereine, Tukahebwa, Kazibwe, Rollinson, Mathieson, Webster and Fenwick2006) and change of manufacturer to Rapid Medical Diagnostics (Cape Town, South Africa), the urine-CCA dipstick underwent a comprehensive trial for the detection of intestinal schistosomiasis in SAC. Retailing at slightly less than US$1·75 per dipstick the test has significant advantages over Kato-Katz examinations and has been informally documented by WHO in mapping the distribution of intestinal schistosomiasis in SAC (Standley et al. Reference Standley, Adriko, Alinaitwe, Kazibwe, Kabatereine and Stothard2009). The urine-CCA dipstick has also been used widely in monitoring intestinal schistosomiasis in PSAC and appears to be useful as an indicator of the efficacy of PZQ (Colley et al. Reference Colley, Binder, Campbell, King, Tchuente, N'Goran, Erko, Karanja, Kabatereine, van Lieshout and Rathbun2013). Its performance for detection of urogenital schistosomiasis is much poorer and may be confounded by cryptic co-infections with S. mansoni. With funding from SCORE a urine-CAA dipstick is being developed with much better diagnostic performance for both types of schistosomiasis (van Dam et al. Reference van Dam, de Dood, Lewis, Deelder, van Lieshout, Tanke, van Rooyen and Corstjens2013).
Additional markers of morbidity
The detrimental impact of schistosomiasis goes beyond that of direct markers of morbidity and can cause general effects on disability, growth, multi-organ damage and fitness (Balen et al. Reference Balen, Stothard, Kabatereine, Tukahebwa, Kazibwe, Whawell, Webster, Utzinger and Fenwick2006; Colley et al. Reference Colley, Bustinduy, Secor and King2014). In a similar manner to Fig. 1, a summary list is compiled in Fig. 2 and attempts to compare their usefulness at baseline surveys and subsequent follow-ups. The use of portable ultrasonography is perhaps the best method to visualize morbidity directly (Strahan et al. Reference Strahan, McAdam and Schneider2013). The success of some methods in terms of monitoring is dependent upon the length of time between follow-ups (Utzinger et al. Reference Utzinger, N'Goran, Caffrey and Keiser2011). For example, qualitative and quantitative changes in responses to quality-of-life questionnaires (Terer et al. Reference Terer, Bustinduy, Magtanong, Muhoho, Mungai, Muchiri, Kitron, King and Mutuku2013; Won et al. Reference Won, Abudho, Blackstock, Montgomery, Kennedy, Person, Mwinzi, Ochola, Foo, Hightower, Karanja and Secor2014) and clinical palpation studies likely have a slower temporal dynamic to fitness tests (Bustinduy et al. Reference Bustinduy, Thomas, Fiutem, Parraga, Mungai, Muchiri, Mutuku, Kitron and King2011, Reference Bustinduy, Parraga, Thomas, Mungai, Mutuku, Muchiri, Kitron and King2013a; Gurarie et al. Reference Gurarie, Wang, Bustinduy and King2011). Although useful in quantification of general morbidity during control phases of NCPs, it remains to be seen how these measures of disease, or associated ill-health, will be used as NCPs move towards elimination settings when active egg-patent infections are proven absent (Utzinger et al. Reference Scherrer, Sjoeberg, Allangba, Traore, Lohourignon, Tschannen, N'Goran and Utzinger2009, Reference Utzinger, N'Goran, Caffrey and Keiser2011).
Schematic depicting the additional diagnostic tools for detection of morbidity associated with schistosomiasis. In this instance, it is relatively unimportant to know the egg excretion or adult worm burdens of the child, since morbidity measures are directly observed and not inferred, but the setting in which they are used is context-specific. A rating system of ‘+’ (applicable), ‘++’ (desirable) and ‘+++’ (optimal) is therefore used in comparison to baseline and follow-up, and judged here annually, i.e. short-term changes, but the intervening period could potentially range across months, years or decades.
Measuring performance of PZQ
Despite being widely used, the background information on pharmacokinetics and pharmacodynamics of PZQ is surprisingly meagre (Colley et al. Reference Colley, Bustinduy, Secor and King2014; Olliaro et al. Reference Olliaro, Delgado-Romero and Keiser2014). The drug is licensed for administration at 2 dosages: 40 or 60 mg kg−1, in SAC and adults but when used for treatment of PSAC is in an off-label setting (Garba et al. Reference Garba, Lamine, Djibo, Tahirou, Aouami, Alfari, Phillips, Fenwick and Utzinger2013; Stothard et al. Reference Stothard, Sousa-Figueiredo, Betson, Bustinduy and Reinhard-Rupp2013a). It is outside the scope of the present review to assess the pharmacokinetics of PZQ, but consideration of pharmacodynamics is needed given the overlap with diagnostic tests.
Along with any MDA there are always concerns of the emergence of drug resistance and WHO have issued new informal guidelines on conducting initial drug efficacy checks. These centre upon definitions of parasitological cure and egg reduction rates (Montresor, Reference Montresor2011) which are also addressed by Levecke et al. (Reference Levecke, Brooker, Knopp, Steinmann, Sousa-Figueiredo, Stothard, Utzinger and Vercruysse2014) and the duration between treatment and follow-up (typically 21–28 days to circumvent the confusion over maturing schistosomes which are drug insensitive) (Scherrer et al. Reference Scherrer, Sjoeberg, Allangba, Traore, Lohourignon, Tschannen, N'Goran and Utzinger2009; Stete et al. Reference Stete, Krauth, Coulibaly, Knopp, Hattendorf, Mueller, Lohourignon, Kern, N'Goran and Utzinger2012; Garba et al. Reference Garba, Lamine, Djibo, Tahirou, Aouami, Alfari, Phillips, Fenwick and Utzinger2013; Tchueme-Tchuente et al. Reference Tchueme-Tchuente, Momo, Stothard and Rollinson2013; Webster et al. Reference Webster, Diaw, Seye, Faye, Stothard, Sousa-Figueiredo and Rollinson2013). Similarly, with the human immunodeficiency virus (HIV) epidemic in sub-Saharan Africa still expanding and with it the expansion of access to antiretroviral drug schemes, the performance of PZQ against this background of HIV-infected individuals needs some consideration (Bustinduy et al. Reference Bustinduy, King, Scott, Appleton, Sousa-Figueiredo, Betson and Stothard2014).
It is known that in high transmission areas parasitological cure when PZQ is administered at 40 mg kg−1 can be low (50–75%) which suggests that the killing effect of PZQ is sub-optimal (Stothard et al. Reference Stothard, Sousa-Figueiredo and Navaratnam2013b) as has been seen in PSAC (Sousa-Figueiredo et al. Reference Sousa-Figueiredo, Betson, Atuhaire, Arinaitwe, Navaratnam, Kabatereine, Bickle and Stothard2012). There is, however, the added confounding effect that worms may cease production of eggs while temporarily stunned by PZQ and then later recover fecundity to again shed eggs (Tchueme-Tchuente et al. Reference Tchueme-Tchuente, Momo, Stothard and Rollinson2013). A major diagnostic challenge remains to develop a diagnostic test that can explicitly measure worm death, and for better convenience within a shorter period than the present 21–28 days (Scherrer et al. Reference Scherrer, Sjoeberg, Allangba, Traore, Lohourignon, Tschannen, N'Goran and Utzinger2009; Utzinger et al. Reference Scherrer, Sjoeberg, Allangba, Traore, Lohourignon, Tschannen, N'Goran and Utzinger2009).
Of the tests presently under development it might appear that the POC-CAA test for sera and/or urine could be appropriate. Without such a sensitive test, future monitoring and evaluation of the performance of PZQ in areas characterized by ‘light’ egg-patent infections will become ever more demanding as several hundreds of children will need to be screened to find sufficient numbers of those with egg counts that can be measured reliably. A forthcoming situation somewhat analogous to the present difficulties in assessing the exact curative performance of PZQ in travellers who have sero-converted yet egg-patent infections in their excreta could not be proven (Logan et al. Reference Logan, Armstrong, Moore, Nebbia, Jarvis, Suvari, Bligh, Chiodini, Brown and Doherty2013).
DIAGNOSTICS AT THE COMMUNITY LEVEL
As outlined in Table 1, parasitological diagnosis of infections within SAC serves as a convenient anchor point to decide where local MDA is needed. In the context of control, not all primary schools are surveyed, for to do so would consume both time and financial resources typically outside that available within the NCP. Thus the delivery of MDA is a working compromise between areas thought to be at or are proven to be at-risk. The scenario can be illustrated in Fig. 3 which depicts information taken from a real landscape as recently mapped in Namibia where 200 primary schools have been visited and 60 children within each school examined using a combination of urine-CCA dipsticks and Hemastix®.
Examples of the disease landscape in control and elimination settings taken from contemporary data. The panel in green depicts the distribution of 200 schools as recently surveyed in Namibia (left) when 60 children per school were examined by CCA-urine dipsticks and reagent strips for microhaematuria. Prevalence of general schistosomiasis by school is then ranked in ascending order in the associated bar chart below (dotted line – mean prevalence (7·9%) of infection across schools, where the disease is present; dashed line – mean prevalence (6·5%) of infection across all 200 schools; blue line – a descriptive trend line; median prevalence (3·3%)). In elimination settings, the distribution of schools with raised prevalence likely tracks those before with higher prevalence and now may require more aggressive MDA. While many schools (and those that remain to be sampled) likely trend towards absence of infection as inferred with CCA-urine dipsticks and reagent strips, these levels likely under-estimate the true prevalence of infection, especially if a more sensitive diagnostic and larger sample size of examined children was used (dotted line – mean prevalence (6·3%) of infection across schools where the disease is present; dashed line – mean prevalence (2·1%) of infection across all 200 schools; blue line – a descriptive trend line; median prevalence (0·0%)).
Typical of schistosomiasis is the often complex distribution of high, medium and low prevalence schools (Utzinger et al. Reference Scherrer, Sjoeberg, Allangba, Traore, Lohourignon, Tschannen, N'Goran and Utzinger2009). In this instance, only schools that have been surveyed have been depicted, and there remain a further 600 schools not surveyed. Nonetheless when the sampled schools are assigned to the lowest administrative unit, and mean prevalence is calculated, typically across 20 schools, this gives a fair reflection of the local endemicity of schistosomiasis which is used to set the MDA cycle. In this example, the mean prevalence across all sampled schools is less than 10%; however, there is a great amount of variability in school-level estimated prevalence such that in several schools, prevalence exceeds 50%. Across these 200 schools, there are 18 schools that have prevalence of >10%. A corollary of this is that of the 400 schools which remain to be sampled, assuming a similar ratio of 0·09%, some 36 schools would be expected to have a prevalence of 10% or greater. Without conducting further on the ground surveillance their precise geographical locations will be unknown. With subsequent rounds of MDA the general prevalence of infection across all schools treated will decline and the pattern of infected schools will change, contingent upon local transmission factors, e.g. water contact, compatible snail distributions, etc. Even with advanced geospatial models, it is not yet possible to predict how prevalence within each sampled schools will trend (Brooker et al. Reference Brooker, Kabatereine, Gyapong, Stothard and Utzinger2009; Stothard, Reference Stothard2009). Whilst the total number of sampled schools with prevalence >10% is reduced, the spatial distribution will not be explicit until all non-sampled schools are surveyed.
The implications of this are 2-fold. First, to revise subsequent MDA schedules a resurvey of the same schools is needed (likely with the same diagnostic as not to incur diagnostic bias) unless there is a switch to a more sensitive diagnostic, as used in low transmission areas (Cavalcanti et al. Reference Cavalcanti, Silva, Peralta, Barreto and Peralta2013). In so doing the prevalence ascertained with the new diagnostic will likely inflate that measured previously, potentially confusing MDA treatment regimes until these are defined with the new diagnostic. Second, as the prevalence of disease declines by school, the current sampling frame of 60 children per school will likely be insufficient to identify subsequent declines in prevalence by ±2% with statistical significance. Therefore when prevalence is pushed to near unity or lower, sample sizes within each school will inflate and nearly all the children will be testing negative (Knopp et al. Reference Knopp, Becker, Ingram, Keiser and Utzinger2013a). There is, of course, the possibility to reduce the number of tests used by grouping, or pooling, specimens but the theory and practicalities of this are only starting to be developed (Mitchell and Pagano, Reference Mitchell and Pagano2012; Prichard et al. Reference Prichard, Basanez, Boatin, McCarthy, Garcia, Yang, Sripa and Lustigman2012; Cringoli et al. Reference Cringoli, Rinaldi, Albonico, Bergquist and Utzinger2013). Moreover, surveillance in the non-sampled schools will be needed and increase the sample frame of school sampling at each time point. Using large numbers of diagnostic tests as applied within all schools has a somewhat perverse cost-effectiveness scenario, in that it may be more costly to prove the disease absent rather than continue with MDA when the disease is much diminished or was actually not there.
Are diagnostics cost-effective in elimination scenarios?
To shed light on this unusual implication, Fig. 4 attempts to frame the argument. To determine the prevalence of infection to a reasonable level of precision and identify whether it is high risk, a small sample size of 15 children is sufficient if following a lot quality assurance sample frame (LQAS) (Brooker et al. Reference Brooker, Kabatereine, Myatt, Stothard and Fenwick2005, Reference Brooker, Kabatereine, Gyapong, Stothard and Utzinger2009) thus only 10s of tests are typically used to identify high and medium prevalence schools (Olives et al. Reference Olives, Valadez, Brooker and Pagano2012). When the prevalence of disease is lower, then local sample size increases to cater for the statistical precision necessary to differentiate minor changes in prevalence, e.g. ±2%. As one attempts to prove the infection prevalence is a fraction of 1% then sample sizes will continue to inflate, ultimately using 100s or possibly 1000s of tests, which nearly all will be negative.
(A) Idealized surface plot to depict how the number of diagnostic tests used increases as the prevalence by school declines. Within high-to-moderate prevalence schools less diagnostic tests are needed to guide local MDA; however, when prevalence declines towards low levels and becomes a fraction of 1%, the use of individual diagnostic tests will increase by 1–2 orders of magnitude at each evaluation. (B) Across this hypothetical surface that transitions from control to elimination interventions, there will be a tipping point when the costs for diagnostics outweigh that of MDA treatment(s). If more than 1 diagnostic tool or strategy is used concurrently then the ‘tipping’ point will be dynamic and context specific to the epidemiological landscape of either intestinal or urogenital schistosomiasis. At one end of this spectrum, with present diagnostic tools and methods, it will be much more expensive to prove the absence of infection rather than undertake unneeded MDA(s).
Thus if the average raw cost of a diagnostic is US$1·0 then up to several hundred dollars per school or location will be needed to prove that the disease is not there. By contrast, the price of delivery of treatment to the same location is a fraction of this cost. Implicitly, there will be a tipping point in costs when more money will be spent on diagnostics than that spent on treatments (Fig. 4B). Presently, this tipping point is not known and should be more explicitly defined or else the economics of elimination will make very little financial sense, unless international agencies are reconciled to short-term (⩽10 years) and long-term (>10 years) projections. The same logical arguments have been used before to justify the use of RDTs in initial mapping (Stothard, Reference Stothard2009) and will also remain true when schistosomes are to be screened in the environment for their absence.
DIAGNOSTICS FOR SCHISTOSOMES IN THE ENVIRONMENT
As the schistosome spends a considerable proportion of its time in aquatic environments, chiefly developing within compatible populations of Bulinus or Biomphalaria snails, some consideration in the use of diagnostics in snail intermediate hosts is needed (Rollinson et al. Reference Rollinson, Stothard and Southgate2001, Reference Rollinson, Knopp, Levitz, Stothard, Tchuente, Garba, Mohammed, Schur, Person, Colley and Utzinger2013), especially in elimination stages when transmission foci are to be progressively targeted (Rollinson et al. Reference Rollinson, Webster, Webster, Nyakaana, Jorgensen and Stothard2009). Although it is relatively simple to collect freshwater snails and inspect them for evidence of infection by natural shedding of schistosome cercariae or by crushing them to search for sporocyst, it is generally accepted that these measures are insensitive, for only a small proportion of snails (<5%) harbour patent infection (Rollinson et al. Reference Rollinson, Stothard and Southgate2001, Reference Rollinson, Webster, Webster, Nyakaana, Jorgensen and Stothard2009). There have been attempts to detect cercariae directly in freshwater bodies but the technology to do so needs improvement as often large volumes of water need to be filtered (Mull et al. Reference Mull, Secor, Foo and Hill2010; Rollinson et al. Reference Rollinson, Knopp, Levitz, Stothard, Tchuente, Garba, Mohammed, Schur, Person, Colley and Utzinger2013).
The development of molecular tests to detect schistosomes in snails first utilized antibody methods to Schistosoma proteins (Hamburger et al. Reference Hamburger, Weil, Turetzky, Ouma, Koech, Klumpp, Siongok and Sturrock1989), but this technology has been supplanted by PCR and latterly with experimental loop-mediated isothermal amplification (LAMP) assays (Hamburger et al. Reference Hamburger, Hoffman, Kariuki, Muchiri, Ouma, Koech, Sturrock and King2004, Reference Hamburger, Abbasi, Kariuki, Wanjala, Mzungu, Mungai, Muchiri and King2013; Abbasi et al. Reference Abbasi, King, Muchiri and Hamburger2010). Using real-time or traditional PCR approaches it is possible to screen field-caught Bulinus and Biomphalaria, as well as non-target molluscs, for evidence of schistosome infection (Akinwale et al. Reference Akinwale, Kane, Rollinson, Stothard, Ajayi, Akande, Ogungbemi, Duker, Gyang and Adeleke2011; Kane et al. Reference Kane, Stothard, Rollinson, Leclipteux, Evraerts, Standley, Allan, Betson, Kaba, Mertens and Laurent2013; Standley et al. Reference Standley, Vounatsou, Gosoniu, McKeon, Adriko, Kabatereine and Stothard2013). As an alternative, it is possible to deploy laboratory-bred snails in cages within putative transmission foci for a short 2- to 3-day period then to be later screened by PCR to assess whether any miracidia were present (Allan et al. Reference Allan, Dunn, Emery, Stothard, Johnston, Kane, Khamis, Mohammed and Rollinson2013). This has been undertaken recently on Unguja, Zanzibar (Fig. 5), as part of ongoing attempts to eliminate urogenital schistosomiasis from the islands. Using such approaches at water contact sites around Chaani school, the detection of snails positive for PCR is good indication of active contamination of the water habitats by infected children with S. haematobium.
Monitoring schistosomes in the environment using caged snails as sentinel miracidial traps. (A) Labelling laboratory bred Bulinus with enamel paint. (B) Plastic cage used to contain snails when deployed in freshwater habitat. (C) Submerged cage within Chaani stream tethered by string to an over-hanging branch. (D) Map of Unguja (inset) depicting Chaani school (cross) with an associated sketch map of the stream passing through Chaani. Along the stream snail cages were deployed at 7 monitoring stations for 2 days. Snails were then examined by PCR for evidence of schistosome DNA. Pie charts denote the prevalence of infection/exposure associated with each cage evidencing the presence of miracidia at 5 sites.
Expanding upon this sampling strategy, it is possible to scale-up the deployment of caged snails to verify ad hoc an absence of transmission; however, experiments such as this need to be repeated at several time points throughout the year to ensure there is no seasonality of transmission (Allan et al. Reference Allan, Dunn, Emery, Stothard, Johnston, Kane, Khamis, Mohammed and Rollinson2013; Rollinson et al. Reference Rollinson, Knopp, Levitz, Stothard, Tchuente, Garba, Mohammed, Schur, Person, Colley and Utzinger2013). This increased sampling, in turn, inflates budgets and resources needed for such detailed monitoring (Knopp et al. Reference Knopp, Person, Ame, Mohammed, Ali, Khamis, Rabone, Allan, Gouvras, Blair, Fenwick, Utzinger and Rollinson2013b, Reference Knopp, Stothard, Rollinson, Mohammed, Khamis, Marti and Utzingerc; Rollinson et al. Reference Rollinson, Knopp, Levitz, Stothard, Tchuente, Garba, Mohammed, Schur, Person, Colley and Utzinger2013). An additional complicating factor is that some of the DNA probes cross-react with non-human schistosomes and therefore assays can be confounded by the presence of veterinary schistosomes such as Schistosoma bovis (Rollinson et al. Reference Rollinson, Stothard and Southgate2001, Reference Rollinson, Webster, Webster, Nyakaana, Jorgensen and Stothard2009). As there are presently no specific WHO guidelines to frame these activities even in generic terms, the requirements necessary for certification of elimination of transmission in the environmental will remain ambiguous (Rollinson et al. Reference Rollinson, Knopp, Levitz, Stothard, Tchuente, Garba, Mohammed, Schur, Person, Colley and Utzinger2013).
SCHISTSOSOMIASIS IN THE KSA
In the WHO 2012–2020 roadmap, countries have been assigned into 1 of 3 categories and for the WHO-Eastern Mediterranean Region Office (EMRO) these are: (1) countries requiring PC (Egypt, Somalia, South Sudan, Sudan, Yemen), (2) countries requiring updating for planning and implementation purposes (Iraq, Libya, Oman, KSA, Syrian Arab Republic); and (3) countries requiring evaluation in order to verify if interruption of transmission has been achieved (Djibouti, Iran, Jordan, Lebanon, Morocco and Tunisia). The situation of schistosomiasis in KSA serves as a useful example of a country in transition from control to elimination as shown in the schematic map of Fig. 6 which outlines the areas of KSA where both intestinal and urogenital schistosomiasis are now found, albeit at egg-patent prevalence of <1%.
Outline map of the KSA with capital Riyadh depicted. Major administrative boundaries are shown and associated status of schistosomiasis therein is indicated by shaded circles. (A) Al-Jouf; (B) Tabuk; (C) Hail; (D) Al-Madena and Al Monawarah; (E) Al Qasim; (F) Riyadh; (G) Najran; (H) Taif, Makkah, Jeddah, Al Qunfudhah and Alith; (I) Al-Baha; (J) Bishah and Assir; (K) Jazan.
Beginning in 1974, KSA has sustained and adapted its NCP against schistosomiasis through a combination of treatment, health education and snail control with both chemical and environmental methods (Warrell, Reference Warrell1993; Hotez et al. Reference Hotez, Savioli and Fenwick2012). Originally implemented as a vertical programme, major declines from 11 to 1·9%, in general prevalence of infection, were achieved in the 1980s through the combined use of PZQ and chemical mollusciciding with Bayluscide®, and today KSA remains the largest purchaser of this product.
At the end of the 1980s with further effort still needed, the NCP was embedded into the primary health care (PHC) system in order to increase to at least 80% of the target population coverage, which then provided a more stable infrastructure to offer routine parasitological diagnostics (examination of stool by glycerol sedimentation for S. mansoni eggs and centrifugation of urine for S. haematobium eggs) with better opportunities to administer chemotherapy to infected cases (Ageel and Amin, Reference Ageel and Amin1997; Al Morad and Khan, Reference Morad and Khan2001; Ghahtani and Amin, Reference Al Ghahtani and Amin2005). Combined with general socio-economic improvement, continued use of molluscicides and active parasitological surveillance, schistosomiasis is now at very low levels of prevalence in certain areas of KSA. Indeed regions of KSA can be classified in 3 categories: (a) disease free, (b) transmission interrupted; and (c) low transmission (general prevalence <1%), see Fig. 6.
An interesting feature of pushing schistosomiasis to these very low levels raises the importance of containment of imported infections and a maintenance phase in use of molluscicides to prevent any reactivation of any previous transmission foci. From 2010 onwards, imported infections progressively outnumbered those that were considered autochthonous, i.e. locally acquired, and it is a challenge to the health surveillance system to maintain a test-and-treat strategy when illegal immigrants enter into the country, especially those from Yemen where urogenital and intestinal schistosomiasis is endemic (Oshish et al. Reference Oshish, AlKohlani, Hamed, Kamel, AlSoofi, Farouk, Ben-Ismail, Gabriellie, Fenwick and French2011; Sady et al. Reference Sady, Al-Mekhlafi, Mahdy, Lim, Mahmud and Surin2013). Similarly many of the wadi and river systems in Jazan originate within the Yemen and there remains the constant threat of populations of Bulinus and Biomphalaria being washed-in during times of flooding. Indeed, such an occurrence has recently taken place in March 2014 and is being investigated with targeted epidemiological surveys.
Thus moving forward from control to elimination of schistosomiasis in KSA and elsewhere in Arabia and Africa, 2 major challenges need to be addressed (Cavalcanti et al. Reference Cavalcanti, Silva, Peralta, Barreto and Peralta2013; Knopp et al. Reference Knopp, Becker, Ingram, Keiser and Utzinger2013a). First when and how can the switch over from parasitological methods to serological- and antigen-detection screening occur and be best harmonized within the PHC? Second, with newly adopted tools and sampling strategies how can imported infections be best contained to ensure there is no recrudescence of older foci following from reintroduction of schistosomes (Prichard et al. Reference Prichard, Basanez, Boatin, McCarthy, Garcia, Yang, Sripa and Lustigman2012). Before one diagnostic technology supplants another, cost-effectiveness calculations and health system simulations should be conducted to avoid unnecessary duplications or parallelisms, and by phasing-in quality assured tools and protocols it will not over-burden the PHC and achieve enhanced control. Of the two tests which could be most easily applied above parasitological methods, first, scaled-up screening of urine with CCA-tests would increase frontline surveillance for intestinal schistosomiasis and could mesh well with existing filtration methods for detection of eggs of S. haematobium, being used both in immigrants and in communities around putative transmission foci; second, serological analysis for host antibodies to SEA could be provided as a passive surveillance in the PHC centres to augment active case finding near or around putative transmission foci. Whilst the use of PCR in screening snails would help identify more precisely sites contamination of either S. mansoni or S. haematobium, this activity would be best performed outside the primary health care unit and within specialist molecular diagnostic laboratories at the district level but coordinated within the Ministry of Health at the central level.
OUTLOOK
In the drive for scale-up of MDA with PZQ, appropriate diagnostics still plays a central role in guiding and assessing the impact of PC. It is clear that in control settings the number of diagnostic tests used to define whether or not MDA is needed is much less than that needed in elimination settings. In this scenario, to prove that the disease is significantly less than 1%, 100s or possibly 1000s of tests are needed. Conventional parasitological sampling will likely continue to play an important future role, which may hamper the introduction of novel more sensitive diagnostics, until a financial tipping point is reached. Upon reaching this point, it should have been shown previously that there is a clear cost-effective benefit in better diagnostics offset against MDA costs. Monitoring the performance of PZQ with pharmacodynamic markers other than egg excretion, such as measuring levels of circulating schistosome antigens, should be encouraged.
ACKNOWLEDGEMENTS
We thank the BSP for realization of this meeting on diagnostics at Ness Gardens, University of Liverpool. Thanks also go to Dr David Johnston and Mr Richard Kane for assistance with surveys in Zanzibar and analysis of snail DNA. In addition to Prof. Alan Fenwick for purchase of diagnostic reagents in surveys associated with SCI activities. A special thanks to Dr Stark Katokele (Namibian MoHSS) and Prof. Bruce Noden (Polytechnic of Namibia) for their support during the surveys for schistosomiasis in Namibia as used as examples here.
FINANCIAL SUPPORT
The authors are grateful to have received funding from the Wellcome Trust, UK, The END Fund, The Bill & Melinda Gates Foundation, University of Georgia Research Foundation, Merck-Serono, and the European Commission.