Introduction
With the development of portable electronic devices and electric cars, the lithium-ion batteries become the primary technology [Reference Ding, Cano, Yu, Lu and Chen1, Reference Yao, Zheng and Liang2]. In order to adapt the growing energy needs, high energy density and long-term cycling stability have become the major selection criteria for lithium-batteries electrode materials.
Some cathode and anode materials with high capacity including metal oxides (e.g., Fe2O3 and CuO), Li–Sn, Li–Ge, and Li–Si alloys provide superior performance compared to the traditional commercial graphite electrode (372 mA h/g) [Reference Zhang, Hu, Guo, Zheng, Zhong, Song and Wan3–Reference Obrovac and Chevrier7]. Among these materials, Si has been regarded as the most promising candidate material for a high theoretical specific capacity of 3579 mA h/g (corresponds to Li15Si4 at room temperature), lower operating potential (∼0.2 V versus Li/Li+), and abundance of Si resource on earth [Reference Magasinski, Dixon, Hertzberg, Kvit, Ayala and Yushin8, Reference Wu and Cui9, Reference Liang, Liu and Xu10, Reference Tian, Xin, Wang, He and Han11]. Nonetheless, the application of Si anode faces some challenges, such as the ∼300% volume expansion/shrinkage during the repeated lithium alloying/de-alloying processes which leads to pulverization and cracking of Si and rapid capacity decay, as well as worse performance [Reference Mishra, Liu, Geppert, Wu, Li, Huang, Sun, Zhou and Ke12, Reference Kovalenko, Zdyrko, Magasinski, Hertzberg, Milicev, Burtovyy, Luzinov and Yushin13, Reference Jung, Ryou, Sung, Park and Choi14]. Besides, solid electrolyte interphase films, produced by the decomposition of organic electrolyte, will be reformed on the freshly exposed silicon surface during volume change. The thicker SEI would lead to irreversible capacity loss, inferior-rate capacity, and low coulombic efficiency of Si-based anode [Reference Zhao, Zheng, Wu, Chen, Su, Wang, Wang and Ren15, Reference Dou, Shi, Chen and Zhang16]. Moreover, the low electrical conductivity will inevitably cause poor kinetics and limit reaction rate, which makes it impossible for Si anode to obtain excellent electrochemical properties. Therefore, despite the unique advantages and an enormous potential of Si materials for high-performance lithium batteries, the above three major drawbacks seriously prevent the Si electrodes from its practical commercial application.
In order to solve the aforementioned problems, many approaches to improve the electrochemical properties of Si electrodes have been studied, mainly by including minimizing the particle size [Reference Zhu, Jin, Tan, Zong, Hu, Chen, Chen, Zhang and Zhu17, Reference Song, Wang, Lin, Jiang, Yu, Xu, Yu, Zhang, Liu, He, Pan, Shi, Zhou and Chen18], coating Si with a second phase [Reference Lu, Liu, Lee, Zhao, Li, Li and Cui19], and adopting new binders such as self-healing polymers and alginate [Reference Wang, Wu, Chen, McDowell, Cui and Bao20, Reference Zhao, Du, Ling, Battaglia and Liu21]. Meanwhile, various structures of Si have been synthesized such as porous structures [Reference Tian, Tan, Xin, Wang and Han22], nanotubes [Reference Park, Kim, Joo, Kim, Kim, Ahn, Cui and Cho23], nanowires [Reference Liu, Hu, McDowell, Jackson and Cui24], and so on. For instance, Bao et al. [Reference Bao, Wang, Chen, Li, Su, Wu, Tan and Lu25] demonstrated a three-dimensional hierarchical structure of cyclized-PAN/Si/Ni through the plasma-enhanced chemical vapor deposition method and represented 1200 mA h/g after 100 cycles at 100 mA/g. Yi et al. [Reference Yi, Dai, Gordin, Chen and Wang26] proposed a microsized Si–C material, which uses SiO as precursor. These methods all improve the cycle performance of silicon to some extent. Atomic layer deposition (ALD), as a novel strategy, can deposit relatively uniform thin films and the thickness of the coating can be controlled by adjusting the number of ALD cycles [Reference Zhang, Xu, Feng, Huang and Lee27, Reference Luo, Zhu, Luo, Shen, Fan, Dai, Liang, Wang and Hu28]. Diverse studies have also illustrated that thin Al2O3 [Reference Hwang, Park, Bok, Choi, Lee, Hwang, Choi, Seo and Park29], TiO2 [Reference Wang, Zhou, Hu, O’Hayre and Shao30–Reference Petkovich, Rudisill, Wilson, Mukherjee and Stein32], and TiN [Reference Savvides and Window33, Reference Dong, Chen, Gu, Zhou, Li, Liu, Han, Xu, Yao, Wang, Zhang, Shang, Cui and Chen34, Reference Kohandehghan, Kalisvaart, Cui, Kupsta, Memarzadeh and Mitlin35] passivation layers can increase both the structural and interfacial stabilities of Si-based composites. So far, ALD has not been applied to coat Si anodes with magnesium oxide.
In previous works, various Si anodes were synthesized by magnesiothermic reduction or other complicated processes [Reference Bok, Choi, Lee and Park36, Reference Liu, Lu, Zhao, McDowell, Lee, Zhao and Cui37]. Here, we prepare porous Si anode by a simple approach of etching Al–Si alloy. Meanwhile, to find an ideal method to enhance the performance of Si anode, we use ALD to deposit the MgO coating layer on the nano-sized Si dendrites. The obtained pSi@MgO composite exhibits good electrochemical performance due to the following reasons: (i) The built-in space of porous Si can mitigate the volume expansion, (ii) the uniform MgO layer may decrease the contact between active materials and electrolyte, and (iii) the MgO layers deposited by ALD are more compact than other methods [Reference Riley, Van Atta, Cavanagh, Yan, George, Liu, Dillon and Lee38, Reference Scott, Jung, Cavanagh, Yan, Dillon, George and Lee39, Reference Li, Liu, Banis, Lushington, Li, Cai and Sun40]. The most important thing is the thickness of MgO film could be digitally controlled by the adjustment of cycling numbers [Reference Wang, Guo, Gao and Wang41]. To date, the effect of MgO coating by ALD on Si anode performance has not been reported yet. It is of great significance to study the application of ALD in lithium-ion batteries.
In this work, the low-cost commercial Al–Si alloy was used as silicon precursor. Nano-sized porous Si dendrites were synthesized by a facile approach from etching the Al–Si alloy. Then, the thin MgO film was coated onto the nano-sized Si dendrites via ALD as the anode material for LIBs. As a result, the obtained pSi@MgO electrodes show good electrochemical performance by controlling the thickness of MgO.
Results and discussion
Figure 1 depicts the synthesis of pSi@MgO electrodes. In this work, the Si nanoparticles were obtained by etching Al–Si alloy. Then, the MgO layer was deposited on the Si nanoparticles by ALD method. The thickness of the MgO coating is highly sensitive in our work. It is a good illustration of the tremendous impact on the material properties of optimizing the thickness of MgO [Reference Bai, Yan, Yu, Cao, Wang, Zhang, Zhu, Hu, Dai, Lu and Zhang42].
Synthesis process for pSi@MgO electrodes.

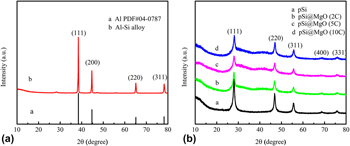
All samples were measured by X-ray power diffraction (XRD). As shown in Fig. 2(a), the Al–Si alloy exhibits the characteristic peaks of Al (2θ = 38.8°, 44.7°, 65.1°, and 78.2°) and one of the strongest peaks of silicon (2θ = 28.5°). And from Fig. 2(b), only five distinct diffraction peaks of Si at the 2θ values of 28.5°, 47.3°, 56.0°, 69.1°, and 76.4° were observed, which can be indexed to the (111), (220), (311), (400), and (331) crystal planes (JCPDS Card No. 27-1402), respectively. It indicates that after treatment with HCl and HF, the diffraction peaks of Al vanished and the porous Si dendrites exhibited a representative crystal structure. The patterns of pSi@MgO (2C), pSi@MgO (5C), and pSi@MgO (10C) are both exhibited in Fig. 2(b) for comparison. It can be seen that for pSi@MgO materials, no diffraction peaks corresponding to MgO have been found. This phenomenon may occur due to the following: (i) the MgO layer on the cathode electrode is an amorphous phase; (ii) the MgO layer is ultra-thin [Reference Kou, Li, Shan, Fan, Yan and Li43]. Furthermore, a broad bulge can be seen, suggesting that pSi with a high specific surface area has high activity and is easily oxidized even in an ambient atmosphere.
XRD patterns of (a) Al–Si alloy, (b) pSi, pSi@MgO (2C), pSi@MgO (5C), and pSi@MgO (10C).

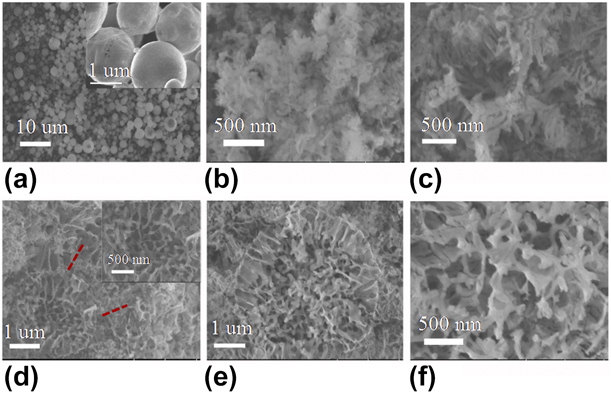
Scanning electron microscopy (SEM) was conducted to observe the surface morphology of different samples, as presented in Fig. 3. Figure 3(a) shows that the purchased Al–Si alloys are solid sphere shape with an average size of 3–5 µm. The structural evolution of Al–Si alloy at different etching times is observed in Figs. 3(b)–3(d). After etching process for 6 or 8 h, the solid sphere was transformed into porous Si dendrites, which were interconnected together highly. The alloy balls were broken into dendrites separately to some extent with a thickness of ∼50 nm at 10 h etching. The Al–Si alloy treated by HCl and HF is shown in Figs. 3(e) and 3(f). HF was used to remove the metal oxides. The obtained samples exhibit a porous property [Fig. S1(a), in Supplementary material], which could be profitable to the intercalation of Li+ and mitigate the change in the volume of Si upon cycling [Reference Li, Chen, McCue, Snyder, Crozier, Erlebacher and Sieradzki44, Reference Feng, Zhang, Li, Yang, Xiong and Qian45, Reference Kim, Pfleging, Kohler, Seifert, Kim, Byun, Jung, Choi and Lee46].
SEM images of Al–Si alloy at different etching times (a) 0 h, (b) 6 h, (c) 8 h, (d) 10 h, and (e, f) 10 h before treated by 2% HF 2 h.

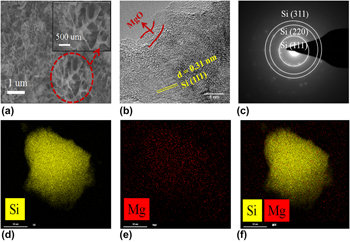
Figure 4 shows the typical images to better understand the morphology and constituent elements of the modified material: SEM, HRTEM, FFT diffraction pattern of pSi@MgO (10C) (a–c), and EDS elemental mapping data of pSi@MgO (50C) (d–f). In Fig. 4(a), the morphology of the porous Si dendrites is maintained and no obvious ultra-thin thickness of the MgO layer is observed. Evidently, transmission electron microscopy (TEM) observation of pSi@MgO (10C) indicates the existence of MgO coatings with a thickness of 2 nm in Fig. 4(b). It also reveals the poor crystallinity of MgO and well crystallized Si dendrites with a lattice fringe of 0.31 nm in (111) direction. To confirm the pore structure of pSi@MgO (10C), the N2 adsorption/desorption measurement was carried out and the results (Fig. S1, in Supplementary material) show that the specific surface area and the pore size distribution were not changed significantly after ALD coating. Therefore, the MgO layer may prevent the contact of electrolyte and Si. In addition, it can relieve huge volume changes during the charge/discharge processes. In Fig. 4(c), the selected electron diffraction pattern of pSi@MgO (10C) demonstrates crystal Si anode. In Figs. 4(d)–4(f), elemental mapping of Si and Mg shows that these elements are evenly distributed across selected regions, indicating that MgO is uniformly covered on pSi.
The typical images of the as-prepared materials: SEM, HRTEM, SAED pattern of pSi@MgO (10C) (a–c), and EDS mappings of Si, Mg, and overlay elemental mappings for Si and Mg in pSi@MgO (50C) (d–f).

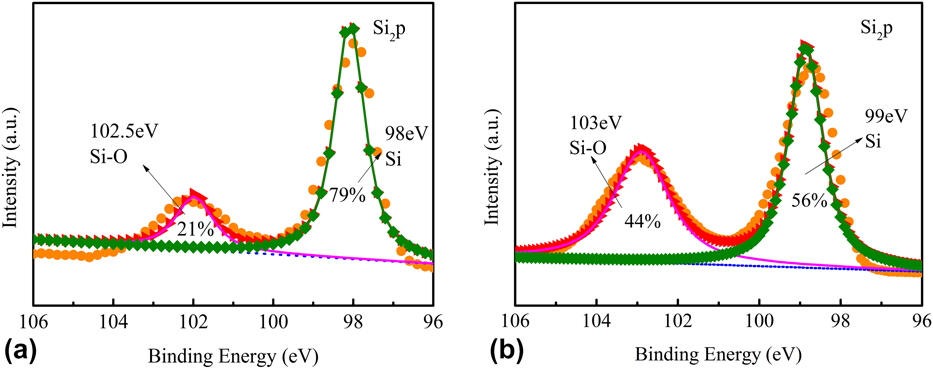
The high resolution Si 2p spectrum of pSi and pSi@MgO (10C) composites is characterized by X-ray photoelectron spectroscopy (XPS), as presented in Fig. 5. As seen in Figs. 5(a) and 5(b), a 98-eV peak associated with the Si–Si bond represents monatomic silicon, and 102.5 eV corresponds to the SiOx components (x ≤ 2). It is due that Si nanoparticles having a high specific surface area can be easily oxidized even in the ambient atmosphere. We also found that the intensity of SiOx peaks increased after ALD process because that the oxidation of nano-sized Si becomes easily. In addition, the presence of SiOx layers as a mesophase not only enhances the adhesive force of MgO on Si nanoparticles but also improves the electrochemical stability [Reference Xin, Zhou, Wang, Yao, Xu, Zhu and Liu47, Reference Zhou, Han, Jiang, Liu, Zhang, Ye and Liu48].
XPS spectra of Si2p of (a) pSi and (b) pSi@MgO (10C).

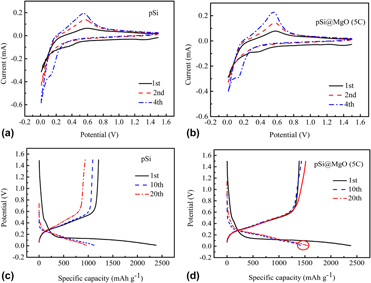
Figures 6(a) and 6(b) show the cyclic voltammetry (CV) measurement of pSi and pSi@MgO (5C) electrode at 0.1 mV/s between 0.01 and 1.5 V. As presented in Fig. 6(a), a cathodic peak of 0.37 V is observed at the first scan and then disappeared in the subsequent scans, which may be caused by the SEI film formed on the electrode surface. In the remaining cathode scans, a reduction peak of 0.1 V is considered to be the formation of LixSi phase. During the process of oxidation, one main peak appeared at 0.5 V, which corresponds to the de-alloying reaction of the LixSi alloy to Si. Compared to Fig. 6(b), pSi@MgO (5C) electrode represents stronger cathodic and anodic peaks indicating the better capacity retention and high reversibility [Reference Sun, Si, Liu, Deng, Xi, Liu, Yan and Schmidt49].
The CV curves of (a) pSi and (b) pSi@MgO (5C) in the 1st, 2nd, and 4th cycles and the charge–discharge profiles of (c) pSi and (d) pSi@MgO (5C) in the 1st, 10th, and 20th cycles at 100 mA h/g.

Figures 6(c) and 6(d) show the charge–discharge profiles of pSi and pSi@MgO (5C) electrodes at 100 mA/g within a voltage range of 0.01–1.5 V. During the first lithiation process, they exhibit a long and low plateau at 0.1 V while the plateau increased to 0.2 V in the later cycles. This indicates that the lithiation potential in amorphous Si is higher than that in crystal Si [Reference Zhou, Guo, Yan, Wang, Li, Yang, Zheng and Wang50]. Compared with Fig. 6(d), the 10th and 20th charging and discharging curves of pSi@MgO (5C) are overlapped to a large extent, which means that the electrode has a good cycling performance. The initial discharge and charge specific capacities of pSi are 2378.8 and 1209.8 mA h/g, respectively. Meanwhile, the coulombic efficiency is only 50.86% because of the formation of SEI film and the irreversible lithium ion in the anode [Reference Qi, Zhang, Liu, Zong and Men51, Reference Chan, Miller, Liang, Ellis-Terrell and Chan52]. In the 10th and 20th cycles, the discharge capacities decreased to 1117.2 and 962.5 mA h/g. The dramatic loss of capacity may be caused by the structural degradation. Comparatively, the pSi@MgO (5C) delivers an initial discharge and charge specific capacities of 2218.3 and 1384.7 mA h/g with a coulombic efficiency of 62.42% as shown in Fig. 6(d). This increase is associated with the protection of MgO. The presence of MgO coatings prevents the surface of pSi from being exposed to the electrolyte, reducing side reactions and forming a stable SEI film [Reference Lu, Chen, Pan, Cui and Amine53]. In addition, the porous structure and MgO layer are capable of accommodating volume expansion. Then, the specific discharge capacity increases to 1517.8 mA h/g at the 20th cycle due to the protection of MgO layer.
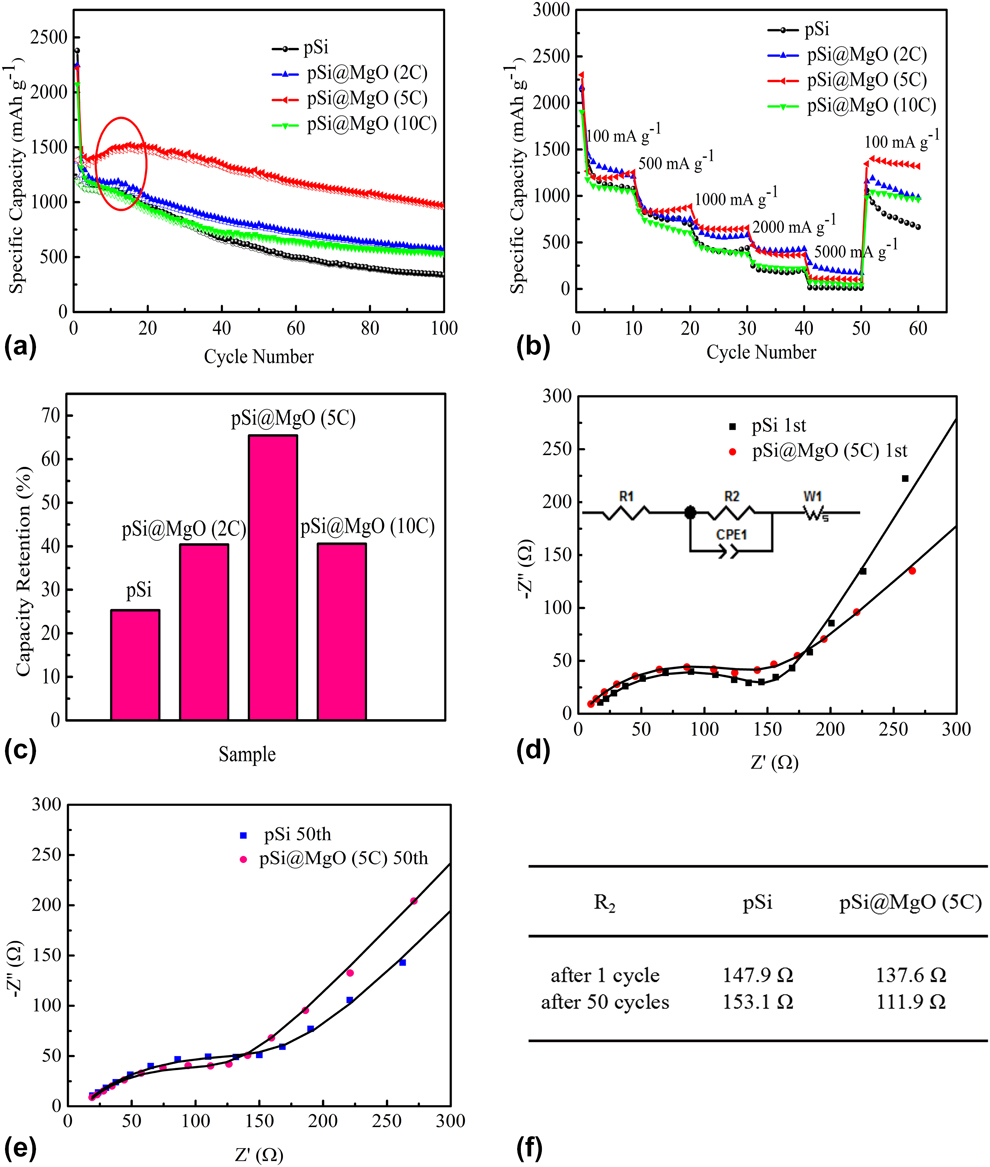
The cycling performance of various pSi@MgO composite electrodes is shown in Fig. 7(a) under a current density of 100 mA/g. It is obvious that the capacity of pSi decreases energetically. After coating MgO by ALD method, the performance exhibits a certain improvement particularly for the pSi@MgO (5C). This is because the volume change of the modified material is somewhat relieved. As with the result of the charge–discharge profiles, the specific capacity increased in the initial cycles. As with the result of the charge–discharge profiles, the specific capacity increased during the first 20 cycles. Such increase may be attributed to the following reasons: the Si inside the particles is not activated or fully discharged due to the longer diffusion distance of lithium ions. With deeper diffusion of Li+, the inside Si will be activated upon initial cycles which causing more active sites to be exposed and resulting in increased capacity. However, the specific capacity of pSi@MgO (10C) electrodes decays faster in the initial 50 cycles. The loss may be caused by the lower electrical conductivity of poor-crystallized MgO film. Figure 7(b) exhibits the rate capacity of pSi, pSi@MgO (2C), pSi@MgO (5C), and pSi@MgO (10C) at various current densities. The pSi delivers reversible specific capacities of 1076.4, 693.9, 440.2, 201.9, and 11.1 mA h/g at 100, 500, 1000, 2000, and 5000 mA/g, respectively, and its capacity only reaches 665.4 mA h/g as the current density is restored to 100 mA/g after 50 cycles. As the current density is gradually increased, the specific capacity of the sample is decreasing. This indicates that the large current density causes serious damage to the electrode structure and degrades its electrochemical properties. After 50 cycles, the electrode capacity is greatly improved when the current density back to an initial value of 100 mA/g. It shows that the structure of the electrode has a certain stability and does not completely destroyed at a large current density. It is obvious that a thin MgO layer could improve the rate performance. Especially for pSi@MgO (5C), after 50 cycles, it can recover to 1319 mA h/g at 100 mA/g. Figure 7(c) shows the capacity retention of pSi, pSi@MgO (2C), pSi@MgO (5C), and pSi@MgO (10C) after 100 cycles. Obviously, the pSi@MgO (5C) presents the better performance.
(a) Cycling performance at 100 mA/g, (b) rate capability and (c) specific capacity retention of pSi, pSi@MgO (2C), pSi@MgO (5C), and pSi@MgO (10C) after 100 cycles. (d, e) EIS and equivalent circuit of pSi and pSi@MgO (5C). (f) The fitted parameters of charge-transfer resistance (R 2).

For a better study of the reaction kinetics of the electrode surface, EIS measurement of the various electrodes is performed. Figures 7(d) and 7(e) show the Nyquist impedance spectra and the equivalent circuit diagram of the pSi and pSi@MgO (5C). In this equivalent circuit, R 1 (a semi-circular intercept on the real axis) characterizes the resistance of electrolyte. R 2 (semicircles in middle frequency range) indicates resistance of the Li+ transfer at interface between the electrode and the electrolyte. W 1 (inclined line in low frequency range) is the Warburg impedance that diffuses to the electrode for Li-ion. It is noted that the R 1 of pSi and pSi@MgO (5C) are 8.803 Ω and 2.888 Ω after 1 cycle, respectively. The lower resistance of pSi@MgO (5C) may be attributed to the stable SEI formation. The R 2 values are displayed in Fig. 7(f). It is evident that the R 2 of the pSi@MgO (5C) is lower than pSi, indicating that the diffusion and transfer ability of lithium ions is faster. After 50 cycles, the R 2 for the pSi@MgO (5C) electrode decreases from 137.6 to 111.9 Ω, which is accord with the excellent electrochemical performance.
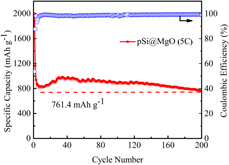
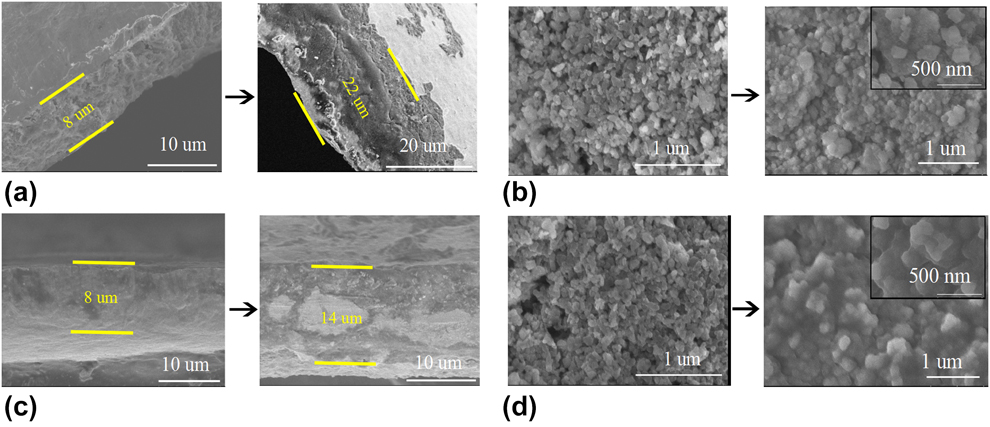
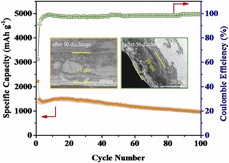
We perform a long-term cycling test on pSi@MgO (5C) electrodes at a current density of 500 mA/g. It can be seen from Fig. 8 that pSi@MgO (5C) demonstrates favorable cycle stability, and a high reversible capacity of 765.1 mA h/g is remained after 200 cycles. The obvious problem of silicon-based materials is volume expansion/shrinkage upon cycling. In order to study the changes of Si anode materials during cycling, the SEM was used to characterize the volume expansion in Fig. 9. Figures 9(a) and 9(b) indicate that the thickness of the pSi composite electrode increases from 8 um to 22 um, and some Si particles crack after 50 cycles. In contrast, the thickness of the pSi@MgO (5C) increases from 8 um to 14 um, and the Si articles still exist after 50 cycles. This provides a further proof for the stable electrochemical properties of the pSi@MgO (5C) electrode as shown in Fig. 7.
Cycling performance of pSi@MgO (5C) at a current density of 500 mA/g.

Cross-sectional and SEM images of the (a, b) pSi and (c, d) pSi@MgO (5C) before and after 50 cycling.

Conclusion
In this paper, the pSi@MgO composites were successfully synthesized via an ALD method. The thickness of the MgO coating is determined by the number of ALD cycles and the electrochemical tests show that the performance of pSi@MgO (5C) is better. The modified electrode displays prominent cycling performance and rate capability due to the unique structure, including porous Si and MgO layer. The pSi@MgO (5C) electrode delivers a high coulombic efficiency of 98.57% and a reversible capacity of 969.4 mA h/g after 100 cycles. Moreover, it still has 765.1 mA h/g at 500 mA/g after 200 cycles. The cross-section SEM image after 50 cycles shows that the increase in the thickness of pSi@MgO (5C) was smaller than pSi. Therefore, a uniform MgO layer deposited by ALD could alleviate the huge volume change during the process of charging and discharging. It is also found that the anode performance is sensitive to the thickness of MgO layer, and the thicker layer with lower electrode performance may originate from the resistance of ion transmission. Today, surface modification by ALD, including coating electrodes or active materials, has been widely used. To a certain extent, our work provides insights into application and understanding of ALD strategy in next generation rechargeable batteries.
Experimental
Preparation of porous Si dendrites
The Al–Si alloy (Al:Si = 90:10 wt%, Titd Metal Materials Co., Ltd., Changsha, China) as the silicon source was used to prepare nano-sized Si dendrites anode materials via chemical-etching. First, 4 g of Al–Si powders were added into 44 mL of deionized water and 10 mL of HCl (38 wt%) solution. The obtained solution was continuously stirred for 10 h to remove Al element. Afterward, the obtained product was centrifuged and then treated with 2% HF for 2 h to dispose of oxides on the silicon surface. Finally, the materials were cleaned by deionized water and ethanol and dried for one night in a vacuum at 60 °C.
Preparation of pSi@MgO composites
We use the ALD R200 Advanced system (Picosun, Finland Picosun, Finland) to deposit MgO [Reference Li, Liu, Meng, Tang, Banis, Yang, Hu, Li, Cai and Sun54]. The Mg precursor was bis-encyclopedic magnesium, and H2O was used as oxidizer. The reaction temperature was set as 250 °C. A typical cycle was carried out with the following four steps: (i) pulsing bis-cyclopentadienyl magnesium into reaction chamber for 0.1 s; (ii) eliminating the unconsumed bis-cyclopentadienyl magnesium and any by-products for 4 s; (iii) pulsing H2O into reaction chamber for 0.1 s; (iv) eliminating by-products and the unconsumed H2O for 4 s. MgO was deposited on the porous silicon dendrites with different cycles as 2, 5, and 10, which were named as pSi@MgO (2C), pSi@MgO (5C), and pSi@MgO (10C).
Material characterization
X-ray power diffraction (XRD; D8 Advance of Bruker, Bruker Corp., Beijing, China) measurements were used to investigate the crystalline phases of samples of Cu Kα radiation (γ = 1.54145 Å) in a 2θ range of 10°–80°. The scanning electron microscopy (SEM; SU8010, Hitachi, Ltd., Tokyo, Japan) and transmission electron microscopy (TEM; TecnaiG2 F30, FEI Company, Hillsboro, Oregon) were performed to observe the surface morphology and nanostructure of samples. The chemical composition and relative proportion about the electrode material were obtained by surface-sensitive X-ray photoelectron spectroscopy (XPS; VG ESCALAB MK II, VG Scienta, St Leonards-on-Sea, U.K).
Electrochemical measurements
For the fabrication of working electrodes, 70 wt% porous silicon, 20 wt% carbon black, and 10 wt% carboxyl methyl cellulose were mixed together. Then apply the slurry to the Cu foil and dry. The electrolyte was comprised of 1 M LiPF6 in a solvent mixture of ethylene carbonate (EC)/dimethyl carbonate (DMC)/fluoroethylene carbonate (FEC) (1:1:1 in volume). The lithium foil was employed as the counter electrode for the assembly of CR2032-type coin cells in an argon-filled glove box, where it contains oxygen less than 0.1 ppm. To ensure the enough soakage, the batteries were aged for 12 h before the electrochemical measurements. The cells were tested using a Land battery tester (LANHE CT2001A, Wuhan LAND electronics Co., Ltd., Wuhan, China) within 0.01–1.5 V (versus Li/Li+). CV was conducted between the voltage of 0.01 and 1.5 V (versus Li/Li+). The electrochemical impedance spectroscopy (EIS) measurements were tested between 100 kHz and 0.01 Hz.
Supplementary material
To view supplementary material for this article, please visit https://doi.org/10.1557/jmr.2019.150.
Acknowledgments
This research was supported by the National Natural Science Foundation of China (51572194 and 51672189), the Key Projects of Tianjin Municipal Natural Science Foundation of China (14JCZDJC32200), and Tianjin Science and Technology Project (18PTZWHZ00020).