The original suggestion to use rapid adenosine triphosphate (ATP) bioluminometers to monitor surface hygiene has yet to see practical fulfilment among healthcare infection control and prevention practitioners.Reference Griffith, Cooper, Gilmore, Davies and Lewis 1 Rapid ATP bioluminometry has been shown to reliably distinguish between 10-fold serial dilutions of various common bacterial species.Reference Aitken, Wilson and Pratten 2 , Reference Sciortino and Giles 3 ATP devices also produce a nearly instantaneous measurement of surface cleanliness, which has been suggested to provide useful feedback for quality improvement of cleaning services.Reference Smith, Beam, Sayles, Rupp, Cavalieri, Gibbs and Hewlett 4
Currently, authoritative sources have declined to endorse ATP testing on a stand-alone basis for monitoring surface hygiene in healthcare settings.Reference Carling and Huang 5 – Reference Loveday, Wilson, Pratt, Golsorkhi, Tingle, Bak, Browne, Prieto and Wilcox 7 While the detection of ATP on different surfaces has been validated with multidrug-resistant organisms (MDROs) where a large amount of contamination is present, little correlation has been made using ATP measurements when small amounts of infectious contaminants are present.Reference Gibbs, Sayles, Chaika, Hewlett, Colbert and Smith 8 , Reference Malik 9
Variability has been identified as a concern in the use of handheld ATP bioluminometers,Reference Whiteley, Derry and Glasbey 10 , Reference Shama and Malik 11 and 3 particular aspects are troublesome. First, the ATP reading scale known as relative light units (RLUs) lacks quantitation against a known standard and therefore cannot be calibrated, coincidentally diminishing interbrand comparability.Reference Whiteley, Derry and Glasbey 12
Second, as we have shown previously, this high variability leads to poor precision (repeatability) at a magnitude that prevents ATP devices from adequately distinguishing between similar ATP concentrations or similar levels of contamination.Reference Whiteley, Derry and Glasbey 12 In this earlier study, the presence of raw data ‘outlier’ readings was unpredictable and nominally undetectable to those using an ATP device, and these outliers can occur both above and below the interquartile range.Reference Whiteley, Derry and Glasbey 12 This variability can cause unexpected and unusual results, such as ATP readings that are higher following cleaning than prior to cleaning.Reference Cooper, Griffith, Malik, Obee and Looker 13
Third, the impact of this variability is greatest at the measurement level that defines the boundary between acceptable and unacceptable cleanliness. This criterion has been suggested through various studies at the lower end of the RLU reading range, between 500 RLU and 100 RLU, and is dependent upon the brand of ATP bioluminometer.Reference Lewis, Griffith, Galo and Weinbren 14 , Reference Mulvey, Redding, Robertson, Woodall, Kingsmore, Bedwell and Dancer 15 Attempts to correlate proposed cleaning standards with benchmarks expressed in RLUs, at the low RLU levels required for hospital hygiene, have been manifestly unsuccessful.Reference Boyce, Havill, Lipka, Havill and Rizvani 16 – Reference Smith, Gibbs, Sayles, Hewlett, Rupp and Iwen 19 Even the applications of a method utilizing a receiver operating curve have not resulted in a widely accepted definitional boundary for an ATP-based cleaning benchmark.Reference Mulvey, Redding, Robertson, Woodall, Kingsmore, Bedwell and Dancer 15 , Reference Smith, Sayles, Hewlett, Cavalieri, Gibbs and Rupp 20
Uncontrolled variability leading to poor precision is a major problem for statistical methods comparing differing treatment or control groups.Reference Lautenback, Woeltje and Malani 21 The risk of type I and type II errors in environmental monitoring is increased if the devices are subject to substantial variability.Reference Martin and Pierce 22 These type I and II errors using handheld ATP bioluminometers can present as false-positive or false-negative results, generating additional costs either way. Variability in results from ATP bioluminometers is the most recurrent technical concern regarding their use in cleaning monitoring studies using quasi-experimental frameworks.
Another particular concern with portable ATP devices is the risk of random error, which is undetectable in single monitoring samples.Reference Whiteley, Derry and Glasbey 23 Most studies have been focused on the risks of systemic error through reading inaccuracy over a wide range of dilutions; however, the magnitude of random error and accompanying dispersion of the data set (ie, RLU readings) has confused many studies.Reference Aitken, Wilson and Pratten 2 , Reference Sciortino and Giles 3 The issues of systematic error with ATP devices are not considered in this paper.
In this study, a continuation of our work, 4 commercial brands of rapid ATP bioluminometers were tested to validate their performance in a series of controlled experiments. The aim of this study was to assess the precision of and reproducibility of results from the ATP devices to qualify their role in cleanliness monitoring. The critical aspects of this study were the evaluation of the precision of the ATP measurements as expressed in RLUs and the assessment of the magnitude of random error using both pure-source ATP and bacterial ATP.
This paper outlines our findings regarding variability for all of the ATP devices we tested under controlled conditions.
METHODS
The 4 commercial brands of ATP bioluminometers and their consumables were considered in this work: 3 M (Cleantrace), Kikkoman (Lucipac-pen), Hygiena (Ultrasnap), and Charm (Pocket Swab Plus). This series of experiments investigated the response of each brand of ATP device across dilution series to known ATP quantities and to various bacteria in suspension cultures through direct application to swabs.Reference Whiteley, Derry and Glasbey 12 This method of application removed swab technique as a variable, thus exposing more clearly the underlying variability of the ATP devices. The use of multiple repetitions of dilution series established a practical dynamic range of concentrations for each of the ATP bioluminometers, both for a known source of ATP and for the ATP of bacterial species included in the studies. Each ATP device and its consumables were used in accordance with the respective manufacturer’s instructions, including refrigerated storage, use at room temperature, and consumables used prior to the expiration date.
Testing Using Quantitated ATP
Our study used a known source of ATP (Sigma Aldrich, Castle Hill, Australia) to assess ATP device response; while the quantitative aspects of the concentration of the ATP were confirmed using high-performance liquid chromatography (HPLC; Shimadzu, Japan) in a validated method. The use of a fully validated, laboratory HPLC allowed a defined quantity of ATP to be used on each sample, thus anchoring the experimental results and qualifying the confusing RLU scaling to minimize the risks of random and/or systematic errors in measurement. The method of application used 10 µL of each concentration of ATP solution applied directly to each swab using a calibrated pipette.Reference Whiteley, Derry and Glasbey 12
At each dilution point, replicated testing with a minimum of 3 swabs was used for each ATP bioluminometer, and wherever possible, test points were sampled in quadruplicate. For each dilution series, the experiment was repeated at least twice, using multiple batches of consumables from each of the ATP device suppliers.
The ATP solutions were tested in both a 10-fold dilution series and in a number of 20% dilution series at various concentrations of ATP. In total, >840 swabs were used to sample >200 concentrations. The Charm device and consumables were obtained toward the end of the study, so the number of sample concentrations and total number of swabs used to test that brand were smaller than for the other three brands.
Microbiological Testing
The experiments using bacterial-suspension cultures were each repeated on multiple occasions. At each concentration in the dilution series, testing was conducted in quadruplicate, and medians have been used to present typical responses.
The bacteria used in the experiments were Staphylococcus epidermidis (ATCC 12228) and Pseudomonas aeruginosa (ATCC 15692). All were tested as suspension cultures. While the strains tested are not regarded as intrinsically invasive, both S. epidermidis and P. aeruginosa have been associated with implanted device failure (S. epidermidis), multi-drug-resistant organisms (P. aeruginosa), and healthcare-associated infections.Reference Deva, Adams and Vickery 24 , Reference Lautenbach and Perencevich 25
Staphylococcus epidermidis and P. aeruginosa were enumerated by dilution series onto nutrient agar–spread plates (Oxoid, Thermo Scientific, Waltham, MA) incubated at 37°C for 48 hours. The P. aeruginosa plates were read at both 24 hours and 48 hours. The quantitative enumeration of the suspension cultures allowed for quantitation of the results and also minimized the risks of systematic error from RLU measurements.
Phosphate-buffered saline solution (PBS; Univar, Sydney, Australia) was used for the dilution series at 10 mMol/L and buffered to pH 7.0 The solution was freshly made and sterilized with each experimental round. During an early experimental round, dilutions prepared with tryptone soy broth (TSB) were found to interfere with one of the ATP bioluminometers (Kikkoman), and the use of TSB was discontinued thereafter. This TSB interference observation was confirmed subsequently with separate laboratory operators in an independent test run.
Tests were conducted in 10-fold dilution series and a number of 20% dilution series at various concentrations of suspension culture. All test concentrations were tested in quadruplicate; however, in some instances samples were measured in triplicate. Testing against bacterial cultures was conducted by direct application in the same way ATP was tested, with 10 µL applied per swab. In this study, we used >1200 ATP swabs and ~300 individual concentrations of bacterial suspensions.
Statistical Approach
Because the ATP bioluminometer readings in RLU were not comparable between brands, absolute measures of random error, such as standard deviation, were not directly comparable between brands. The standard deviation increased with increases in the underlying value of tested dilutions, so another statistical measure was required.Reference Wood and Durham 26 To assess the relative size of the random error, measurements were normalized using the coefficient of variation (CV), which is the ratio of standard deviation to the mean.Reference Reed, Lynn and Meade 27 This method is particularly helpful with non-symmetrical data.Reference Wood 28
This normalized measurement allowed the comparison of instrument precision among brands at varying concentrations. A CV of 0.4 implies the average distance between observations at a single concentration for that ATP device; the mean of those observations is 40% (0.4) of that mean. Alternatively, if the mean was equal to the absolute truth of the measurement for that ATP device, the expected error (or precision in this case) would be ~0.4 times the mean, but according to Reed et al,Reference Reed, Lynn and Meade 27 a 1 in 5 chance remains that the reading will be incorrect (imprecise) by a factor of 2 or more.Reference Reed, Lynn and Meade 27 The higher the CV, the lower the precision of the equipment.
The replicated data from the experiments were used to obtain the individual CV for each set of readings for each device at each concentration point, which captured the precision in a highly variable data set with these rapid ATP bioluminometers.Reference Whiteley, Derry and Glasbey 10 , Reference Malik and Shama 29 The use of CV as statistical approach can also capture both the random error and some of the systematic errors, which directly affects the precision of ATP measurements.
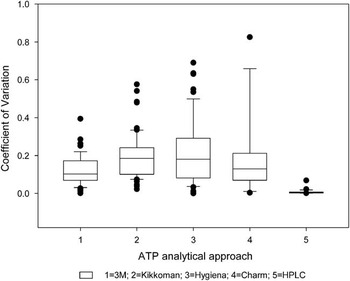
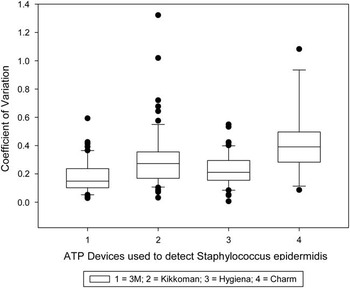
The distribution of CVs is summarized in Figures 1–3 using boxplots. In the plots, the central line in each box represents the median value, with a box drawn around the second and third interquartile ranges. The whiskers (the lines extending both below and above the box) represent the tenth and ninetieth percentiles of the range; the dots above and below represent values that are outside the expected spread of results (ie, outliers).
Coefficient of variation for 4 ATP bioluminometers using ATP testing.

Coefficient of variation for 4 ATP bioluminometers using Staphylococcus epidermidis.

Coefficient of variation for 4 ATP bioluminometers using Pseudomonas aeruginosa.

The regularity of outliers both above and below the interquartile ranges of samples was noted as a problem early in these studies. Arithmetic median was used rather than averages to remove the distortion caused by outliers in raw data sets. When considering dynamic range, however, this sampling approach is not always available for use in field-based measurements. The CV method was preferred to signal-to-noise ratio (
 $$\bar{x}$$
/σ) due to the large volume of random error.
All calculations were conducted and graphs were produced in Microsoft Excel 2010 (Microsoft, Seattle, WA), and where required, these calculations were confirmed using Sigma Plot (Systat, San Jose, CA) or SPSS (IBM, NY).
RESULTS
Variability measures for all 4 bioluminometers were standardized using the coefficient of variance (CV). The 3 testing platforms for the ATP bioluminometers and their consumables first quantitated pure-source ATP (Figure 1) then the ATP of the 2 bacterial species S. epidermidis (Figure 2) and P. aeruginosa (Figure 3). The variability expressed as CV was present across the full dynamic range for all ATP bioluminometer brands tested and was not concentration dependent.
Figure 1 indicates the CV present in all 4 ATP bioluminometers and displays the contrast of very low CV calculated for the HPLC. HPLC measurements, taken in triplicate, demonstrated a correlation of r=.998, indicating the high precision and low variance expected of a fully calibrated precision laboratory instrument. When compared with the HPLC values, all 4 of the ATP devices indicated higher levels of variance, and 2 of the devices (Kikkoman and Hygiena) produced CV>0.4. In a prior study, also using known-source and quantitated ATP, the 3M device also produced CV=0.4.Reference Whiteley, Derry and Glasbey 10
Figure 2 shows the CV for all 4 ATP bioluminometers when measured against quantitated dilution series using the Gram-positive bacterium S. epidermidis. Figure 2 indicates that all 4 ATP bioluminometers scored a CV>0.4 and 2 of the devices (Kikkoman and Charm) showed CV>1.0 (σ>
 $$\bar{x}$$
).
Figure 3 indicates the CV for all 4 ATP bioluminometers when measured against quantitated dilution series’ using the Gram-negative bacterium P. aeruginosa. Figure 3 clearly indicates the same pattern of CV shown in Figures 1 and 2.
The experimental series used >500 sample concentrations and >2,000 swabs with robustly defensible and repeated outcomes.
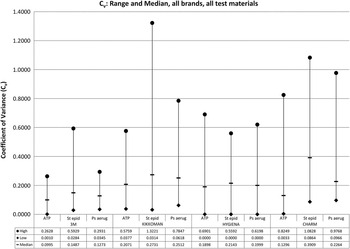
Figure 4 shows the overall spread for the 4 devices with the range (high–low) and median indicated for each ATP bioluminometer brand and each material tested. The median readings of all 4 ATP devices against the 3 validated soiling materials (pure-source ATP and 2 bacteria) yielded CVs clustered between 0.0995 and 0.39. As shown in Figure 4, all 4 brands produced at least 1 high-range value (CV>0.5), which undermines confidence in instrument precision for field use, particularly where surface sampling uses only a single swab.
Coefficient of variation: range and median for all brands tested and all test materials.

DISCUSSION
The use of rapid ATP testing in the monitoring of environmental cleanliness in healthcare settings has the advantages of quick response, semi-quantitative evaluation, ease of use, and immediate feedback regarding cleaning performance outcomes for surface cleaniness.Reference Smith, Beam, Sayles, Rupp, Cavalieri, Gibbs and Hewlett 4 , Reference Mitchell, Wilson, Dancer and McGregor 6 Rapid ATP monitoring also has identified flaws that require careful consideration when designing a sampling regimen.Reference Malik 9 , Reference Shama and Malik 11 , Reference Malik and Shama 29
A high level of variability using rapid ATP bioluminometers was observed across all of the brands tested with CV results; similar results were acquired between brands for both quantitated ATP and bacterial suspension cultures. The lack of precision and lack of reproducibility when using commercial rapid ATP bioluminometers undermines both the validity of the results and the confidence with which the devices can be used, particularly in busy healthcare environments with cost constraints on sampling. Furthermore, variability in RLU readings increases the likelihood of both false-positive and false-negative outcomes from studies in which metering variation is not considered prior to interpretation of results.
In healthcare, complexity in the management of cleaning is compounded by the irregular distribution of microorganisms despite recognition of some location patterns.Reference Rastogi, Shah, Perlman, Bhutada, Grossman, Pagala and Lazzaro 30 , Reference Moore, Muzlay and Wilson 31 The presence of dry-surface bacterial biofilms containing multidrug-resistant organisms adds another level of uncertainty in the monitoring of cleanliness.Reference Vickery, Deva, Jacombs, Allan, Valente and Gosbell 32 The accurate measurement of cleanliness failure is essential for infection prevention, and if measurement is accurate and precise, the sampling method can be minimized as a confounder in underestimating the presence of pathogenic contaminants.Reference Galvin, Dolan, Cahill, Daniels and Humphreys 33
In cleaning monitoring, the use of an environmental sampling method can lead to both type I and type II statistical errors. The dangers of a false-positive RLU reading (type I error) may be the cost of additional cleaning. This cost could be significant if the cleaning benchmark is set unreasonably low or if the ATP bioluminometer overstates the level of contamination due to random error. Importantly, false-negative test results with inaccurately low RLU readings (type II error) compound the potential infection risks from insufficiently cleaned surfaces.
Quality assurance is compromised when a device such as an ATP bioluminometer lacks the precision required to reliably articulate cleanliness as intended by its use. Reliability in the precision of RLU readings is particularly important at the low end of the dynamic range where the correlation between ATP detection and the presence or absence of pathogenic microbes is most difficult to determine.Reference Gibbs, Sayles, Chaika, Hewlett, Colbert and Smith 8
One way to reduce variability is to address the RLU scaling, which is highly relative and is different for each brand of ATP device.Reference Whiteley, Derry and Glasbey 12 An interim way to manage the impact of variability with ATP devices is to manage the sampling plan through the sequential and parallel use of different methods of cleaning monitoring.Reference Whiteley, Derry and Glasbey 34
The results presented here were obtained with the advantages of controlled conditions, multiple repetitions, large numbers of swabs used in a wide array of concentrations across the entire reading range of the devices. Unfortunately, this strictly controlled approach probably underestimates the level of variation that occurs in uncontrolled field-based studies; for example, swab technique adds additional variability. A shortfall of this study was that just 1 ATP device per brand was used in the experiments. Purchased consumables (albeit used according to manufacturer recommendations) lack consistency that may not be reflected in manufacturer-supported studies with fresh consumables and strict batch controls. However, this work does represent the normal experience of field use, suggesting that all brands of ATP devices exhibit similar variability and lack of precision.
Furthermore, in this study, more repetitions may have decreased the range of CV results, thus bringing the mean and median into closer alignment. However, the range data (Figure 4) would be unaffected.
Rapid ATP measurement using handheld devices is quick and relatively inexpensive, but caution is required in the interpretation of results. As ATP devices are currently configured, the inherent variability and lack of precision in the results obtained may lead to erroneous conclusions; thus, data collected using these devices and the conclusions stemming from them warrant careful consideration.
Acknowledgments
The authors are grateful to Dr Michael Phillips (Senior Lecturer, Microbiology, University of Western Sydney) and to Ms Carol Adkins (Laboratory Manager, Microbiology, University of Western Sydney, Hawkesbury Campus) for assistance with microbiology, culture production, and laboratory materials. The authors thank Dr Richard Shaughnessy, University of Tulsa, and the Cleaning Industry Research Institute International for the loan of the unit for ATP testing.
Financial support: No financial support of any kind was received from any company or person involved in the manufacture, sale, or distribution of a specific brand of ATP bioluminometer or its consumables. GSW and TG are employees of Whiteley Corporation; GSW is a PhD student at the University of Western Sydney. Funds for consumables and ATP devices were provided by UWS and Whiteley Corporation. CD and PF are staff at the University of Western Sydney.
Potential conflicts of interest: None of the authors has any potential conflict of interest with any of the materials or products mentioned in this paper. Whiteley Corporation has no affiliation of any type with ATP bioluminometers or their consumables, save for product purchases for this study. All authors have signed the requisite declaration of conflict of interest as required by ICMJE.