


1. Introduction
Shipborne thermal infrared radiometers have been extensively used to obtain sea-surface temperature (SST) data in tropical and temperate waters (Saunders, 1973; Katsaros, 1980; Robinson and others, 1984). Barton and others (1993, 1995) presented results from shipborne observations using a radiometer equivalent to the European remote-sensing satellite (ERS-I) along-track scanning radiometer (ATSR) on ships around Australia. Relatively few measurements of this kind have been collected in polar oceans (Hepplewhite, 1989; Rapier, 1995; Thomas and others, 1995), and over sea ice in particular.
In this paper, we present an analysis of surface temperature data collected over East Antarctic sea ice by shipborne radiometers, including first results from the shipborne ATSR sensor operating over sea ice. The surface tem-perature of the snow or ice is a key variable affecting sea-ice growth and melt rates and heat fluxes between the surface and atmosphere. The purpose of this experiment was to conduct a preliminary investigation of the use of thermal infrared radiometers to characterise Antarctic sea ice. The eventual aim is to compare ground-based validation measurements with coincident satellite data (from the ATSR and advanced very high-resolution radiometer (AVHRR)) to develop a widely applicable snow/ice surface temperature algorithm similar to those developed in the Arctic by Key and Haefliger (1992) and Massom and Comiso (1994).
The sea-ice thickness distribution is a key parameter that cannot be measured directly from space but which can be inferred from thermal infrared data. Particularly intense heal fluxes occur through thin ice and open water compared to thicker ice (Maykut, 1982), and ice-formation rates are correspondingly higher in leads and polynyas. For a given air temperature, the thermal contrast between ice types of different thickness should be sufficient to enable broad discrimination based upon thickness (unless the air temper-ature is close to the temperature of the underlying water). This is limited to some extent by the presence of a snow cover, with its low thermal conductivity. The determination of sea-ice thickness is more reliable for the thinner classes of sea ice (e.g. nilas, gray-white ice) which are often snow-free. The second aim of this study is to evaluate the radiometric surface temperature data as a proxy source of sea-ice thickness information.
2. Materials and Methods
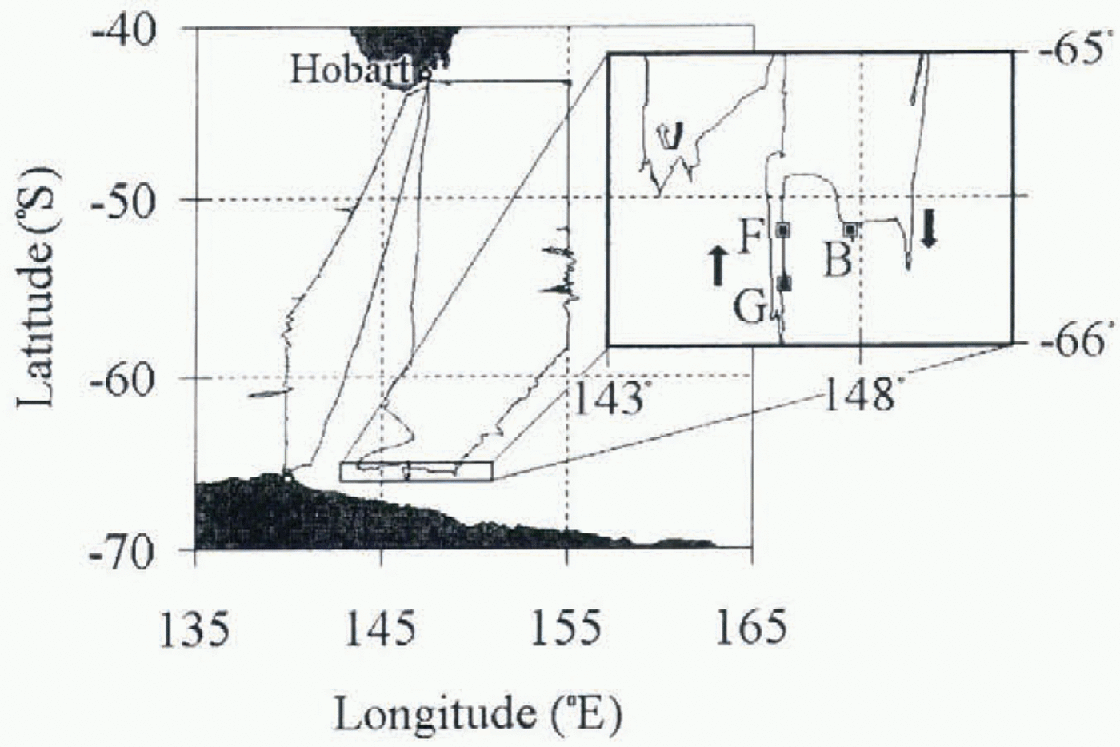
Two thermal infrared radiometers were installed on board the RSV Aurora Australis during Voyage 9 of the 46th Australian National Antarctic Research Expedition (ANARE) in March May 1993. in this study, surface temperature data from the radiometers are compared with snow and ice con-ditions and environmental data observed both from the ship and in situ. Three stations were chosen for this purpose, based upon the availability of data from both radiometers, and suitable video footage, ice-surface temperatures and ice and snow thickness data (table 1). Figure 1 shows the ship's track and the location of the three ice stations (B, Fand G).
Details of the ice stations selected as periods of study. Source: Worby and Massom (1995)

Voyage 9 cruise track and location of the ice stations in this study. Note: during the voyage, the R/V Aurora Australis completed two round tripsfrom Hobart to the sea-ice zone. The circle on the coast near 140°E is the French station Dumont d'Urvilte.
2.1. Radiometric measurements
The first radiometer, an Everest 4000 ALCSTM, measured radiation at 8-13 μm, a wavelength range that includes channels 4 and 5 of the U-S. National Oceanic and Atmospheric Administration AVHRR. It has a beamwidth of 4°, and views an area of approximately 2.4 m2 on the surface from a position on the ship's rail approximately 17 m a.s.1. at an angle of 45-55° to the vertical. As described by Rapier (1995), this view angle represented a trade-off between obtaining a vertical view of the water (to minimise the amount of reflected sky radiation in the beam), and the requirement to view undisturbed water (i.e. outside the ship's wake). The instrument was protected from salt, sea spray, rain and snow by a PVC shield. Brightness temperatures were recorded approximately every 30 S.
The second instrument was a dual-channel, narrowband thermal infrared radiometer operating at 10-11 and 11-12 /im, equivalent to ATSR on board ERS-1 (only the 10-11 lira channel was used in this study). Delderfield and others (1986) provide detailed information on the ATSR design. This precision instrument, built by the Commonwealth Scientific and Industrial Research Organisation (CSIRO) Division of Atmospheric Research, was mounted alongside the Everest radiometer on the ship's rail. The beamwidth of this radiometer is 3°, giving a spot size on the surface of approximately 1.4 m2, at an angle of 45-55° to the vertical. The signal is integrated over several seconds. With two internal calibration targets (radiance sources), the sensor measures the surface radiative temperature to an estimated absolute accuracy of 0.2 K (based on comparisons in tropical waters; Barton and others, 1995). One target operates at the ambient temperature, while the second is uniformly heated to about 10 K higher than ambient. Data were recorded approximately once every 4 min. Barton and others (1995) provide a discussion of errors in operating the radiometers in open ocean regions. Following Barton and others (1993), it is assumed that there is no atmospheric absorption between the radiometer and the surface.
Through a formal analysis of the longwave radiation leaving the upper surface of sea ice (with or without a SHOW cover), we can express the radiance received by the radiometer as a sum of an emitted term and a reflected term. Following the notation of Smith and others (1996), we can write:

where  is the radiance received by the radiometer (function of wavelength
 and viewing angle
 is the sky radiance (function of A and of a zenith angle
 ; note that the sky radiance is assumed to be independent of azimuth angle),
 is the surface cmissivity,
 is the spectral radiance from a black body at temperature Ts (Planck equation) and
 is the bidirectional surface reflectance.
Equation (1) has neglected the emission of longwave radiation by the atmosphere along the path between the surface and the radiometer (i.e. it assumes a transmission of unity for the radiation travelling from the surface to the radiometer).
In this treatment, we further simplify this equation by assuming that the bidirectional surface reflectance is van-ishingly small (therefore the integral approximates zero). Furthermore, the emissivity of sea ice with a snow cover is very high. Key and Haefliger (1992) quote values which are all greater than 0.995 for  over a variety of wavelength intervals and incidence angles. The emissivity of open water is also high (approximately 0.97; Michael and Nunez, 1991), and nilas possesses an intermediate emissivity.
Each radiometer outputs a brightness temperature, which is derived by applying a spectral weighting function (dependent on the filter and sensor characteristics) to the received spectral radiance and then solving for an equivalent black-body temperature. in this study, we accepted the brightness temperatures output by each of the radiometers as an estimate of the surface temperature.
Both ship-based radiometers were calibrated before and after the voyage in a cold room using a black-body source with a thermistor. The calibration procedures and the equipment utilised are described by Rapier and Michael (1996).
2.2. Sea-ice observations
Detailed sea-ice and snow-cover information was available from a variety of sources. in particular, hourly sea-ice observations within a 1 km radius of the ship were routinely carried out from the ship's bridge, with ice types being distinguished in thickness categories according to the World Meteorological Organisation ice nomenclature (WMO, 1970). For each ice type, the ice concentration, floe size, topography and snow thickness were estimated, as well as the presence and type of open water. Ice and snow thickness were determined by comparing ice overturned by the ship against a calibration target, in this case a buoy suspended close to the surface. Allison and Worby (1994) estimated that this method has an accuracy of about 20%. These measurements provide the baseline for the determination of broad-scale conditions and changes during the operation of the radiometers. More detailed personal notes were also incorporated.
Additional information on ice conditions in proximity to the radiometers' fields of view came from a video camera mounted alongside the radiometers. The system consisted of a camera mounted on an outdoor housing, and collected one frame every 10 S. Detailed in situ snow and ice sampling was also carried out during ice stations, including occasional measurements of ice and snow surface temperature as close as possible to the radiometers' fields of view. Table I presents some information about the three ice stations relevant to this study, including the in situ temperature data (when available). For both ice stations B and F, only a single surface-temperature measurement was collected. Because they were not collected with in the radiometers' field of view (the ice stations were carried out well forward of the region viewed by the radiometers), the in situ temperatures cannot be directly compared with a contemporaneous radiometric temperature. These two in situ temperatures therefore represent the typical surface conditions on the (thicker) floes in the study locations.
For a discussion of the regional snow and ice conditions observed during the complete experiment, see Worby and Massom (1995).
2.3. Environmental data
Meteorological and other environmental information was obtained from the ship's data logger system (DLS). For the purpose of this study, the original 10 S data were subsampled every 15 min. Data used comprised latitude, longitude, ship's speed, air temperature, wind speed and direction and sea-surface temperature.
3. Data Analysis
Periods of radio interference from the ship were initially excluded from the radiometers'dataseis. Analysis of the time series of surface temperatures from the Everest and ATSR radiometers showed that the stability of the Everest radiometer was suspect, indicating local drifts of the calibration in varied environmental conditions. The Everest radiometer is not expressly designed for use in cold conditions, and ceases to operate at temperatures less than -10.8°C. The error in the temperature measured by the radiometer will be greatest when it is subjected to thermal stress, and this can be caused by a combination of low air temperatures, wind-induced cooling and solar heating (despite the presence of a radiation shield).
The time series of temperatures derived from the ATSR radiometer was deemed to be much more physically reasonable, based on observations of the trends in air temperature and changing surface conditions. The few in situ surface temperatures collected with thermistors during ice stations were in broad agreement with the ATSR temperatures. The disadvantage of the ATSR radiometer was its poor temporal resolution (one temperature per 4 mill, compared with two independent temperatures per minute from the Everest).
Uncalibrated time series of brightness temperatures from the ATSR (plus signs) and Everest (solid line) radiometers for ice station G on 28-29 April 1993 at approximately 65°50' S, 146° 30' E.
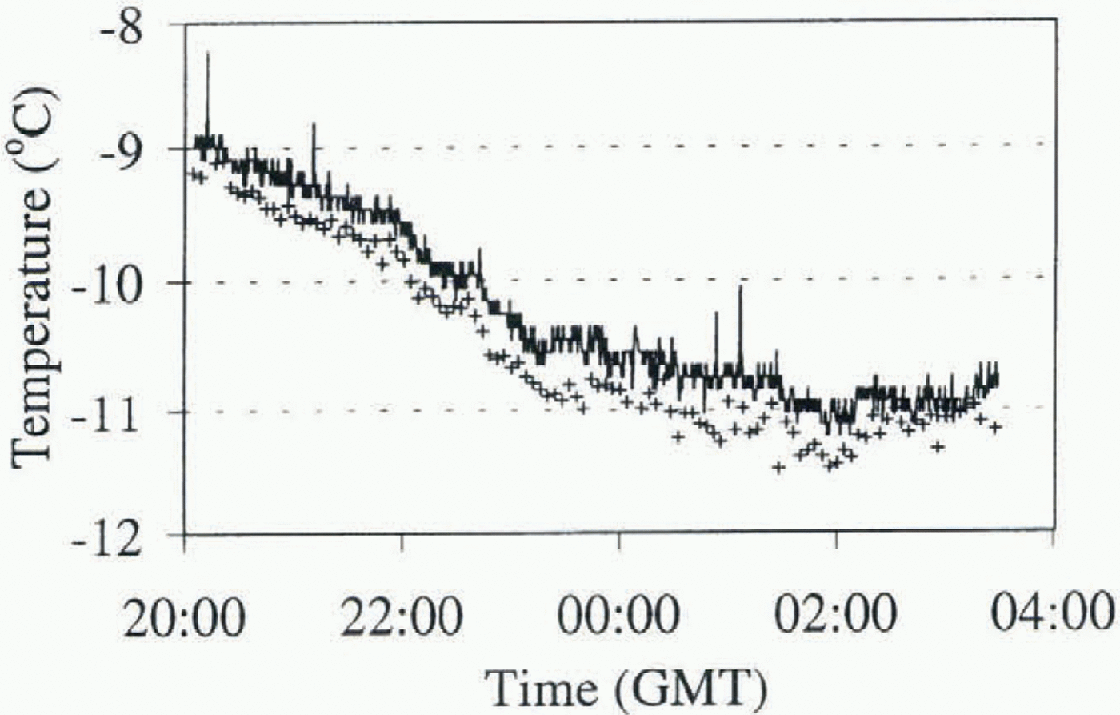
Figure 2 presents an example of a time series of surf ace temperatures from the two radiometers, in this case showing a difference of 0.2-0.5°C between the instruments. in order to correct for this discrepancy and maximise the information from the radiometers, a composite temperature series was created by correcting the trend in the Everest temperatures over periods of a few hours, based on the observed trend in the ATSR temperatures. For a given interval, the technique consisted of determining a linear trend line for each of the two temperature series, and deriving a linear transformation to convert the Everest trend line to the ATSR trend line. This linear transformation was then applied to the whole of the Everest time series, maintaining the higher-frequency information and anchoring the temperatures to a more reliable basis. This procedure was followed for each of the periods which were examined in detail and are presented in the next section. in the following sections we use the symbol Ts to represent the composite surface temperature derived from the two radiometers.
4. Results
Figure 3 presents a high-resolution time series of the radiometric temperature, Ts, and air temperature, TA, for a 43 min period on 29 March while the ship was in motion. Examples of different ice regimes are:
-
(a) undeformed flat ice 0.4 m thick; 0.05 m snow cover (low dunes to 0.3 m); TsšC;
-
(b) undeformed flat ice 0.5 m thick; 0.05 m snow cover; Ts ≈ -12°C (similar to TA ≈ -13.5°C);
-
(c) open water (frazil streamers, some brash); Ts≈ -3.0°C;
-
(d) light nilas 0.05-0.10 m thick; little snow; Ts ≈ -8.5°C;
-
(e) refreezing lead (50% water, 50% nilas); Ts ≈ -5.5°C;
-
(f) narrow leads (<5 m wide, rarely detected by the radiometers as a result of their sampling intervals).
Overall, the slight increase in TA during the period covered is matched by a corresponding trend in the temperature of the thicker ice classes (a and b).
Composite surface (solid line) and air (filled circles) temperatures for a 43 min period on 29 March 1993. Labels a fare explained in the text.

Figure 4 shows measurements from 2000 GMT, 27 April, until 0400 GMT, 28 April, including ice station B which commenced at 0020 GMT. T A dropped from -1.0° to -9.2°C during the 8 hour period, accompanied by a change in wind direction from north to south. The analysis of the video footage shows that prior to the ice station, from 2030 to 2206 GMTon 27 April, the ship was in an area of flooded light nilas (0.05-0.1 m thick, some finger rafting), during which Ts closely matched TA. After 2210 GMT the ship moved into a region of small first-year floes (up to 5 m diameter, separated by brash and small cracks of open water) where it remained for the rest of the period in Figure 4. Ice station B was conducted on ridged first-year ice (averaging 1.15 m thick) with a largely uniform snow cover (≈0.5 m thick) (Worby and Massom, 1995). During the ice station the wind speed averaged 10.9 ms −1 from 185°, and blowing snow was apparent. Figure 4 demonstrates the rapid response of the ice surface temperatures to changes in air temperature (e.g. Guest and Davidson, 1994), especially near 2300 GMT. The rapid variations in Ts observed after 2300 GMT are consistent with the complex ice conditions. An in situ surface temperature of -4.1 °C was measured at 0140 GMT.
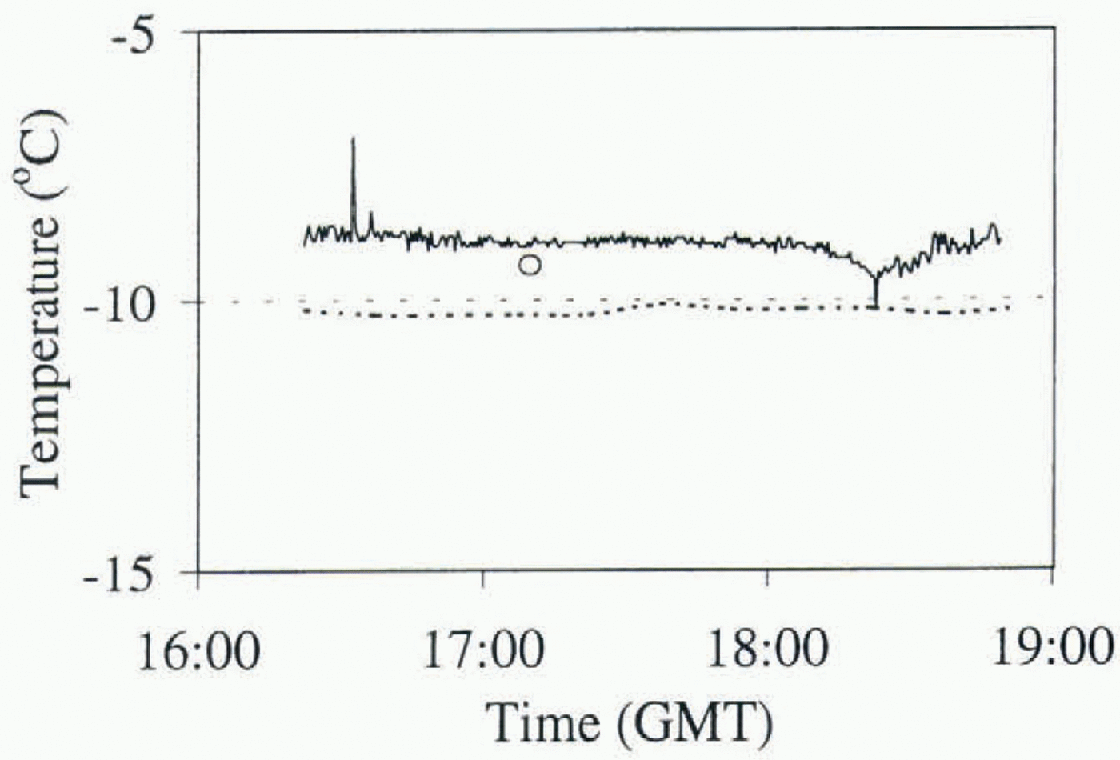
In situ surface temperature (circle), air temperature (dashed line) and Ts (solid line) time seriesfora period on 27-28 April 1993, including ice station B, which started at 0020 GMT at approximately 6S°50'S, 146°30'E.

Figure 5 presents results for 1600 1900 GMT, 28 April, including ice station F (conducted 1700-1820 GMT). Ts was relatively constant (≈-10.5°C) and the wind was light and southerly. The ship was in an area of vast flat floes (thicknesses 0.1-0.6 m, low ridges to 0.3 m elevation), with an even snow cover (0.06 m thick) (Worby and Massom, 1995). An in situ surface temperature of -9.3°C was recorded at 1710 GMT. The Ts values were in good agreement with TA and the in situ surface temperature, apart from a brief reduction in Ts around 1820 GMT.
In situ surface temperature (circle), air temperature (dashed line) and Ts (solid line) time series for a period on 28 April 1993, including ice station F, which started at 1700 GMT at approximately 65°50'S, 146°30'E.
5. Discussion
This study presents an analysis of surface temperature data collected by shipborne radiometers over East Antarctic sea ice. The two radiometers used in the study failed to produce consistent results. While the Everest radiometer possessed a more useful temporal resolution, its stability was suspect. The ATSR radiometer provided less frequent surface temperatures, but its two on-board black bodies ensured a more stable calibration. A composite time series of temperature was created by combining the attributes of both radiometers. These composite temperatures were compared with in situ surface temperatures and air-temperature data. The results were interpreted with the help of records of sea-ice conditions from routine bridge observations and ice stations.
There was broad agreement between the trends in air temperature and the in situ surface temperatures. The observed variability in the surface temperatures could be correlated with recorded changes in ice and snow thickness. Areas of thicker ice with a relatively deep snow cover showed surface temperatures close to the air temperature. The surface temperature of open water approximated -2°C as expected, with refreezing leads and snow-free thinner ice having intermediate surface temperatures. The inter-pretation was complicated by the scale of changes in sca-ice conditions relative to the fields-of-view of the radiometers.
To improve the reliability of the radiometric measurements for use in developing satellite-based surface temperature algorithms, we suggest that frequent radiometer calibrations be conducted, ideally at least once per day. The ATSR radiometer with improved self-calibration has distinct advantages over the less stable Everest, but the latter radiometer is easier to operate and maintain at sea, and is more affordable. Furthermore, on all voyages conducting measurements of this nature, very detailed records of sea-ice characteristics must be collected in order to resolve different ice regimes as the ship moves through the pack ice.
Acknowledgements
The authors are very grateful to I. Barton and R. Cechet of the CSIRO Division of Atmospheric Research for the loan of the ATSR radiometer and other assistance and advice, the Australian Antarctic Science Advisory Council for the funding of this project and ANARE for logistic support during this voyage. A team from the Cooperative Research Centre for Antarctic and Southern Ocean Environment (Antarctic CRC), includingV. Lytle, A. Worby, p. Scott and G. Snow (in addition to two of the authors, K. Michael and R. Massom) compiled the sea-ice observations. We are also indebted to the captain and crew of the RSV Aurora Australis, and voyage leader S. Nicol (Australian Antarctic Division), C. Hungria is supported by the National Council for the Development of Science and Technology (CNPq/Brazil). The authors are grateful to S. Warren and G. Wendler for their constructive review comments.



