

I. INTRODUCTION
Energy conversion research is important in recent years for the potential improvement of efficiency of energy utilization. Thermoelectric (TE) materials are known for their ability for either cooling or waste heat conversion applications. The performance of TE materials is judged by the dimensionless figure-of-merit (ZT) of the material, given by ZT = S 2 σT/κ, where T is the absolute temperature, S is the Seebeck coefficient or TE power, σ is the electrical conductivity, and k is the thermal conductivity (Nolas et al., Reference Nolas, Sharp and Goldsmid2001).
Among a number of potential classes of TE materials that are widely studied (clathrates, half-Heusler, skutterudites, cobaltates, etc.); skutterudite compounds with general structure type of CoSb3 exhibit high potential for TE applications. Extensive efforts have been conducted concerning the property improvement of skutterudite materials either via substitution or via nano-composite formation (Fleurial et al., Reference Fleurial, Caillat and Borshchevsky1997a, Reference Fleurial, Caillat and Borshchevskyb; Liu et al., Reference Liu, Zhang, Zhao and Li2008; Yang et al., Reference Yang, Qiu, Liu, Xi, Zheng, Zhang, Chen, Singh and Yang2011; Su et al., Reference Su, Li, Yan, Wang, Chi, Zhou, Tang, Zhang and Uher2012). For example, one way to lower the thermal conductivity of a binary skutterudite is the formation of a ternary phase by isoelectronic substitution. This substitution can be either performed at the anionic site by a pair of elements from 14th to 16th groups [e.g., CoSn1.5Se1.5 (Laufek et al., Reference Laufek, Navrátil, Plašil, Plechĉcek and Draŝar2009), InGe1.5Se1.5 (Laufek and Navrátil, Reference Laufek and Navrátil2010), and InGe1.5Se1.5 (Vaqueiro et al., Reference Vaqueiro, Sobany, Powell and Knight2006)], or by isoelectronic substitution at the cationic site by a pair of elements from 8th to 10th groups [e.g., Fe0.5Ni0.5Sb3 (Navrátil et al., Reference Navrátil, Laufek, Plcháček and Drašar2012)].
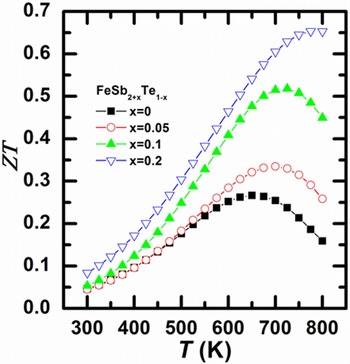
Tan et al. (Reference Tan, Liu, Chi, Su, Wang, Yan, Tang, Wong-Ng and Uher2013) reported high TE figures of merit (ZT) for the FeSb2+ x Te1− x materials (ternary skutterudite series that are derived from CoSb3), with the largest ZT value reaching ~0.65 for the sample with x = 0.2. This is the highest value among all p-type unfilled skutterudites and is comparable with filled n-type compositions such as Te-doped CoSb3 with ZT about 0.7 (Li et al., Reference Li, Chen, Fan, Zhang, Kawahara and Hirai2005). Figure 1 gives the ZT plot vs. x for FeSb2+ x Te1− x (x = 0, 0.05, and 0.1) (Tan et al., Reference Tan, Liu, Chi, Su, Wang, Yan, Tang, Wong-Ng and Uher2013). FeSb2Te shows anomalous electrical and thermal transport properties. Considerable modification in band structure induced by Fe and mixed (Fe2+ and Fe3+) valence states scattering of phonons was described (Tan et al., Reference Tan, Liu, Chi, Su, Wang, Yan, Tang, Wong-Ng and Uher2013). Substitution of Te by Sb results in increasing the hole concentration without significantly affecting the band structure. As a result of the enhanced density of states, substantial improvement of electrical conductivity while maintaining high Seebeck coefficient was achieved. Furthermore, the heat carrying phonons are strongly scattered with the increasing value of x in FeSb2+ x Te1− x because of the formation of solid solutions between two end members: □FeSb2Te and □FeSb3 (where □ can be viewed as a vacancy).
(Color online) Plot of ZT values of FeSb2+ x Te1− x (x = 0, 0.05, 0.1, and 0.2) as a function of temperature (Tan et al., Reference Tan, Liu, Chi, Su, Wang, Yan, Tang, Wong-Ng and Uher2013).

This paper has two main goals. The first is to report the crystallography and crystal chemistry for three members of the FeSb2+ x Te1− x (x = 0.05, 0.10, 0.20) series. Since X-ray diffraction (XRD) patterns are critical for phase characterization, the second goal of this study is to provide the experimental X-ray powder diffraction patterns for these FeSb2+ x Te1− x phases for supplementing the Powder Diffraction File, (2014).
II. EXPERIMENTAL
A. Sample preparation
High-purity Fe (99.5%, shot), Sb (99.9999%, shot), and Te (99.99%, shot) were weighed according to the FeSb2+ x Te1− x (x = 0.05, 0.1, 0.2) stoichiometry and sealed in silica tubes under10−3 Pa pressure. After the charge was melted and homogenized at 1373 K for 12 h, the ampoules were quenched in a supersaturated saltwater bath and subsequently annealed at 853 K for 7 days. The resulting ingots were ground into fine powders and then sintered by spark plasma sintering (SPS) at 803 K for 5 min under the pressure of 40 MPa.
B. Powder XRD and reference pattern preparationFootnote 1
The samples were deposited as acetone slurries on a quartz zero-background cell. X-ray powder patterns were measured on a Bruker D2 Phaser diffractometer (30 kV, 10 mA, 5°–130° 2θ in 0.0202144° steps, 1 s step−1) equipped with a LynxEye position-sensitive detector.
The Rietveld refinement technique (Rietveld, Reference Rietveld1969) with the software suite GSAS (Larson and von Dreele, Reference Larson and von Dreele2004) was used to refine the structures of FeSb2+ x Te1− x . A structure model of CoSb3 reported previously (Oftedal, Reference Oftedal1928) was used for the initial model. The GSAS profile function #4 was used with refinement on the specimen displacement and the size broadening term, LX. The reported peak positions were calculated from the lattice parameters. When peaks are not resolved at the resolution function, the intensities are summed, and an intensity-weighted d-spacing is reported. They are also corrected for systematic errors both in d-spacing and intensity.
III. RESULTS AND DISCUSSION
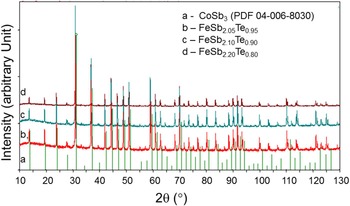
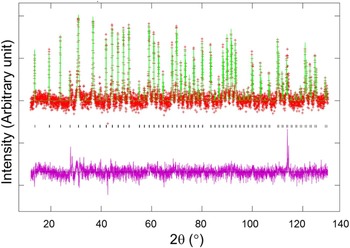
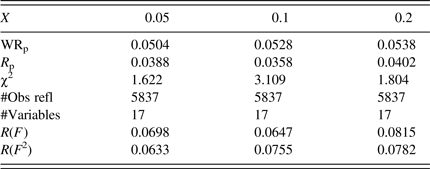
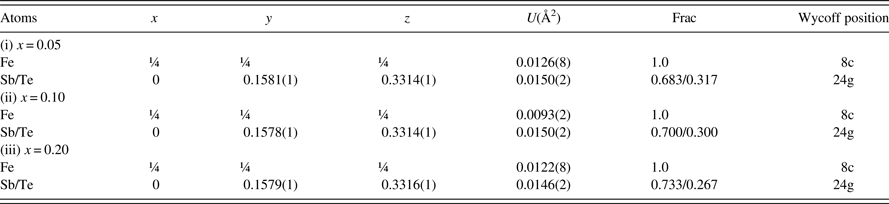
The Rietveld refinement results of the three skutterudite samples, FeSb2+ x Te1− x with x = 0.05, 0.10, and 0.20, are shown in Table I. The powder XRD patterns of these compounds compare well with the stick pattern of CoSb3 from the ICDD database (88–2437) (Figure 2). Figure 3 is a Rietveld plot for FeSb2.2Te0.8 as an example. The observed (crosses), calculated (solid line), and difference XRD patterns (bottom) for FeSb2.2Te0.8 are shown. No impurity phase was found in these three samples.
(Color online) Powder XRD patterns of FeSb2+ x Te1− x with x = 0.05, 0.10, and 0.20, and stick pattern of CoSb3 from the ICDD database (04-006-8030).

(Color online) Observed (crosses), calculated (solid line), and difference XRD pattern (bottom) for FeSb2.2Te0.8 by the Rietveld analysis technique. The difference pattern is plotted at the same scale as the other calculated peak positions. The peak at ≈113.9° 2θ is from an inclusion in the zero-background quartz holder.

Rietveld refinement results for Fe(Sb2+x Te1−x ).
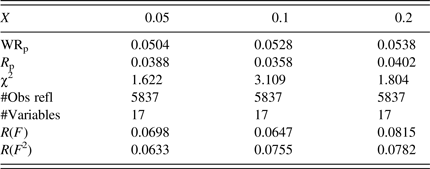
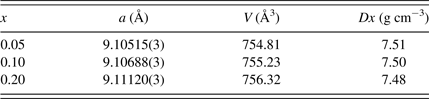
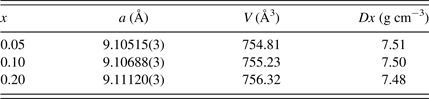
Table II gives the lattice parameters for FeSb2+ x Te1− x . As the covalent radius of Sb (1.40 Å) is greater than that of Te (1.36 Å) (Pyykko and Atsumi, Reference Pyykko and Atsumi2009), the calculated density values, D x , decreases as the value of x increases.
Lattice parameters, unit-cell volumes and calculated densities for Fe(Sb2+x
Te1−x
) (space group
 $Im\bar 3$
).
The skutterudite compounds, FeSb2+
x
Te1−
x
, crystallize in the cubic space group
 $Im\bar 3$
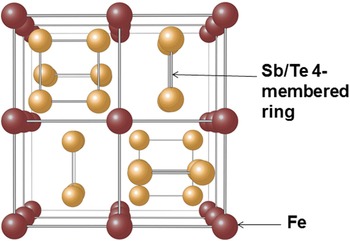
(No. 204) (Oftedal, Reference Oftedal1928). The unit cell of this structure can also be viewed as built from eight smaller cubes with the Fe atoms residing in the cube vertices. Six of these cubes are filled with nearly square planar rings formed by the Sb/Te atoms; these rings are oriented almost parallel to one of the unit-cell edges (Figure 4) (Sales, Reference Sales2003; Prytz, Reference Prytz2007). The structure of FeSb2+
x
Te1−
x
can also be described as a corner-sharing octahedral network, where the icosahedral voids at 2a position of the
 $Im\bar 3$
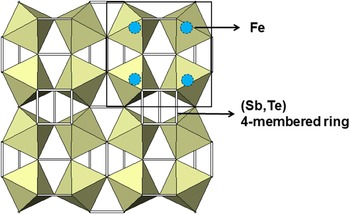
space group are empty. The Fe atoms are located in the centers of the trigonally distorted octahedral voids with Sb/Te residing in the void apexes (Figure 5). The unit-cell of FeSb2+
x
Te1−
x
(ranging from 754.81 to 756.32 Å3) are in general smaller than the volumes of skutterudites, which have the icosahedral voids filled by Ca, Ce or Ca/Ce atoms [CeFe4Sb12 (763.49 Å3), CaFe4Sb12 (769.80 Å3), and (Ca0.5Ce0.5)Fe4Sb12 (765.82 Å3)] (Yan et al., Reference Yan, Wong-Ng, Li, Levin, Kaduk, Suchomel, Sun, Tan and Tang2014).
(Color online) View of the FeSb2+
x
Te1−
x
structure (cubic,
 $Im\bar 3$
) along the a-axis showing Fe atoms and the rectangular Sb/Te rings (Prytz, Reference Prytz2007).

(Color online) Crystal structure of skutterudites FeSb2+
x
Te1−
x
featuring distorted Sb/Te octahedral (Cubic,
 $Im\bar 3$
) and four-membered Sb/Te rings.

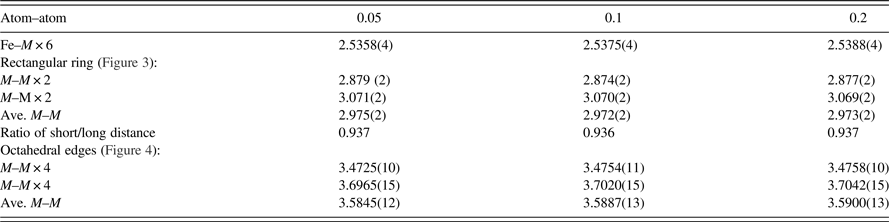
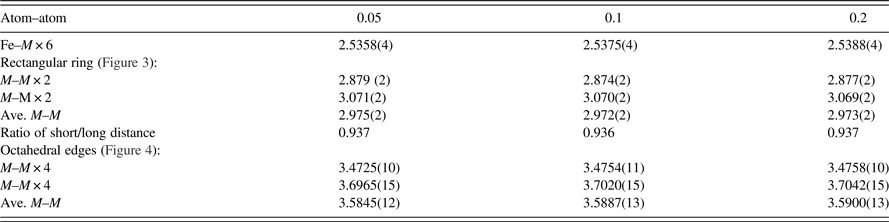
In the refined structural model of FeSb2+ x Te1− x , the only free atomic coordinates are those of the Sb/Te atoms, which occupy the position is 24 g with 0yz coordinates. The planar rings formed by Sb/Te acquire an ideal square shape only if y + z = ½ (Oftedal, Reference Oftedal1928; Kjekshus et al., Reference Kjekshus, Nicholson and Rakke1973,Reference Kjekshus, Nicholson and Rakke1974) is fulfilled. Perfect octahedral coordination for the Fe atoms requires condition y(2z − 1) = z − 3/8, and an ideal icosahedral environment around 2a position requires y 2 = z 2 + yz. Therefore, deviation from the above relations (Table III) yields rectangular rings instead of square shape, a trigonally distorted octahedron, and distorted icosahedral symmetry for the Sb/Te atoms. For example, the ratio between the short and long distance in these rectangular rings are all 0.94 for x = 0.05, 0.1, and 0.2 in the FeSb2+ x Te1− x samples as compare to the ratio of 0.97 in the CoSb3 compound (Kjekshus et al., Reference Kjekshus, Nicholson and Rakke1974).
Refined structural parameters for Fe(Sb2+x
Te1−x
) (space group
 $Im\bar 3$
). The position 2a (0,0,0) is vacant in all samples.

The refined bond distances are reported in Table IV. A trend was observed in the Fe–Sb/Te distances, that is, as x increases in FeSb2+ x Te1− x , the Fe–Sb/Te distance increases [from 2.5358(4) to 2.5388(4) Å]. The average Sb/Te–Sb/Te distances in the four-rectangular rings are similar in these three compounds [≈2.973(2) Å average]. This average distance is slightly longer than that found in RuSb2Te [average of 2.952(3) Å] (Laufek and Navrátil, Reference Laufek and Navrátil2011), and is significantly longer than the ideal Sb–Sb distance of 2.80 Å (Pyykko and Atsumi, Reference Pyykko and Atsumi2009). The average Sb/Te–Sb/Te edge distances in the octahedral framework, on the other hand, increase progressively from 3.5845(12) to 3.5900(13) Å as “x” increases.
Interatomic distances, d (Å), in Fe(Sb2+x Te1−x ), M = Sb/Te
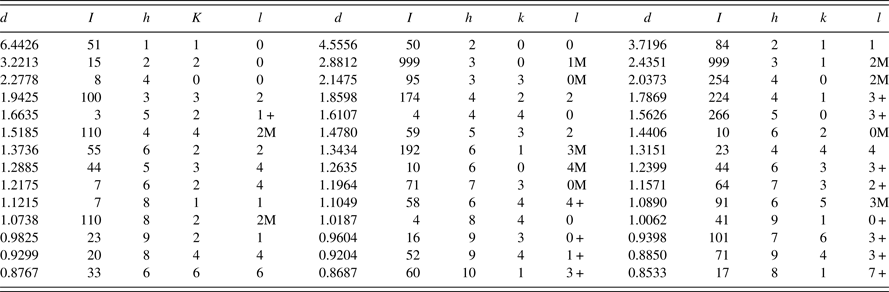
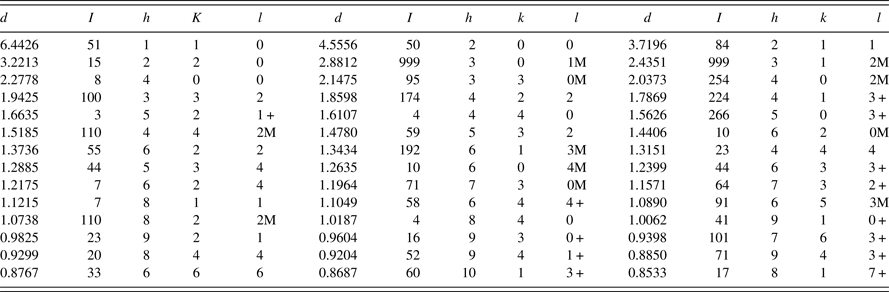
Powder diffraction patterns of three different skutterudites, with x = 0.05, 0.10, and 0.20, have been prepared and submitted to the PDF. An example of the reference pattern of FeSb2+ x Te1− x (x = 0.2) is given in Table V. The intensity values reported are integrated intensities rather than peak heights. All patterns have been submitted for inclusion in the Powder Diffraction File, (2014).
X-ray powder pattern, FeSb2+
x
Te1
−
x
(x = 0.2) (
 $Im\bar 3$
), a = 9.11120(3) Å, V = 756.32(6) Å3, D
x
= 7.48 g cm−3. The “d” values are calculated from the lattice parameters. The symbols “M” and “ + ” refer to peaks containing contributions from two and more than two reflections, respectively. The symbol * indicates the particular peak has the strongest intensity of the entire pattern and is designated a value of “999”.
IV. SUMMARY
X-ray powder diffraction patterns of single-phase FeSb2+
x
Te1−
x
(x = 0.05, 0.1, 0.2), which have excellent TE properties have been prepared and submitted to ICDD for inclusion in the PDF. These skutterudite materials crystallize in the cubic system with space group
 $Im\bar 3$
, and their cell parameters range from 9.10432(4) to 9.11120(3) Å (for x = 0.0 to 0.2, respectively). The unit-cell volume of FeSb2+
x
Te1−
x
(ranging from 754.81 to 756.32 Å3) is in general smaller than those cells that have atoms filled in the distorted icosahedral voids. As the x increases in FeSb2+
x
Te1−
x
, the Fe–Sb/Te distance increases [from 2.5358(4) to 2.5388(4) Å].
ACKNOWLEDGEMENTS
This work was partially supported by the International Centre for Diffraction Data (Grants-in-aid project), National Basic Research Program of China (Grant No. 2013CB632502), the Natural Science Foundation of China (Grant Nos. 51172174 and 51002112), and International Science & Technology Cooperation Program of China (Grant No. 2011DFB60150) along with 111 Project (Grant No. B07040).