



1. Introduction
Solar flares are among the most energetic phenomena in the solar system, releasing vast amounts of magnetic energy through reconnection processes (Carmichael 1964; Hirayama Reference Hirayama1974; Kopp and Pneuman Reference Kopp and Pneuman1976). The energy released heats the chromosphere and drives upward plasma motions, a phenomenon known as chromospheric evaporation (Neupert Reference Neupert1968; Fletcher et al. Reference Fletcher, Dennis, Hudson, Krucker, Phillips, Veronig, Battaglia, Bone, Caspi, Chen, Gallagher, Grigis, Ji, Liu, Milligan and Temmer2011). These processes generate intense brightenings, ribbons, and footpoints that can be observed across multiple wavelengths, from the photosphere to the corona.
Previous studies have shown that strong flares can induce permanent changes in the magnetic field at both photospheric and chromospheric levels (e.g. Sudol and Harvey Reference Sudol and Harvey2005; Kleint Reference Kleint2017; Ferrente et al. Reference Ferrente, Zuccarello, Guglielmino, Criscuoli and Romano2023), emphasizing the need to analyse the coupled thermal and magnetic evolution in the lower atmosphere. Spectropolarimetric inversions, by retrieving the height-dependent stratification of temperature, velocity, and magnetic field, are key for this purpose (Stenflo Reference Stenflo2013).
In October 2014, during Solar Cycle 24, the large and complex active region AR 12192 produced six X-class flares and thirty M-class flares. Among them, the confined X1.6 event on 22 October provides an ideal opportunity to study the impact of flares on the photosphere and chromosphere through high-resolution spectropolarimetric inversions.
2. Observations and Methods
2.1. IBIS observations
The Interferometric Bidimensional Spectropolarimeter (IBIS) at the Dunn Solar Telescope acquired full Stokes profiles of the Fe I 617.3 nm and Ca II 854.2 nm lines during the post-peak phase of the flare, covering a time series of more than one hour. The observations span a field of view of approximately
 $35 \times 80$
arcsec
 $^2$
with a pixel scale of 0.095 arcsec pix
 $^{-1}$
. The observed field of view (FOV) is indicated by the blue box in Figure 1.
Field of view of IBIS over AR 12192. The blue box indicates the analysed region. Reproduced from Ferrente et al. (Reference Ferrente, Quintero Noda, Zuccarello and Guglielmino2024),
 $\unicode{x00A9}$
The Authors, CC BY 4.0.

2.2. Inversion strategy
The full Stokes spectra of both lines were inverted simultaneously using the DeSIRe code (Ruiz Cobo et al. Reference Ruiz Cobo, Quintero Noda, Gafeira, Uitenbroek, Orozco Suárez and Páez Mañá2022), which employs departure coefficients and response functions to constrain physical parameters under non-LTE conditions. Ca <sc>ii</sc> was inverted in non-LTE and Fe <sc>i</sc> in LTE, retrieving temperature (T), LOS velocity (
 $v_{\mathrm{LOS}}$
), magnetic field strength (B), and inclination (
 $\gamma$
) as a function of optical depth. We first optimized the inversion configuration on the first frame (Ferrente et al. Reference Ferrente, Quintero Noda, Zuccarello and Guglielmino2024) and then analysed the temporal evolution (Ferrente et al. Reference Ferrente, Quintero Noda, Zuccarello and Guglielmino2025).
2.3. Atmospheric structure and sensitivity
Figure 2 displays the spatial distribution of the four atmospheric parameters retrieved from the inversions at three optical depths:
 $\log\tau = 0$
,
 $-2$
, and
 $-4$
.
Vertical stratification of temperature, LOS velocity, magnetic field strength, and inclination at different optical depths (
 $\log\tau=0,-2,-4$
). The contour marks the hot flare ribbon region. Reproduced from Ferrente et al. (Reference Ferrente, Quintero Noda, Zuccarello and Guglielmino2024),
 $\unicode{x00A9}$
The Authors, CC BY 4.0.

At
 $\log\tau = 0$
, cool regions such as the sunspot umbra exhibit temperatures of 3000–4000 K, whereas flare-related hot areas reach 7000–9000 K. At
 $\log\tau = -2$
, the temperature distribution is dominated by a hot central region corresponding to the flare ribbon, with values up to 10,000 K. At
 $\log\tau = -4$
, a thin diagonal structure reaches temperatures as high as 15,000 K, highlighted by a black contour.
The LOS velocity map at
 $\log\tau = 0$
exhibits a complex pattern, with upward motions co-spatial with the flare-related temperature enhancements observed at
 $\log\tau = -2$
. At
 $\log\tau = -2$
, the sunspot remains nearly at rest, while the surrounding areas display weak downward motions. At
 $\log\tau = -4$
, strong upward velocities (up to –20 km s
 $^{-1}$
) are detected within the ribbon region, encircling the hot diagonal structure visible in the temperature maps at
 $\log\tau = -4$
. A double-protrusion structure is also evident, correlating with localized regions of lower temperature.
The magnetic field strength peaks at
 $\log\tau = 0$
(up to 1.4 kG) and generally decreases with height, except within the flare ribbon, where it remains between 1.2 and 1.4 kG. The magnetic field inclination shows the double-protrusion feature at all heights, marking a positive-polarity patch within a mainly negative region.
To explore the uncertainties of the inferred atmospheric models, we analysed the sensitivity of the spectral lines to perturbations in the physical parameters through the RFs. The RFs used in this analysis were obtained numerically by applying small perturbations to a given parameter at different atmospheric layers and synthesising the corresponding spectral profiles. The resulting changes depend on several elements of the configuration, including the selected spectral lines, spectral resolution and sampling, and the underlying atmospheric model.
To assess the sensitivity and, thus, the reliability of the inferred parameters, we computed RFs for multiple pixels belonging to different physical scenarios, from the flare ribbon to quieter regions.
The full RF dataset has four dimensions: spatial position (Y, 830 pixels), optical depth (81 points in
 $\log\tau$
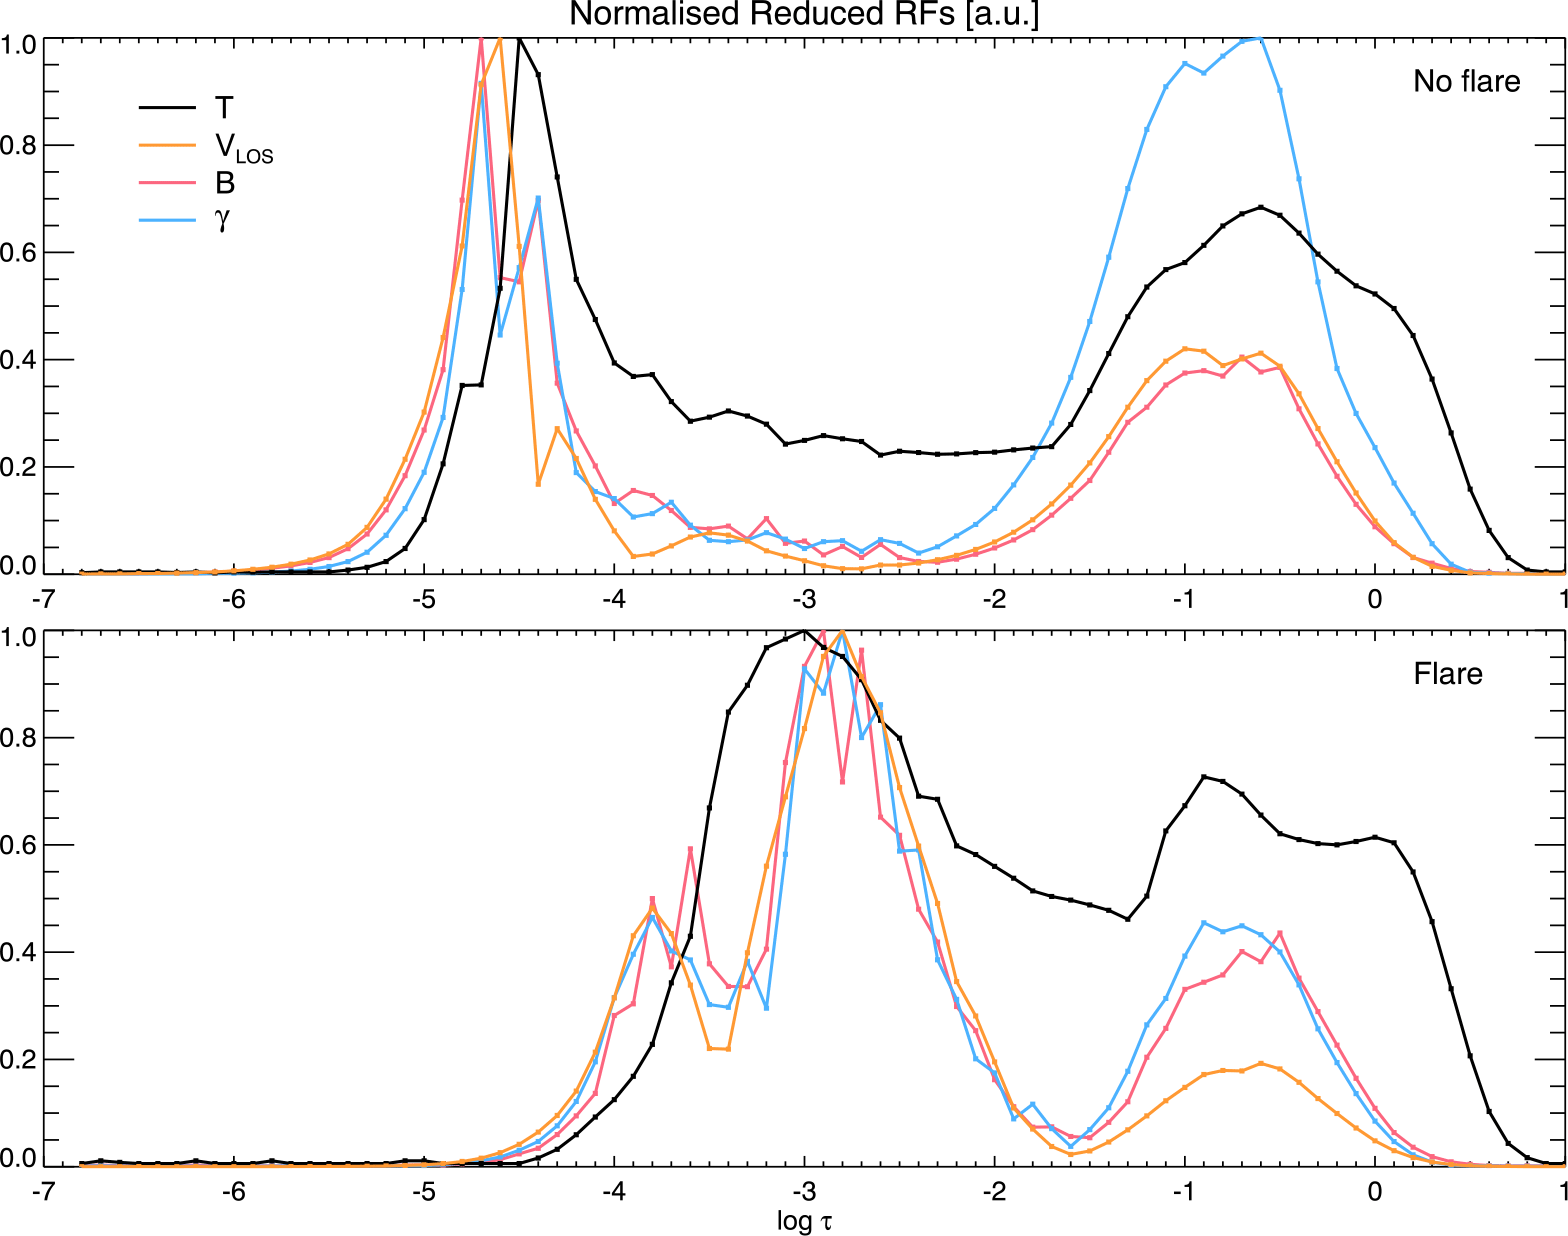
), wavelength (36 samples across the two spectral lines), and the four Stokes parameters. Direct visualisation of such a dataset is difficult, so we followed the approach of Quintero Noda et al. (Reference Quintero Noda, Shimizu, Katsukawa, de la Cruz Rodríguez, Carlsson, Anan, Oba, Ichimoto and Suematsu2017) by computing an equivalent 1D RF or sensitivity function. Specifically, for each optical depth, we extracted the maximum RF value across all wavelengths and Stokes parameters, collapsing the
 $(\log\tau, \lambda, 4)$
domain into a 1D function of optical depth (Figure 3).
Example of response functions for temperature, LOS velocity, field strength, and inclination inside (bottom) and outside (top) the flare ribbon. Reproduced from Ferrente et al. (Reference Ferrente, Quintero Noda, Zuccarello and Guglielmino2024),
 $\unicode{x00A9}$
The Authors, CC BY 4.0.

Figure 3 Long description
Two line graphs compare response functions for temperature, line-of-sight velocity, magnetic field strength, and inclination during a flare and no flare. Panel A: The top graph shows response functions outside the flare ribbon. The x-axis is labeled 'log τ' ranging from -7 to 1, and the y-axis is labeled 'Normalised Reduced RFs [a.u.]' ranging from 0 to 1. The black line represents temperature, the orange line represents line-of-sight velocity, the red line represents magnetic field strength, and the blue line represents inclination. Panel B: The bottom graph shows response functions inside the flare ribbon. The x-axis and y-axis labels are the same as in Panel A. The black line represents temperature, the orange line represents line-of-sight velocity, the red line represents magnetic field strength, and the blue line represents inclination.
For the Ca <sc>ii</sc> line, the maximum sensitivity within the flare ribbon occurs at deeper layers than in a standard quiet-Sun atmosphere. This indicates that strong temperature enhancements, large velocities, and concentrated magnetic fields alter the line’s formation height. In contrast, no such shift is observed for the Fe <sc>i</sc> line, consistent with the Ca <sc>ii</sc> profiles exhibiting strong emission while the photospheric line retains its typical appearance.
To determine the height of maximum sensitivity in the upper atmosphere, we identified the chromospheric peak of each atmospheric parameter. Figure 4 presents the vertical stratification along the selected cut, as well as the height of the maximum sensitivity for the region outlined with a dashed line in Figure 2. Outside the flare ribbon (Y = [0, 20] arcsec), the sensitivity peak is located around
 $\log\tau \sim -5$
; whereas, within the ribbon, it shifts to deeper layers, coinciding with regions of enhanced temperature and strong LOS velocities. This suggests a reduced sensitivity to parameter variations in the upper layers of the flare ribbon; for example, LOS velocity fluctuations around
 $\log\tau \sim -5.5$
at Y = [20, 40] arcsec and Y = [55, 65] arcsec should be interpreted with caution.
Height stratification of the atmospheric parameters for the region outlined by the dashed line in Figure 2. From top to bottom, the panels display the temperature, LOS velocity, magnetic field strength, and magnetic field inclination. In each panel, the solid line marks the height where the sensitivity to variations in the atmospheric parameters is highest for the Ca II line. Reproduced from Ferrente et al. (Reference Ferrente, Quintero Noda, Zuccarello and Guglielmino2024),
 $\unicode{x00A9}$
The Authors, CC BY 4.0.

2.4. Temporal evolution
We analysed the temporal evolution of the atmospheric parameters by inverting all snapshots with DeSIRe, aiming for a cadence of 10 minutes. Missing snapshots were replaced by the closest in time, and the FOV was reduced from 75
 $\times$
35 arcsec
 $^2$
to 50
 $\times$
35 arcsec
 $^2$
to reduce computation time. The two lines were inverted simultaneously using the same configuration as in the first frame.
Based on previous response function analysis, we focused on
 $\log\tau = -4$
outside the ribbon and
 $\log\tau = -3$
within it, as the height of maximum sensitivity in flaring regions shifts to deeper layers (Figure 5). Computing the exact maximum RF for each pixel at every snapshot is left for future work.
Temporal evolution of T,
 $v_{\mathrm{LOS}}$
, B, and
 $\gamma$
at
 $\log\tau=-3$
within the flare ribbon ad at
 $\log\tau=-4$
outside the flare ribbon.

Figure 5 Long description
Panel A: Four heat maps show temperature evolution over time, with color gradients from dark red to bright yellow indicating temperature changes. The x-axis ranges from 0 to 30 arcseconds, and the y-axis ranges from 20 to 60 arcseconds. Green contours highlight specific regions. Panel B: Four heat maps display line-of-sight velocity changes, with color gradients from blue to red indicating velocity variations. The axes are the same as in Panel A, and black contours mark specific regions. Panel C: Four grayscale images illustrate magnetic field strength, with darker areas indicating higher field strength. Orange contours highlight specific regions. Panel D: Four heat maps show inclination changes, with color gradients from blue to red indicating inclination variations. The axes are the same as in previous panels, and black contours mark specific regions.
Within the flare ribbon, the temperature reaches 8000–9000 K after the flare peak and gradually decreases. LOS velocity maps show persistent chromospheric upflows (
 $v_{\mathrm{LOS}}<0$
) confined to the ribbons, with a shrinking spatial extent. The magnetic field strength reaches up to 1.4 kG in hot areas, becoming more fragmented during the decay, while magnetic inclination remains mostly vertical with no abrupt changes throughout the post-flare evolution.
3. Conclusions
Our analysis reveals that during this event, temperature enhancements are most pronounced in the middle and upper atmospheric layers, where the regions of enhanced temperature progressively contract and nearly vanish within one hour. Chromospheric upflows are clearly visible in the LOS velocity maps and remain confined to the flare ribbon throughout the observing sequence. Strong magnetic fields, reaching approximately 1–1.5 kG in the upper layers, are concentrated within the hot regions but gradually fragment over time, following the ribbon’s evolution.
The response function analysis confirms that the flare primarily influences the chromospheric layers, producing a marked depression in the height of line formation within the ribbon, while no significant shifts are detected in the photosphere. Overall, the atmospheric parameters evolve smoothly during the gradual phase, with no evidence of flare reactivation or major magnetic restructuring.
Acknowledgements
The research leading to these results has received funding from the European Union’s Horizon 2020 research and innovation program under grant agreement No.739500 (PRE-EST project) and No. 824135 (SOLARNET project). F. Ferrente and S.L. Guglielmino acknowledge support from ASI/INAF agreement n. 2022-29-HH.0 Missione MUSE. F. Ferrente and F. Zuccarello acknowledge support by the Università degli Studi di Catania (PIA.CE.RI. 2020–2022 Linea 2) and by the Italian MIUR-PRIN grant 2017APKP7T on “Circumterrestrial Environment: Impact of Sun-Earth Interaction.” This research was carried out in the framework of the CAESAR (Comprehensive spAce wEather Studies for the ASPIS prototype Realization) project, supported by the Italian Space Agency and the National Institute of Astrophysics through the ASI-INAF agreement no. 2020-35-HH.0 for the development of the ASPIS (ASI Space weather InfraStructure) prototype of scientific data center for Space Weather. C. Quintero Noda acknowledges support from the Agencia Estatal de Investigación del Ministerio de Ciencia, Innovación y Universidades (MCIU/AEI) under grant “Polarimetric Inference of Magnetic Fields” and the European Regional Development Fund (ERDF) with reference PID2022-136563NB-I00/10.13039/501100011033. The publication is part of the Project ICTS2022-007828, funded by MICIN and the European Union NextGenerationEU and the RTRP. We also thank Dr. Serena Criscuoli for providing the IBIS calibrated data. SLG acknowledges support from Italian Space Agency and the Ministry of University and Research under Contract n. 2024-5-E.0 (Space It Up) and support from INAF through Bando per il finanziamento della Ricerca Fondamentale 2023–IDEA-SW project.
The National Solar Observatory is operated by the Association of Universities for Research in Astronomy, Inc.(AURA) under cooperative agreement with the National Science Foundation. The SDO/HMI data used in this paper are courtesy of NASA/SDO and the HMI science team. Use of NASA’s Astrophysical Data System is gratefully acknowledged.
Facilities: DST (IBIS), SDO (HMI)

 ©

 logτ=0,−2,−4
 ©
 ©

 ©

 vLOS
 γ
 logτ=−3
 logτ=−4


