Introduction
Lexical stress (henceforth “stress”) refers to the emphasis placed on a syllable within a multi-syllabic word, which makes the stressed syllable more acoustically prominent. Assigning stress to words is a crucial aspect of reading aloud because words cannot be articulated until stress is assigned. In some languages, the process of assigning stress is straightforward because the position of stress in the word is fixed (e.g., multi-syllabic words in French are typically stressed on the last syllable) or can be easily derived from orthography (e.g., diacritic marks in Greek indicate the stressed syllable). The same is not true for free-stress languages such as English and Italian, in which patterns of stress assignment often do not follow explicit rules. Researchers in the area of reading aloud have developed an increasing interest in the processes governing stress assignment in the latter class of languages (e.g., Arciuli & Cupples, Reference Arciuli and Cupples2006; Arciuli, Monaghan & Ševa, Reference Arciuli, Monaghan and Seva2010; Jouravlev & Lupker, Reference Jouravlev and Lupker2014; Mousikou, Sadat, Lucas & Rastle, Reference Mousikou, Sadat, Lucas and Rastle2017). In particular, Italian has been the focus of a number of investigations (Sulpizio, Burani & Colombo, Reference Sulpizio, Burani and Colombo2015a). Here we investigate stress assignment in learners of Italian as a second language (L2). Before presenting our study, we first review the literature on the sources of information available to readers of Italian to assign stress, then discuss the developmental literature on this topic, and finally describe two existing studies of stress assignment in L2 learners of Italian.
Sources of information for stress assignment in Italian
In Italian, stress position in multi-syllabic words is typically unmarked in the orthography (final-stress words do bear a diacritic mark, e.g., città ‘town’, but these comprise fewer than 5% of words: Spinelli, Sulpizio & Burani, Reference Spinelli, Sulpizio and Burani2017). Italian readers must, therefore, use other sources of information to assign stress. First and foremost, they can retrieve the stress pattern stored within the word's entry in the mental lexicon (Colombo, Reference Colombo1992). However, the fact that readers are able to assign stress to novel words, for which no entry in the mental lexicon exists, suggests that lexical retrieval is not the only information readers use to assign stress. An especially reliable piece of information is the phonological rule that syllables ending with a consonant receive stress when appearing in the penultimate position (mo-MEN-to, ‘moment’; the stressed syllable is in uppercase).
However, recent research addressing stress assignment has focused on the role of distributional information that readers learn implicitly through experience with the language (e.g., Arciuli & Cupples, Reference Arciuli and Cupples2006; Arciuli et al., Reference Arciuli, Monaghan and Seva2010; Brown, Lupker & Colombo, Reference Brown, Lupker and Colombo1994; Burani & Arduino, Reference Burani and Arduino2004; Colombo, Reference Colombo1992; Jouravlev & Lupker, Reference Jouravlev and Lupker2014; Kelly, Morris & Verrekia, 1998; Sulpizio, Arduino, Paizi & Burani, Reference Sulpizio, Arduino, Paizi and Burani2013). The idea motivating this research is that readers acquire knowledge about distributional properties of stress patterns in the language and then utilize that knowledge to estimate the most likely stress pattern for any word to be read. In particular, research in stress assignment in Italian has identified two sources of distributional information readers may utilize in the process of assigning stress to both familiar and unfamiliar words – stress dominance and stress neighborhood characteristics. These sources of information would be mainly used when dealing with words for which no information about stress position can be derived from either orthography or phonology – typically, words with three or more syllables with no final stress and a penultimate syllable ending in a vowel. Words with these characteristics represent a large portion of the Italian lexicon and are the focus of virtually all research investigating stress dominance and stress neighborhood in Italian.
Stress dominance refers to the most frequent stress pattern in a language (Brown et al., Reference Brown, Lupker and Colombo1994; Colombo, Reference Colombo1992; Rastle and Coltheart, Reference Rastle and Coltheart2000). In Italian, most multi-syllabic words – 77% – are stressed on the penultimate, or second-to-last, syllable (pePIte, ‘nuggets’), whereas 18% of words are stressed on the antepenultimate, or third-to-last, syllable (BAMbola, ‘doll’; Spinelli et al., Reference Spinelli, Sulpizio and Burani2017; Thornton, Iacobini & Burani, Reference Thornton, Iacobini and Burani1997). Notably, the prevalence of the penultimate stress pattern is not restricted to the cases falling under the rule mentioned above. Overall, this situation makes penultimate stress the dominant pattern in Italian, a pattern that Italian readers may be inclined to assign by default (Colombo, Reference Colombo1992; Colombo, Deguchi & Boureux, Reference Colombo, Deguchi and Boureux2014).
Stress neighborhood refers to statistical co-variations between orthographic final sequences and stress patterns (e.g., Burani & Arduino, Reference Burani and Arduino2004; although statistical co-variations also exist between stress patterns and letter sequences elsewhere in words: Monaghan, Arciuli & Seva, Reference Monaghan, Arciuli, Seva, Thomson and Jarmulowicz2016). When most words with a particular final sequence have the same stress pattern, strong associations can be formed between that sequence and the stress pattern (e.g., Arciuli & Cupples, Reference Arciuli and Cupples2006; Arciuli et al., Reference Arciuli, Monaghan and Seva2010; Burani & Arduino, Reference Burani and Arduino2004; Jouravlev & Lupker, Reference Jouravlev and Lupker2014; Sulpizio et al., Reference Sulpizio, Arduino, Paizi and Burani2013). The typical stress pattern for words with a specific orthographic final sequence is referred to as its stress neighborhood.
In Italian, the final sequence of a word is defined as the sequence of graphemes going from the nucleus of the penultimate syllable to the end of the word (e.g., bamb-ola, pep-ite; Burani & Arduino, Reference Burani and Arduino2004). These sequences can have a penultimate or an antepenultimate stress neighborhood when they are strongly associated with a penultimate or an antepenultimate stress pattern, respectively, or they can have an ambivalent stress neighborhood when they are associated with no stress pattern in particular. For example, the final sequence -ite is strongly associated with penultimate stress, as most of the words that end in that sequence are stressed on the penultimate syllable (pePIte; saLIte, ‘hills’). Similarly, -ola is strongly associated with antepenultimate stress as most of the words that end in that sequence are stressed on the antepenultimate syllable (BAMbola; FAvola, ‘fable’). Ambivalent stress neighborhoods, on the other hand, include sequences that are rare in the language in general (e.g., -ovo), or sequences, like -oga, for which penultimate stress words (afFOga, ‘he/she drowns’) are approximately as frequent as antepenultimate stress words (DEroga, ‘waiver’). A number of investigations showed that native (L1) Italian adult readers are sensitive to these orthographic cues to stress assignment, with a bias for producing stress patterns which are consistent with the word's stress neighborhood when this is not ambivalent (e.g., Burani & Arduino, Reference Burani and Arduino2004; Colombo et al., Reference Colombo, Deguchi and Boureux2014, Experiment 1; Sulpizio et al., Reference Sulpizio, Arduino, Paizi and Burani2013).
Development of stress assignment in Italian as L1
As is apparent from their definitions, stress dominance and stress neighborhood vary considerably in their scope, with stress dominance providing a general bias towards the dominant pattern in the language and stress neighborhood indicating the most likely pattern for words ending in specific sequences. An important implication of this difference is that stress dominance information can be used by any reader who has some knowledge of the language. That is, even readers with a limited vocabulary have sufficient information pointing to the fact that penultimate stress is the dominant pattern in Italian. In contrast, stress neighborhood information may only be available for readers who have learned enough words to form reliable associations between orthographic final sequences and stress patterns. As a result, individuals who are in the process of learning to read in Italian may rely on stress dominance to pronounce written words, while stress neighborhood might influence stress assignment only after readers have acquired a larger reading vocabulary.
Recent findings from developing L1 readers of Italian lend support to this idea (Burani, Paizi & Sulpizio, Reference Burani, Paizi and Sulpizio2014; Colombo et al., Reference Colombo, Deguchi and Boureux2014; Sulpizio, Boureux, Burani, Deguchi & Colombo, Reference Sulpizio, Boureux, Burani, Deguchi and Colombo2012; Sulpizio & Colombo, Reference Sulpizio and Colombo2013). For example, Colombo et al. (Reference Colombo, Deguchi and Boureux2014) tested Italian second graders, fourth graders, and adults, in a nonword reading task. Unlike words, nonwords do not have a conventional stress pattern, but they necessarily receive one when they are pronounced. To examine what sources of information developing readers of Italian utilize when assigning stress to stimuli whose stress pattern is unknown, Colombo et al. constructed nonwords which had final sequences characterized by either a penultimate stress neighborhood, an antepenultimate stress neighborhood, or an ambivalent stress neighborhood. They found that stress assignment was influenced by the nonwords’ stress neighborhood. Specifically, penultimate stress responses were the most frequent for nonwords with a penultimate stress neighborhood, less frequent (but still more frequent than antepenultimate stress responses) for nonwords with an ambivalent stress neighborhood, and the least frequent for nonwords with an antepenultimate stress neighborhood, stimuli for which antepenultimate responses were often the most frequent. However, this pattern was modulated by age, with children showing a smaller impact of stress neighborhood and a more general preference for penultimate stress. This preference gradually decreased from second to fourth graders and became minimal in adults, a group in which the bias for penultimate stress was apparent only for nonwords with an ambivalent stress neighborhood.
These and similar findings in English (Arciuli et al., Reference Arciuli, Monaghan and Seva2010) have led researchers to propose the existence of a developmental trajectory for stress assignment (Sulpizio et al., Reference Sulpizio, Burani and Colombo2015a). This trajectory starts with a preference for assigning the dominant stress. From an early age, however, this preference is accompanied by an increasing tendency to utilize stress neighborhood, a more specific source of information, as reading skills improve. Subsequently, in adulthood, stress neighborhood will remain the preferred source of information for stress assignment when sufficiently strong orthographic cues are available. As noted, lexical development is likely to play a major role in shaping this trajectory: because younger readers possess a limited orthographic lexicon, they have little information with which to compute stress neighborhood. As a result, they may be more inclined to use the more general distributional knowledge about the dominant stress pattern in the language, which is available earlier in development. However, as the lexicon increases and reading skills improve, readers become increasingly more able to capture statistical co-variations between final sequences and stress patterns. This ability will lead them to abandon the initial bias for dominant stress and rely on stress neighborhood instead, with the bias for dominant stress re-emerging only when stress neighborhood is ambivalent.
Development of stress assignment in Italian as L2
The idea that relative reliance on stress dominance and stress neighborhood is mainly modulated by the size of the reader's vocabulary implies that the trajectory described for L1 readers of Italian should have a parallel in readers of Italian as L2. Similar to children acquiring an L1, adult individuals who are learning an L2 gradually increase the magnitude of their vocabulary in that language. Thus, it is reasonable to assume that those individuals will also find it most useful to use the L2's dominant stress pattern early in lexical development, gradually shifting to stress neighborhood as their vocabulary improves.
Primativo et al. (Primativo, Rinaldi, O'Brien, Paizi, Arduino & Burani, Reference Primativo, Rinaldi, O'Brien, Paizi, Arduino and Burani2013) examined this question by testing English speakers who had learned Italian in adulthood. In their Experiment 2, they asked English–Italian bilinguals to read aloud high- and low-frequency words in Italian which had either a penultimate or antepenultimate stress pattern. They found that stress accuracy did not differ for the two types of high-frequency words, but low-frequency words with antepenultimate stress elicited more stress errors than did those with penultimate stress. More crucially, this tendency was stronger for participants with small vocabularies than for those with large vocabularies, with the former making the most stress errors to antepenultimate stress, low-frequency words.
Using the same word-reading task, Bellocchi, Bonifacci and Burani (Reference Bellocchi, Bonifacci and Burani2014) obtained similar results on a sample of fourth and fifth graders schooled in Italy but coming from other language backgrounds. Specifically, they found that late bilinguals were especially prone to make stress errors on antepenultimate stress, low-frequency words. Early bilinguals and a control group of Italian monolingual children showed a similar tendency, but not as strong.
Both Primativo et al. (Reference Primativo, Rinaldi, O'Brien, Paizi, Arduino and Burani2013) and Bellocchi et al. (Reference Bellocchi, Bonifacci and Burani2014) offered an explanation for their results that assigns a critical role to vocabulary size. Specifically, at early stages of lexical development of L2 Italian, bilinguals tend to overgeneralize the dominant pattern in the language, a stress-dominance bias that is most evident for less familiar words. However, with prolonged exposure to Italian and a parallel increase in vocabulary size, bilinguals learn to de-emphasize this bias, possibly because they acquire knowledge about more informative cues to assign stress, cues like stress neighborhood.
The present research
In summary, research on individuals learning Italian as both L1 and L2 produced evidence for a trajectory moving from an initial bias for the dominant stress pattern in the language to an increasing reliance on stress neighborhood. This trajectory was assumed to be determined by a gradual increase in readers’ lexical knowledge. With the present research, we aimed to examine this conclusion in more detail. Furthermore, we examined the influence of the reader's L1 on stress assignment in L2 Italian.
One limitation of Primativo et al. (Reference Primativo, Rinaldi, O'Brien, Paizi, Arduino and Burani2013) and Bellocchi et al. (Reference Bellocchi, Bonifacci and Burani2014) is that they suggest that bilinguals gradually abandon stress dominance as a strategy to assign stress, but their data provide no indication of what strategy replaces stress dominance. While it is reasonable, as they proposed, that this strategy would be stress neighborhood, stress neighborhood was not a manipulated factor in their experiments. In fact, inspection of their stimuli reveals that stress neighborhood might not have been well controlled. Controlling word stimuli on stress neighborhood implies that the penultimate stress neighborhoods being used should have a proportion and a number of words with penultimate stress approximately equivalent to the proportion and number of words with antepenultimate stress for the antepenultimate stress neighborhoods being used. However, some of the penultimate stress words used by Primativo et al. (Reference Primativo, Rinaldi, O'Brien, Paizi, Arduino and Burani2013) and Bellocchi et al. (Reference Bellocchi, Bonifacci and Burani2014) have an ending that almost always receives penultimate stress. In comparison, the bias for antepenultimate stress in the antepenultimate stress words was much less strong. Indeed, in this condition a few words appeared which had a penultimate stress neighborhood. In light of these considerations, the reported finding that low-frequency antepenultimate stress words elicited more stress errors than low-frequency penultimate stress words is not as clearly interpretable as it first appears.
We propose that these problems can be addressed more efficiently by using nonwords instead of words. Nonword reading has now been used a number of times in stress assignment research (e.g., Arciuli et al., Reference Arciuli, Monaghan and Seva2010; Colombo et al., Reference Colombo, Deguchi and Boureux2014; Ktori, Mousikou & Rastle, Reference Ktori, Mousikou and Rastle2018; Mousikou et al., Reference Mousikou, Sadat, Lucas and Rastle2017; Spinelli, Sulpizio, Primativo & Burani, Reference Spinelli, Sulpizio, Primativo and Burani2016; Sulpizio et al., Reference Sulpizio, Arduino, Paizi and Burani2013; Sulpizio, Spinelli & Burani, Reference Sulpizio, Spinelli and Burani2015b). As mentioned, nonwords do not have a stress pattern of their own but inevitably receive one once they are pronounced. In the present circumstances, this characteristic of nonwords is especially useful. Primativo et al.'s (Reference Primativo, Rinaldi, O'Brien, Paizi, Arduino and Burani2013) and Bellocchi et al.'s (Reference Bellocchi, Bonifacci and Burani2014) results mainly come from stress errors on words, and these sorts of errors can quickly descend to floor as vocabulary size increases, making it difficult to draw conclusions for more advanced bilinguals. This problem is absent with nonwords, stimuli which, by definition, cannot elicit stress errors. On the other hand, nonwords can be constructed in such a way that one can pinpoint the strategies being used to assign stress to them. For example, use of stress neighborhood should lead participants to assign stress patterns that are consistent with the nonword's stress neighborhood. This tendency should be equivalent for penultimate and antepenultimate stress neighborhoods if the two types of neighborhoods are matched on the proportion and number of words biasing the neighborhood, and readers are not using an additional strategy such as applying the dominant stress in the language. Concurrent use of this latter strategy, on the other hand, should make the language-dominant (penultimate) stress pattern more likely overall. In sum, when constructed carefully, nonwords can provide clear indications as to what strategies readers use in assigning stress.
We also extended previous research by exploring the role of bilinguals’ L1 in shaping their stress assignment behavior in L2. As mentioned, Primativo et al.'s (Reference Primativo, Rinaldi, O'Brien, Paizi, Arduino and Burani2013) participants were English–Italian bilinguals, whereas Bellocchi et al.'s (Reference Bellocchi, Bonifacci and Burani2014) participants came from different language backgrounds. As such, it is difficult to tell what impact, if any, participants’ L1 had on the processes governing stress assignment in L2 Italian.
One possibility is that L2 readers of Italian are initially tempted to transfer the stress pattern typically used in their L1 to Italian. For example, most English words are stressed on the first syllable, and this characteristic is thought to cause a bias towards first-syllable stress (Arciuli et al., Reference Arciuli, Monaghan and Seva2010; Brown et al., Reference Brown, Lupker and Colombo1994; Rastle & Coltheart, Reference Rastle and Coltheart2000). Note that the first syllable is also the antepenultimate and the pre-antepenultimate syllable, respectively, in three-syllable and four-syllable stimuli. Thus, if English–Italian bilinguals transfer their bias for first-syllable stress from English to Italian, they should show a greater tendency to assign antepenultimate stress to three-syllable stimuli than to four-syllable stimuli. In contrast, for four-syllable stimuli, a tendency to assign stress to the pre-antepenultimate syllable should be observed.Footnote 1
Note that the L1 transfer pattern just described should be specific to bilinguals whose L1 favors first-syllable stress. To determine if this is the case, the present study tested English L1 speakers learning Italian as well as Mandarin Chinese (henceforth referred to as “Chinese”) L1 speakers learning Italian. Chinese differs widely from either English or Italian, not only because of the difference in script, but also because lexical stress appears to be a less salient phonological feature overall (a characteristic that might have to do with the important role tones have in Chinese; see Duanmu, Reference Duanmu2007). Chinese speakers can vary in the stress patterns they assign to disyllabic words, and often disagree when requested to perform judgments on stress (Chao, 1968; Selkirk & Shen, Reference Selkirk, Shen, Inkelas and Zec1990). While this situation has led some linguists to classify Chinese as a language without stress (e.g., Hyman, Reference Hyman and Hyman1977), others have argued for the existence of distinct stress patterns, albeit somewhat subtle to identify for the average speaker (Duanmu, Reference Duanmu2007). For disyllabic words, Xu (Reference Xu1982; as cited by Duanmu, Reference Duanmu2007) reports a rough count suggesting a preponderance of cases in which the final syllable receives more stress than the first syllable.
What is important to note is that as far as stress is concerned, Chinese is quite different from English in the transfer effects it can engender for the L2. In Chinese, stress is not as relevant as it is in Italian or in English, but, if anything, there might be a bias for final-syllable stress rather than first-syllable stress. Thus, if bilinguals utilize knowledge from the distribution of stress patterns in their L1 in the process of learning to assign stress in the L2, this transfer effect should be revealed by comparing bilinguals coming from English and Chinese backgrounds. Specifically, only English speakers should produce some evidence of first-syllable stress preference. Three-syllable nonwords from penultimate stress neighborhoods are especially informative regarding the transfer of first-syllable stress from English because both stress dominance and stress neighborhood information suggest that stress should be placed on the penultimate syllable. Stress placement on the antepenultimate syllable of these nonwords would suggest that both of these sources of information are ignored, presumably because English speakers are transferring stress knowledge from their L1. An alternative explanation cannot be ruled out, however, that antepenultimate stress assignment in these cases simply reflects a learner's understanding that some Italian words have antepenultimate stress, and thus, antepenultimate stress should be assigned at least a few times in the experiment. In that case, however, one would expect Chinese speakers to show a similar behavior, with an equivalent number of antepenultimate responses to nonwords with a penultimate stress neighborhood. The finding that antepenultimate stress responses to these nonwords are more common in English speakers than in Chinese speakers would provide strong evidence that a transfer effect in English speakers not only exists but is robust to inconsistent cues.
In sum, we asked English and Chinese L2 learners of Italian to read aloud nonwords, and we examined how vocabulary size and the configuration of stress in the L1 influence their relative reliance on stress dominance and stress neighborhood cues to stress assignment.
Experiment 1
L1 English speakers who learned Italian as L2 performed a nonword reading task followed by a test of Italian receptive vocabulary. The final sequences of the nonword stimuli had either a penultimate, antepenultimate, or ambivalent stress neighborhood. To gain insight in potential transfer of first-syllable stress from English, the number of syllables of the nonwords was also manipulated.
Method
Participants
Thirty-nine English–Italian bilinguals (27 female) participated. Thirty-four were younger adults (age 18–27 years, M = 20, SD = 2.1) enrolled as students at the University of Western Ontario. Five older adults (age 50–72 years, M = 62, SD = 8.3) were recruited from either formal Italian classes or conversation programs held at the universityFootnote 2. All participants reported being more proficient in English than in Italian. Participants had learned Italian in classroom settings. Participants who knew other languages besides English and Italian (typically, French) reported that Italian was the non-native language they knew best. Italian vocabulary scores are reported below.
Materials
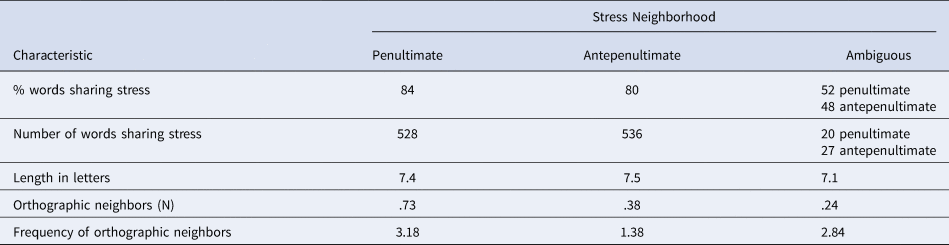
Twenty-four final sequences were extracted from Q2Stress (Spinelli et al., Reference Spinelli, Sulpizio and Burani2017). Of these, eight sequences (-amo, -ani, -era, -eri, -ina, -ino, -ita, -ore) had a penultimate stress neighborhood, eight (-ere, -ica, -ico, -ide, -idi, -ole, -oli, -ono) had an antepenultimate stress neighborhood, and eight (-afo, -odo, -oga, -omi, -oro, -ubo, -uce, -uge) had an ambivalent stress neighborhood. Frequency measures for stress neighborhoods were also derived from Q2Stress. These measures are based on the total number of multi-syllabic words sharing a specific ending considering all possible stress patterns for that ending. Endings with diacritic marks (e.g., -erà) were not included in these calculations (see Spinelli et al., Reference Spinelli, Sulpizio and Burani2017). Sequences with penultimate and antepenultimate stress neighborhoods were matched on frequency counts of stress neighborhood (Sulpizio et al., Reference Sulpizio, Arduino, Paizi and Burani2013), both in terms of the percentage of words sharing the stress pattern of the neighborhood out of the total words ending with that sequence, and the number of words sharing the stress pattern of the neighborhood (see Table 1). Type, rather than token, frequency measures were used because tokens are known to have a minor role in stress assignment in Italian compared to types (Burani & Arduino, Reference Burani and Arduino2004; Sulpizio et al., Reference Sulpizio, Arduino, Paizi and Burani2013). Sequences with an ambivalent stress neighborhood were selected so that they provided no strong bias overall. Those sequences were also less frequent in general. The reason for this choice was that, with uncommon final sequences, the frequency characteristics of the stress neighborhood have little impact on performance (Sulpizio et al., Reference Sulpizio, Arduino, Paizi and Burani2013).
Characteristics of the nonwords

For each of the eight final sequences in the three stress neighborhoods, there were 4 three-syllable and 4 four-syllable orthographically legal Italian nonwords, for a total of 192 nonwords (see Appendix). The nonwords with penultimate, antepenultimate, and ambivalent stress neighborhood sequences were matched on length in number of letters, orthographic neighborhood size, and mean frequency of the orthographic neighbors.
Italian receptive vocabulary was assessed using an adaptation of the Peabody Picture Vocabulary Test-Revised (Dunn & Dunn, Reference Dunn and Dunn1981) for Italian (Stella, Pizzoli & Tressoldi, Reference Stella, Pizzoli and Tressoldi2000). The Peabody consists of a series of plates, each with four pictures. The examiner reads a word aloud and the test taker must indicate which of the four pictures corresponds to the word. The Italian version retained most of the picture stimuli from the English version. In developing the Italian version, the test was given to 2400 Italian speakers from age 3–16, and the 175 stimuli were subsequently ordered in ascending order of difficulty.
Procedure
For the nonword reading task, DMDX (Forster & Forster, Reference Forster and Forster2003) software was used. Each trial began with a fixation cross for 400 ms followed by a nonword, which was presented in lowercase for 4000 ms or until a response was made. All stimuli were presented in Times New Roman-16 centered on the screen. Participants were instructed to read the nonword aloud as if it were an Italian word. Speed was not emphasized. Instead, participants were encouraged to produce phonemically accurate pronunciations of the nonwords for Italian. Participants completed 5 practice trials followed by a randomized list of all of the experimental trials.
Following the nonword reading task, participants completed the vocabulary test. Scoring was done on-line by the experimenter, who ended the test after all 175 trials or when 6 errors were made on 8 consecutive trials (as per test instructions). A participant's score on the test was the number of correct responses made.
Results
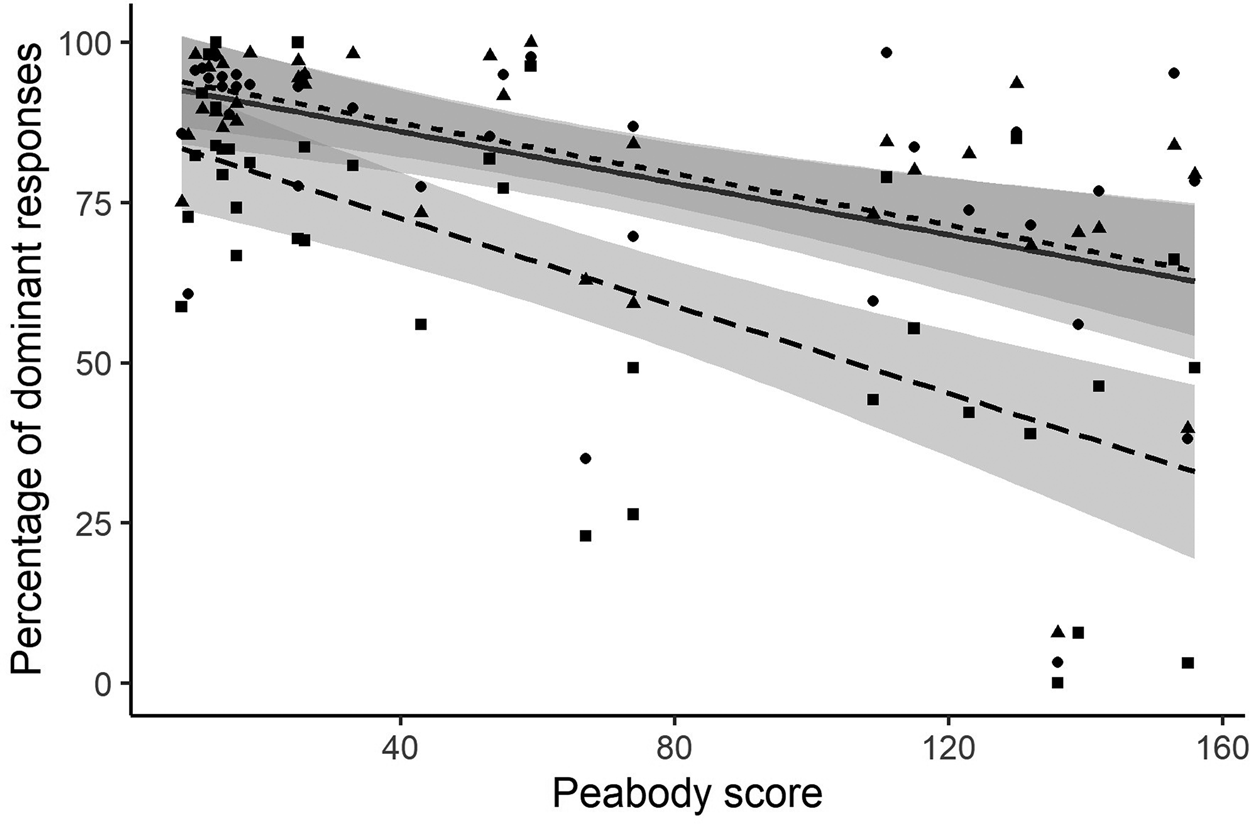
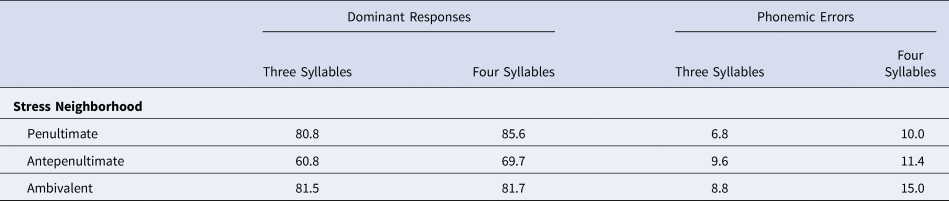
Peabody test scores ranged from 8 to 156 (M = 61.7, SD = 53.3; see Figures 1–3 for the distribution of scores). For the nonword reading task, Checkvocal (Protopapas, Reference Protopapas2007) was used by the first author, a native Italian speaker, to inspect the waveform for each trial and code the response. Responses were first coded as final stress, penultimate stress, antepenultimate stress, pre-antepenultimate stress, or as a phonemic error whenever phoneme substitutions, omissions, insertions or transpositions, hesitations or stuttering occurred. One participant was removed from the analyses because she did not produce a response for more than 70% of the trials. For the remaining 38 participants, invalid trials due to technical failures and missed responses (.95% of trials) were discarded. The subject means for the percentage of language dominant stress responses and phonemic errors are reported in Table 2. The phonemic errors were not analyzed further. Overall, 76.8% of responses received language-dominant (penultimate) stressFootnote 3.
The impact of Peabody score on the percentage of dominant-stress (penultimate) responses for nonwords with a penultimate, antepenultimate, and ambivalent stress neighborhood in Experiment 1
Note. For each participant, the mean percentage of dominant responses to nonwords with a penultimate, antepenultimate, or ambivalent stress neighborhood is marked with a triangle, a square, and a circle, respectively. Regression slopes (with 95% confidence interval bands) for nonwords with a penultimate, antepenultimate, or ambivalent stress neighborhood are marked with short dashed, long dashed, and solid lines, respectively.

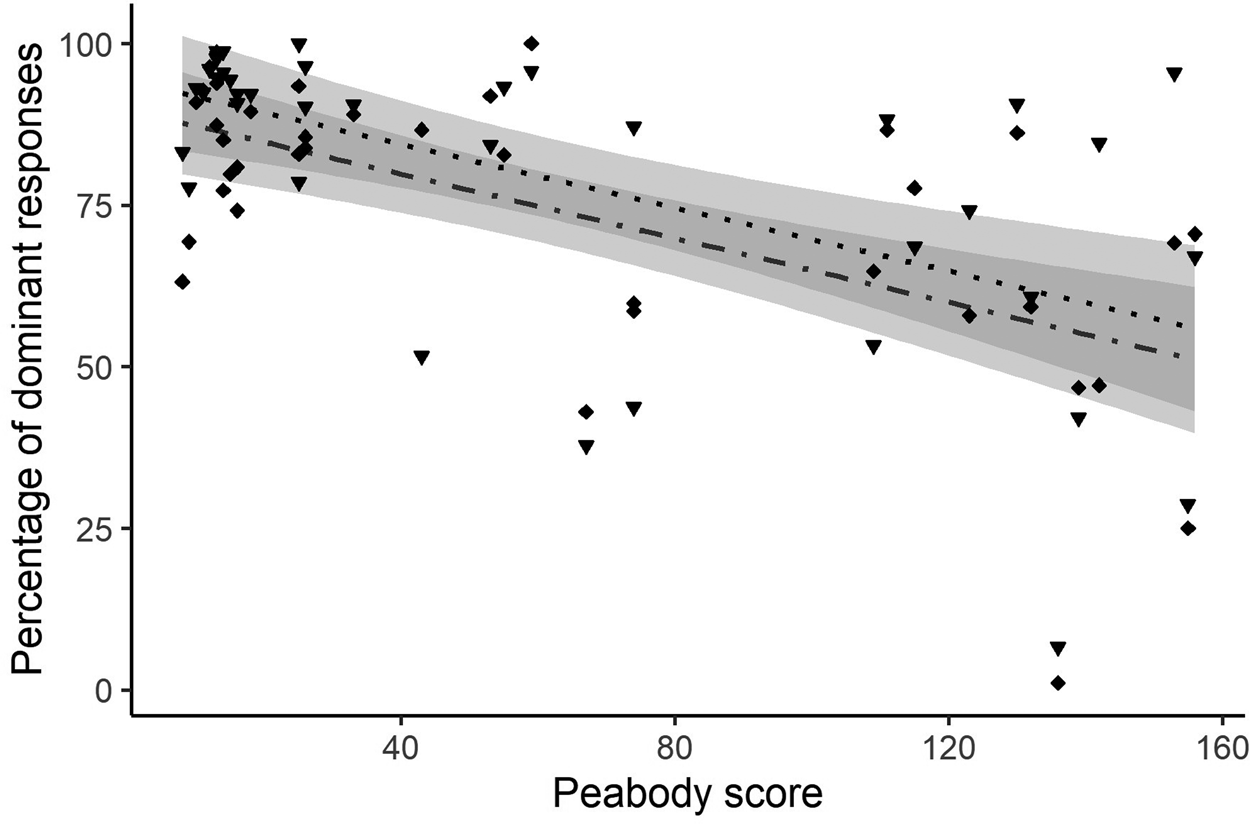
The impact of Peabody score on the percentage of dominant-stress (penultimate) responses for three-syllable and four-syllable nonwords (with all stress neighborhoods collapsed) in Experiment 1
Note. For each participant, the mean percentage of dominant stress responses made to three-syllable and four-syllable nonwords is marked with a diamond and an upside-down triangle, respectively. Regression slopes (with 95% confidence interval bands) for three-syllable and four-syllable nonwords are marked with dot-dash patterned line and a dotted line, respectively.

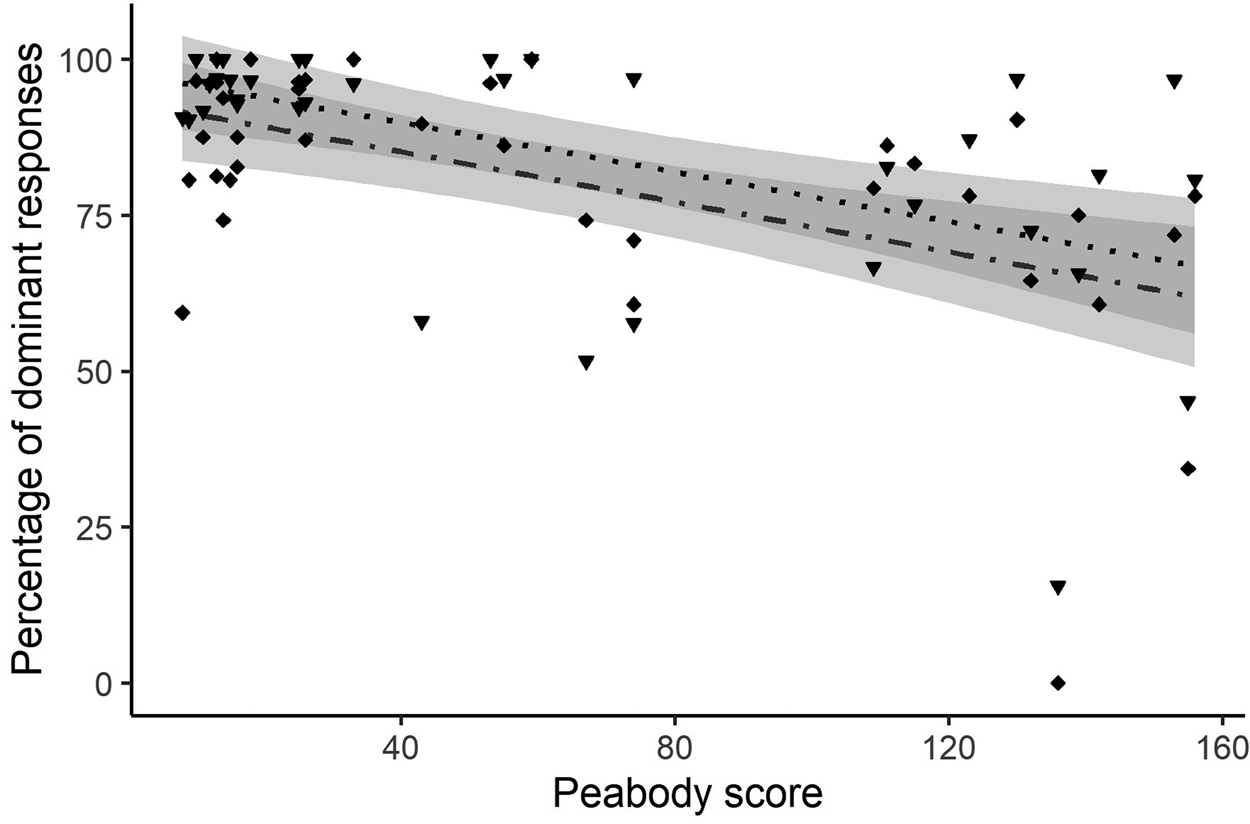
The impact of Peabody score on the percentage of dominant-stress (penultimate) responses for three-syllable and four-syllable nonwords with a penultimate stress neighborhood in Experiment 1
Note. For each participant, the mean percentage of dominant stress responses made to three-syllable and four-syllable nonwords is marked with a diamond and an upside-down triangle, respectively. Regression slopes (with 95% confidence interval bands) for three-syllable and four-syllable nonwords are marked with dot-dash patterned line and a dotted line, respectively.

Mean percentage of dominant-stress (penultimate) responses and phonemic errors in Experiment 1

Stress responses were coded as language dominant if penultimate stress was assigned or non-dominant if another stress pattern was assigned. A mixed logistic regression model was run using the glmer function in R version 3.5.1 (R Core Team, 2018), treating subjects and items as random effects and treating Stress Neighborhood (penultimate, antepenultimate, ambivalent), Number of Syllables (3, 4), and Peabody Score as fixed effects (Baayen, Reference Baayen2008; Baayen, Davidson & Bates, Reference Baayen, Davidson and Bates2008). Prior to running the model, R-default treatment contrasts were changed to sum-to-zero contrasts to help interpret lower-order effects in the presence of higher-order interactions (Levy, Reference Levy2014). The model was fit by maximum likelihood with the Laplace approximation technique. The lme4 package, version 1.1–18–1 (Bates, Mächler, Bolker & Walker, Reference Bates, Mächler, Bolker and Walker2015) was used to run the generalized linear mixed-effects model. The function Anova in the car package version 2.1–2 (Fox & Weisberg, Reference Fox and Weisberg2011) was used to obtain estimates and probability values for the fixed effects. Post-hoc analyses were conducted using the emmeans package, version 1.3.1 (Lenth, Reference Lenth2018), with Tukey's HSD adjustment for multiple comparisons. To limit the occurrence of convergence failures, we kept the random structure of the model as simple as possible by using only random intercepts for participants and items and by standardizing our continuous predictor (Peabody Score). The model for the stress analysis was: stress = glmer (dominant_stress_assignment ~ stress_neighborhood * number_of_syllables * standardized_Peabody + (1|subject) + (1|item), family = binomial). The initial model failed to converge. However, convergence was obtained once model estimation was restarted from the apparent optimum as per the standard troubleshooting procedure (see ‘convergence’ help page in R). We report the results from the restarted model.
There was an effect of Stress Neighborhood, χ 2 = 85.59, p < .001, indicating that participants were not indiscriminately applying language-dominant stress to all types of nonwords. Language-dominant stress responses were less likely to nonwords with an antepenultimate stress neighborhood (65.2%) than to nonwords with a penultimate stress neighborhood (83.2%), ß = 1.44, SE = .18, z = 7.97, p < .001. However, nonwords with an ambivalent stress neighborhood (81.7%) were as likely to receive the language-dominant stress as nonwords with penultimate stress neighborhoods, ß = −.11, SE = .19, z = −.60, p = .82, and were more likely to receive that stress pattern than nonwords with an antepenultimate stress neighborhood, ß = 1.33, SE = .18, z = 7.37, p < .001. Number of Syllables also had an effect, χ 2 = 6.28, p = .012, with language-dominant stress responses being more likely (and conversely, non-dominant, antepenultimate stress responses being less likely) for four-syllable nonwords (79.1%) than for three-syllable nonwords (74.4%). Because antepenultimate stress corresponds to first-syllable stress in three-syllable nonwords, this effect suggests a transfer of a bias for first-syllable stress from English. There was also an effect of Peabody Score, χ 2 = 22.84, p < .001, and an interaction of Peabody Score with Stress Neighborhood, χ 2 = 15.68, p < .001. This interaction, represented in a scatterplot of participants’ mean percentages of language-dominant stress responses in all stress neighborhood conditions in Figure 1, indicated that the decline in language-dominant stress responses associated with higher Peabody Scores was more pronounced for nonwords with an antepenultimate stress neighborhood than either for nonwords with a penultimate stress neighborhood, ß = .29, SE = .09, z = 3.16, p = .004, or for nonwords with an ambivalent stress neighborhood, ß = .30, SE = .09, z = 3.40, p = .002. Peabody Score had a similar impact on stress assignment for nonwords with penultimate and ambivalent stress neighborhoods, ß = .02, SE = .09, z = .18, p = .98.
Note that Number of Syllables did not interact with Stress Neighborhood, χ 2 = 2.98, p = .23, suggesting that all types of three-syllable nonwords elicited more antepenultimate stress responses than their four-syllable counterparts, including three-syllable nonwords with a penultimate stress neighborhood, which received antepenultimate stress 19% of the time. As noted, these nonwords represent a particularly informative case regarding transfer of stress preferences from English because assigning antepenultimate (first-syllable) stress to these nonwords implies ignoring the bias for penultimate stress coming from both stress dominance and stress neighborhood information. Note further that Number of Syllables did not interact with Peabody Score either, χ 2 = .92, p = .34, nor was there a three-way interaction between Number of Syllables, Stress Neighborhood, and Peabody Score. This suggests that the preference for assigning antepenultimate stress to three-syllable compared to four-syllable nonwords occurred across the range of Peabody scores, as illustrated in Figure 2 for all types of nonwords and in Figure 3 for nonwords with a penultimate stress neighborhood in particular.
Discussion
Experiment 1 examined whether vocabulary size in L2 Italian modulates relative reliance on stress dominance and stress neighborhood in English–Italian bilinguals. The results we obtained support this idea. First, overall, we found a prevalence of language-dominant stress responses. Second, the tendency to assign the language-dominant stress pattern decreased as Italian vocabulary size increased. Third, participants’ tendency to assign the language-dominant stress pattern was also modulated by stress neighborhood, with nonwords with an antepenultimate stress neighborhood receiving fewer language-dominant stress responses than nonwords with a penultimate or ambivalent stress neighborhood, particularly from participants with higher vocabulary scores. Note that because the vast majority of non-dominant responses were antepenultimate stress responses, what these results suggest is that participants with a larger vocabulary learned to associate final sequences with their typical stress pattern. These results are consistent with the idea that, early in learning Italian as L2, individuals rely more heavily on stress dominance in the language rather than on stress neighborhood information, a preference that would lead them to assign the language-dominant stress pattern to all nonwords, including nonwords with an antepenultimate (non-dominant) stress neighborhood. However, as vocabulary size increases, this bias is gradually abandoned and replaced with use of stress neighborhood information, a strategy that implies assigning a stress pattern consistent with the final sequence of the nonword.
Another objective of Experiment 1 was to examine whether participants transfer knowledge about stress distribution from English to Italian. Because first-syllable stress is the most frequent stress pattern in English and such a pattern would correspond to antepenultimate stress in three-syllable stimuli, but not in four-syllable stimuli, we hypothesized that three-syllable nonwords would receive more antepenultimate stress responses than four-syllable nonwords, nonwords for which such a transfer effect would favor pre-antepenultimate stress. The data that we obtained seem consistent with this hypothesis, as language-dominant stress responses were less frequent (and, conversely, antepenultimate stress responses were more frequent) for three-syllable nonwords than for four-syllable nonwords. In addition, on 19% of trials, participants made antepenultimate stress responses to three-syllable nonwords for which both the language and neighborhood distributional information indicated that stress should occur on the penultimate syllable. Although at least some of these responses may be simply produced by participants’ understanding that antepenultimate stress should be occasionally used, these results appear consistent with the notion of transfer of first-syllable stress from English.
However, other aspects of the data call this interpretation into question. First, pre-antepenultimate responses to four-syllable nonwords (i.e., first-syllable responses) were rare (2.81% of the non-dominant stress responses), although this might be because pre-antepenultimate stress is the most uncommon stress pattern in Italian (Spinelli et al., Reference Spinelli, Sulpizio and Burani2017), or because first-syllable stress is not the most frequent stress pattern for four-syllable English words specifically (see footnote 1). More importantly, the overall tendency for three-syllable nonwords to receive fewer language-dominant stress responses than four-syllable nonwords was not influenced by vocabulary size. Transfer effects from the L1 should have less impact as lexical knowledge in the L2 improves. That is, the difference in stress assignment preferences between three-syllable and four-syllable nonwords should be larger for individuals with a smaller vocabulary than for individuals with a larger vocabulary, a pattern that we failed to observe. A possible interpretation of these results is that the transfer effect is not limited to the initial stages of learning Italian as the L2, but remains even later in lexical development.
There is, however, an alternative account of the differences in stress assignment preferences between three-syllable and four-syllable nonwords that has to do with the difficulty associated with reading those stimuli. As shown in Table 2, four-syllable nonwords were more prone to phonemic errors than three-syllable nonwords. Thus, it is possible that in dealing with difficult four-syllable nonwords, readers of L2 Italian might prefer using stress dominance, a source of information that is presumably easy to apply, rather than stress neighborhood, a less straightforward albeit more precise source of information. In contrast, three-syllable nonwords, being less difficult to pronounce, would not bias participants to assign the language-dominant stress pattern to the same extent. The result would be increased language-dominant stress responses to four-syllable than to three-syllable nonwords. Note, however, that this explanation implies that four-syllable nonwords should elicit more language-dominant stress responses than three-syllable nonwords irrespective of the native language of the individual, a point to which we return in Experiment 2.
Experiment 2
In Experiment 2, Chinese–Italian bilinguals completed the same tasks as English–Italian bilinguals did in Experiment 1. Data from this population are useful in at least two ways. First, they afford an opportunity to determine whether the trajectory typically found in children acquiring L1 Italian (e.g., Colombo et al., Reference Colombo, Deguchi and Boureux2014) and obtained in English speakers learning L2 Italian in Experiment 1 – a gradual shift from a strategy more reliant on language-dominant stress to a strategy of utilizing stress neighborhood information as Italian vocabulary improves – would replicate in the context of an L1 other than English. Note that the finding that English native speakers follow a similar trajectory in assigning stress in L2 Italian as Italian children do in the process acquiring their L1 may not be particularly surprising because English and Italian share many similarities in the sources of information used for stress assignment (in particular, stress dominance and stress neighborhood: Brown et al., Reference Brown, Lupker and Colombo1994; Arciuli & Cupples, Reference Arciuli and Cupples2006; Burani & Arduino, Reference Burani and Arduino2004; Colombo, Reference Colombo1992), and English-speaking children also show a shift from assigning language-dominant stress to using stress neighborhood as the primary source of information for assigning stress in English (Arciuli et al., Reference Arciuli, Monaghan and Seva2010). Thus, observing a trajectory from a strategy that relies more heavily on stress dominance information to a strategy that favors stress neighborhood information in Chinese–Italian bilinguals, who presumably have had little or no experience with those strategies earlier in life, would make a strong case for the idea that learning to assign stress in Italian involves a general process, irrespective of whether another language, and which other language, was acquired first.
The second way in which Chinese–English bilinguals can inform the present research is with respect to the issue of transfer. Unlike English, Chinese does not seem to be a language that would help stress assignment in L2 Italian because stress does not appear to be as relevant in Chinese as it is in English and Italian. In addition, even if Chinese–Italian bilinguals attempted to transfer pronunciation habits from Chinese, this would lead them to overgeneralize final-syllable stress (Duanmu, Reference Duanmu2007). Italian orthography allows final-syllable stress only in the presence of a diacritic; for the stimuli in the present experiments, this pattern would always be inappropriate. Thus, Chinese–Italian bilinguals seem unlikely to produce a transfer effect from their L1 and therefore, they serve as an important comparison for the English–Italian bilinguals in Experiment 1. In English–Italian bilinguals, an apparent transfer effect was obtained in the form of reduced dominant stress responses to three-syllable nonwords compared to four-syllable nonwords. If that finding indeed reflects transfer, no such difference would be expected for Chinese–Italian bilinguals. In contrast, if the finding in Experiment 1 of reduced language-dominant stress responses to three-syllable nonwords compared to four-syllable nonwords is due to a difficulty effect rather than a transfer effect from English, then Chinese–Italian bilinguals should show a similar pattern as English–Italian bilinguals. Furthermore, the responses of Chinese–Italian bilinguals on three-syllable nonwords with a penultimate stress neighborhood will be particularly helpful in clarifying whether the English–Italian bilinguals’ responses on those nonwords reflect transfer from English or simply knowledge that some Italian words take antepenultimate stress. If the latter is the case, then both groups should make a similar number of antepenultimate stress responses to those items, but, if the former is true, then Chinese–Italian bilinguals would be expected to make fewer antepenultimate stress responses to those items.
Method
Participants
Forty-three Chinese–Italian bilinguals (28 female) participated (age 18–36 years, M = 23, SD = 3.5). All participants were born in China and had Mandarin Chinese as their first language. They left China to take Italian classes at the University for Foreigners of Perugia (Italy). Participants had learned most of their Italian in classroom settings. All had been in Italy for less than two years at the time of testing. All participants reported being more proficient in Chinese, their native language, than in Italian. Participants had some knowledge of English, but reported that Italian was the non-native language they knew best.
Materials and Procedure
These were the same as in Experiment 1.
Results
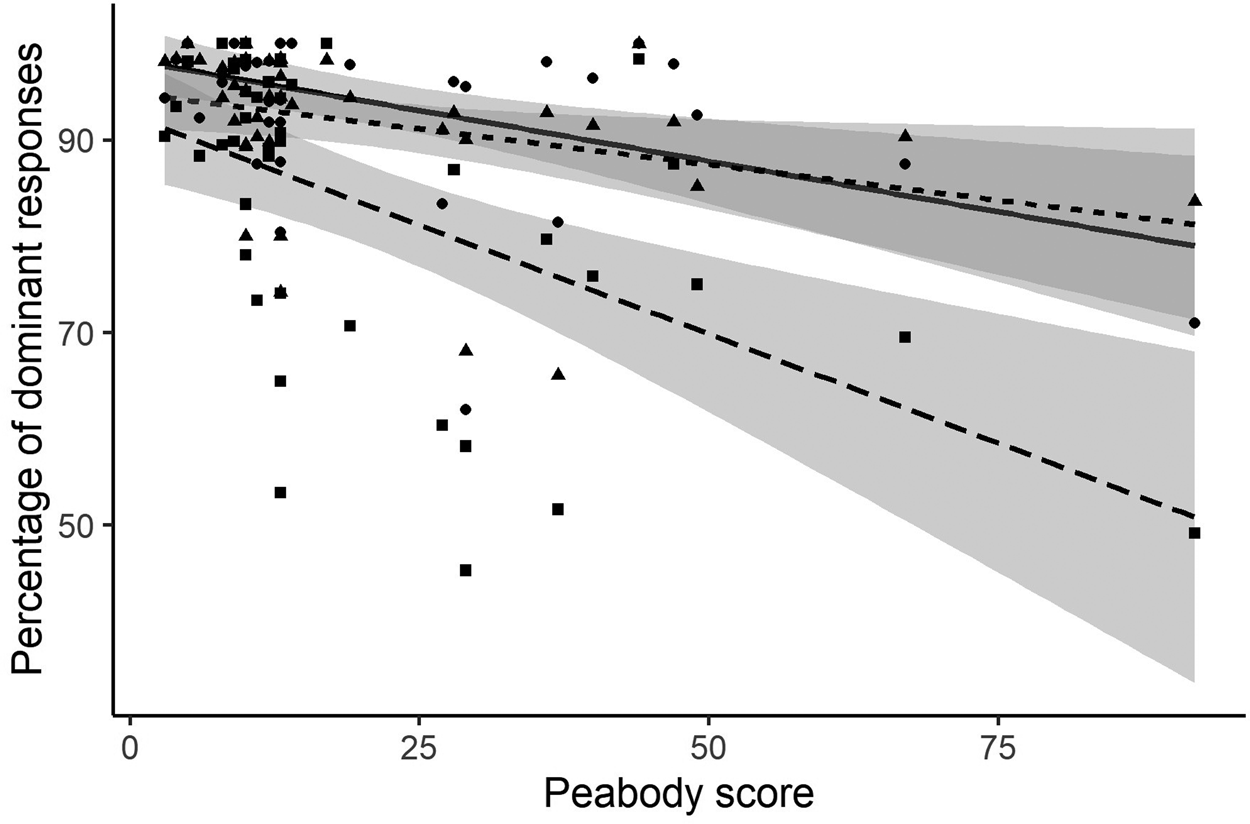
Peabody test scores ranged from 3 to 92 (M = 20.0 SD = 18.3; see Figure 4 for the distribution of scores). These scores were overall lower than the scores obtained for English–Italian bilinguals in Experiment 1 (M = 61.7). Thus, although the Chinese–Italian bilinguals were immersed in an Italian environment, these results suggest that they were still in the early process of acquiring Italian vocabulary. For the nonword reading task, the second author rated the responses on-line and the first author used Checkvocal (Protopapas, Reference Protopapas2007) to inspect the waveform for each trial and rate the response. Both the first and second authors are native Italian speakers and there was very good agreement among their ratings, Cohen's κ = .968. We report the ratings of the first author. Coding of the responses was done in the same way as in Experiment 1. One participant was removed from the analyses because he produced responses after the 4000-ms deadline on most of the trials. For the remaining 42 participants, invalid trials due to technical failures and missed responses (1.19%) were discarded.
The impact of Peabody score on the percentage of language-dominant stress responses for nonwords with a penultimate, antepenultimate, and ambivalent stress neighborhood in Experiment 2
Note. For each participant, the mean percentage of dominant responses to nonwords with a penultimate, antepenultimate, or ambivalent stress neighborhood is marked with a triangle, a square, and a circle, respectively. Regression slopes (with 95% confidence interval bands) for nonwords with a penultimate, antepenultimate, or ambivalent stress neighborhood are marked with short dashed, long dashed, and solid lines, respectively.

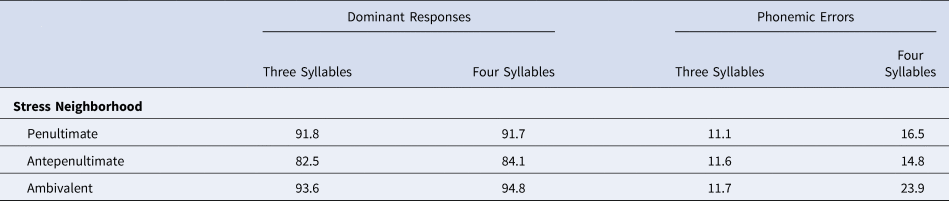
Analyses were conducted as in Experiment 1. The subject means for the percentage of language-dominant stress responses and phonemic errors are reported in Table 3. Overall, 89.6% of responses received language-dominant stressFootnote 4. Of interest, Chinese–Italian bilinguals produced final-syllable stress, which could be considered consistent with Chinese, in 5.98% of the non-dominant responses, whereas, in Experiment 1, English–Italian bilinguals produced final syllable stress in only .77% of the non-dominant responses.
Mean percentage of dominant-stress responses (for words without phonemic errors) and phonemic errors in Experiment 2

An effect of Stress Neighborhood was obtained, χ 2 = 50.15, p < .001, indicating again that participants were not indiscriminately applying language-dominant stress to all types of nonwords. As in Experiment 1, language-dominant stress responses were less likely for nonwords with an antepenultimate stress neighborhood (83.4%) than for nonwords with a penultimate stress neighborhood (91.9%), ß = .93, SE = .21, z = 4.41, p < .001. However, in contrast to Experiment 1, nonwords with an ambivalent stress neighborhood language were more likely to receive language-dominant stress responses (94.1%) than nonwords with a penultimate stress neighborhood, ß = .60, SE = .23, z = 2.64, p = .023, although, as found previously, they were also more likely to receive that stress pattern than nonwords with an antepenultimate stress neighborhood, ß = 1.53, SE = .22, z = 6.85, p < .001. Interestingly, here there was no effect of Number of Syllables, χ 2 = .20, p = .65, with three-syllable nonwords receiving language-dominant stress as often (89.3%) as four-syllable nonwords (90.0%).
The effect of Peabody Score was significant, χ 2 = 11.03, p < .001, again showing a general tendency for language-dominant stress responses to decrease with higher Peabody Scores. In addition, Peabody Score and Stress Neighborhood interacted, χ 2 = 12.20, p = .002 (see Figure 4). Similar to Experiment 1, this Peabody Score by Stress Neighborhood interaction indicated that the decline in language-dominant stress responses associated with higher Peabody Score was more pronounced for nonwords with an antepenultimate stress neighborhood than for nonwords with a penultimate stress neighborhood, ß = .28, SE = .09, z = 3.12, p = .005; in addition, a higher Peabody Score led to a more rapid decrease in language-dominant stress responses for nonwords with an ambivalent stress neighborhood than for nonwords with a penultimate stress neighborhood, ß = −.31, SE = .10, z = −3.06, p = .006. Peabody Score had a similar impact on the stress assigned to nonwords with an ambivalent stress neighborhood and those with an antepenultimate stress neighborhood, ß = −.03, SE = .09, z = −.22, p = .94. Peabody Score also interacted with Number of Syllables, χ 2 = 13.75, p < .001. As Peabody Score increased, language-dominant stress responses decreased more rapidly for four-syllable nonwords (ß = −.72, SE = .18) than for three-syllable nonwords (ß = −.44, SE = .18), ß = .28, SE = .08, z = 3.67, p < .001. With respect to the issue of transfer, three-syllable nonwords with a penultimate neighborhood were assigned antepenultimate stress on only 7% of the trials.
Discussion
Experiment 2 succeeded in reproducing for Chinese–Italian bilinguals the critical result obtained in Experiment 1 for English–Italian bilinguals: while language-dominant stress responses accounted for most of the observations, the tendency to assign the language-dominant stress pattern decreased with a larger vocabulary, especially for nonwords with an antepenultimate and an ambivalent stress neighborhood. Thus, in assigning stress, Chinese–Italian bilinguals, similar to English–Italian bilinguals, appear to initially rely on stress dominance information and then assign an increasingly important role to stress neighborhood information as their vocabulary in Italian expands. What is worth noting is that this result was obtained even though native Chinese speakers, unlike native English speakers, presumably had little or no experience at managing stress dominance and stress neighborhood information when acquiring their L1. Therefore, these results, combined with the results of Experiment 1 and the findings from the L1 Italian developmental literature (e.g., Colombo et al., Reference Colombo, Deguchi and Boureux2014), suggest that the shift from stress dominance to stress neighborhood as sources of information for stress assignment in Italian is a process that is inherent in the development of the acquisition of Italian, either as the L1 or as an L2. Furthermore, there was a hint that Chinese speakers transferred stress assignment habits from their L1, as they assigned final syllable stress to about 5% more nonwords than did the English native speakers even though final syllable stress was an illegal stress pattern for the nonwords we used (as no diacritic on the final syllable was present).
Another important result of this experiment was the finding that assignment of language-dominant stress was equivalent for three-syllable and four-syllable nonwords, a result that contrasts with that obtained with English–Italian bilinguals in Experiment 1 who produced more antepenultimate stress responses to three-syllable than four-syllable nonwords. In Experiment 1, we considered an interpretation of this number-of-syllables effect as being due to differences in the difficulty of naming three vs four-syllable nonwords. However, the data from Chinese–Italian bilinguals provide evidence against this interpretation because they showed no effect of number of syllables even though they produced even more phonemic errors on four-syllable nonwords than English–Italian bilinguals did.
It must be noted, however, that participants in Experiment 2 scored substantially lower on the Peabody test (M = 20.0) than did participants in Experiment 1 (M = 61.7). To ensure that the number-of-syllables effect obtained in English–Italian bilinguals but not in Chinese–Italian bilinguals did not depend on overall proficiency differences, we conducted an additional analysis in which the two groups were matched on Peabody scores. Participants in each group were divided into tertiles based on their Peabody scores, and we selected those in the first and second tertiles in the English–Italian group, and the second and third tertiles in the Chinese–Italian group. These participants (N = 53; 26 English–Italian, 27 Chinese–Italian) were matched on Peabody scores (M = 28.5 for English and M = 26.8 for Chinese participants), t(51) = .30, p = .76. An analysis was carried out as in Experiments 1 and 2, but with L1 and Number of Syllables as fixed effects. In this analysis, the interaction between Number of Syllables and L1 was the only significant effect, χ 2 = 7.30, p = .007. Similar to what was found in Experiments 1 and 2 when analyzed separately, while English–Italian bilinguals produced fewer language-dominant responses to three-syllable (82.2%) than four-syllable nonwords (86.4%), ß = −.38, SE = .18, z = −2.12, p = .034, Chinese–Italian bilinguals assigned language-dominant stress to three-syllable nonwords (86.2%) as often as to four-syllable nonwords (86.9%), ß = −.01, SE = .18, z = −.04, p = .97. We return to the question of transfer in English–Italian bilinguals below.
General discussion
When acquiring a new language, learning to assign a stress pattern to written words can present a challenge, especially for languages like Italian in which stress information cannot be easily derived from the orthography and must instead be computed from distributional properties of the language. Readers can obtain both general information, such as information on the dominant stress pattern in the language, and more specific information, such as information about associations between orthographic final sequences and stress patterns (Colombo, Reference Colombo1992). Here, we attempted to characterize the processes governing the use of these sources of information as the vocabulary of an L2 Italian reader improves. In particular, we examined the hypothesis that the process of learning to assign stress in L2 Italian would follow a similar pattern as found for children acquiring Italian as their L1, with an initial bias for the language-dominant stress pattern being gradually replaced by reliance on stress neighborhood. In this trajectory, lexical development plays a major role in determining what information is available for Italian readers to use, with stress dominance, information which can be derived even from a small vocabulary, being available earlier than stress neighborhood information, information for which a larger vocabulary is required.
We obtained support for this idea in English–Italian and Chinese–Italian bilinguals with a nonword reading aloud task. Specifically, we found that while L2 Italian readers showed an overall preference for the language-dominant stress pattern in pronouncing the nonwords, this preference was more evident for readers with a smaller Italian vocabulary than for readers with a larger Italian vocabulary. Stress assignment preferences were also modulated by the stress neighborhood of the nonword, with nonwords with an antepenultimate stress neighborhood receiving antepenultimate stress more often than nonwords with a penultimate stress neighborhood and nonwords with an ambivalent stress neighborhood. Importantly, stress neighborhood information had a larger impact in individuals with a larger vocabulary. This finding, not directly examined in previous research for Italian, suggests that for adult L2 readers of Italian, as for developing L1 readers, the ability to learn associations between orthographic final sequences and stress patterns improves along with the gradual enrichment of their vocabulary. The fact that the same pattern of results was found for both English and Chinese speakers suggests that this trajectory is inherent in the process of learning to assign stress in Italian, with the L1 playing little role in shaping it. It does not appear to matter whether Italian L2 readers are already familiar with managing language dominant stress and stress neighborhood information or not: in both cases, stress dominance and, subsequently, stress neighborhood information are used in assigning stress in Italian.
We also investigated whether readers would transfer habits from L1 in assigning stress in Italian. We hypothesized a potential transfer effect for English speakers of their first-syllable stress bias, but little transfer effect for Chinese speakers, speakers of a language in which stress patterns are more subtle (Duanmu, Reference Duanmu2007). English–Italian bilinguals produced some evidence for a transfer of first-syllable stress bias for three-syllable nonwords. First-syllable stress on a three-syllable nonword corresponds to antepenultimate stress, and indeed English–Italian bilinguals showed greater use of antepenultimate stress for three-syllable nonwords compared to four-syllable nonwords (for which the first syllable is the pre-antepenultimate syllable), whereas no such difference was observed for Chinese–Italian bilinguals. This pattern, observed in Experiments 1 and 2 when analyzed separately, was replicated when the data for English–Italian and Chinese–Italian bilinguals matched on vocabulary size were combined in a single analysis. We noted that a transfer effect for nonwords with a penultimate stress neighborhood would be especially interesting because stress dominance and stress neighborhood converge in biasing readers towards penultimate stress in those stimuli. In spite of this strong bias for penultimate stress, English–Italian bilinguals assigned antepenultimate stress to three-syllable nonwords with a penultimate stress neighborhood 19% of the time. Considering that Chinese–Italian bilinguals assigned antepenultimate stress to those nonwords only 7% of the time, we can conclude that, while some of those responses could be due to an occasional tendency to assign antepenultimate stress, a sizeable portion of those responses in English–Italian bilinguals are likely the result of transfer of a first-syllable stress bias from EnglishFootnote 5. Chinese–Italian bilinguals were slightly more likely to assign final syllable stress to nonwords than English–Italian bilinguals, providing some indication of transfer from Chinese to Italian. The evidence of transfer was likely weak for Chinese participants because stress is not a salient phonological feature of Chinese.
We also noted that a reasonable hypothesis is that a transfer effect from English would be especially impactful initially and would gradually disappear as Italian vocabulary size increases. However, there was no evidence that the preference for assigning antepenultimate stress to three-syllable compared to four-syllable nonwords reversed, or even reduced, in more advanced English–Italian bilinguals. This finding implies that the transfer effect biasing antepenultimate stress in three-syllable stimuli might persist even when a sizeable Italian vocabulary has been acquired. Chinese–English bilinguals showed an increasing preference for assigning antepenultimate stress to four-syllable compared to three-syllable nonwords as vocabulary size increased. This finding might indicate that they picked up on the fact that, in Italian, antepenultimate stress words are more common as the number of syllables of a word increases (Spinelli et al., Reference Spinelli, Sulpizio and Burani2017).
In sum, the present results suggest that the ability to learn statistical regularities in a language likely plays an important role in learning to assign stress in L2 Italian, as in other aspects of language acquisition (e.g., Seidenberg & McClelland, 1989; Jared, McRae & Seidenberg, 1990). Individuals learning L2 Italian will assign stress using the language-dominant stress pattern initially and, subsequently, associations between orthographic sequences and stress patterns as vocabulary size in the language increases. In addition, regularities in individuals’ L1 – specifically, the L1 dominant stress pattern – may also influence stress assignment in L2. More generally, these findings provide an important contribution to our understanding of the processes governing the acquisition of reading skills in L2.
Note that limitations of the present study are that vocabulary differences were a between-participants measure, and sample sizes were modest. A longitudinal study examining the change in stress assignment preferences within larger groups of individuals learning L2 Italian would provide a stronger test for the conclusions suggested by the present results. Ideally, participants with different L1s would both be living in an environment where the dominant language being used by speakers is either the participants’ L1 or the participants’ L2. Future research could also examine whether computational models of stress assignment developed for Italian (e.g., Pagliuca & Monaghan, Reference Pagliuca and Monaghan2010; Perry, Ziegler & Zorzi, Reference Perry, Ziegler and Zorzi2014) can simulate the performance of English and/or Chinese native speakers learning Italian.
Acknowledgements
This research was supported by a Natural Sciences and Engineering Research Council of Canada Discovery grant to Debra Jared, and the Ontario Trillium Scholarship to Giacomo Spinelli. We thank Taylor Sguazzin for assistance in creating the stimuli and for testing some of the participants in Experiment 1. Author contributions are: GS designed the experiments and collected the data of Experiment 1 with the assistance of Taylor Sguazzin. GS also performed the statistical analyses and wrote the manuscript. LF collected the data of Experiment 2. DJ supervised the whole project. All authors revised the work critically and approved the final version of the manuscript for submission.
Appendix
Nonwords used in Experiments 1 and 2
Nonwords with a penultimate stress neighborhood
Affamo, deramo, moramo, sorvamo, astolamo, fegatamo, fenulamo, mepelamo, gespani, nircani, serani, vorbani, darilani, moralani, sicovani, supalani, cebbera, destera, lemera, mittera, ofidera, pudelera, rinzapera, senamera, buteri, deteri, gefferi, selgeri, feraderi, rolideri, sorateri, tugileri, celdina, falgina, settina, trastina, dedirina, dinafina, lenerina, senamina, battino, comino, tellino, tisino, celebino, epomino, fidacino, toramino, fostita, naprita, sbarita, sfoccita, dinonita, eperita, foronita, sperilita, cratore, genore, mittore, vaccore, bicopore, cimpofore, ginidore, telamore.
Nonwords with an antepenultimate stress neighborhood
Bogere, doltere, fagere, primere, dinatere, olfetere, pinadere, ravilere, dompica, millica, simplica, tizzica, birumica, canforica, dalinica, reluttica, nuvico, senico, sompico, tefico, antifico, bissilico, logorico, mossilico, bagide, catide, cepide, teride, binavide, dabenide, fastoride, pivafide, benidi, roltidi, spalvidi, tompridi, cresimidi, dinafidi, teremidi, toronidi, bonnole, condole, dietole, mizzole, adimole, canatole, concavole, spasimole, bendoli, crespoli, denoli, piscoli, bidaroli, govatoli, mivaroli, reminoli, bintono, fepono, fettono, pralgono, foderono, infimono, salamono, zentorono.
Nonwords with an ambivalent stress neighborhood
Fagafo, gurafo, motafo, tonafo, cimobafo, formanafo, lemanafo, tadogafo, benodo, pilodo, senodo, terodo, belanodo, dettenodo, figarodo, telanodo, coroga, faboga, naloga, taloga, bodunoga, folanoga, pivacoga, rucodoga, piedomi, rudomi, tenomi, zefomi, fipocomi, pitanomi, ronisomi, tinoromi, fraboro, ninoro, senoro, tegoro, ginidoro, mepeloro, stipimoro, tinamoro, motubo, nostubo, saccubo, tenubo, casitubo, dabenubo, fanodubo, menatubo, bettuce, etuce, fabuce, tenuce, ellatuce, fimapuce, paraguce, tenoruce, benuge, cenuge, reluge, tenuge, bilanuge, comiluge, tessaluge, tirenuge.