Introduction
In comparison with most domestic species, studies looking for new tests to improve the canine spermio-gram have been scarce. These studies have been focused on evaluation of sperm membranes, acrosomes or capacitation status; also IVF tests have been deve-loped (Pena et al., Reference Pena, Johannisson and Linde Forsberg1999, Reference Peña, Johannisson and Linde Forsberg2001; Rodriguez Martinez, Reference Rodriguez Martinez2003; Pena Reference Roldan, Cassinello, Abaigar and Gomendio2004). However, the investigation of sperm DNA has been neglected in the canine species. Factors associated with semen quality can be classified as compensable or not compensable (den Dass, Reference den Dass1992), compensable factors can be corrected increasing the number of spermatozoa in an insemination dose. However this cannot be possible with non-compensable factors and thus these kinds of defects have a dramatic impact on sire fertility. The main non-compensable defects are those related to incorrectly assembled chromatin or damaged DNA within the sperm nucleus (Ostermeier et al., 2001).
The existence of different sperm subpopulations within the mammalian ejaculate is currently widely accepted by the scientific community (Abaigar et al., Reference Abaigar, Holt, Harrison and del Barrio1999, Martinez Pastor et al., 2005). The origin of these subpopulations is not yet clear, but it has been hypothesized that their origin may be due to differences in the assembly of individual spermatozoa during spermatogenesis as well to differential maturational status and age through mixing in the epididymis (Abaigar et al., Reference Abaigar, Holt, Harrison and del Barrio1999). These subpopulations have been described in a number of species, including men (Abaigar et al., Reference Abaigar, Holt, Harrison and del Barrio1999, Chantler et al., Reference Chantler, Abraham Peskir and Roberts2004, Martinez Pastor 2005). Most of these studies have used kinematics properties to disclose these subpopulations (Abaigar et al., Reference Abaigar, Holt, Harrison and del Barrio1999, Martinez Pastor 2005); a few studies used other sperm parameters such as sperm morphology (Thurston et al., Reference Thurston, Watson, Mileham and Holt2001, Peña et al., Reference Peña, Saravia, García Herreros, Núñez Martínez, Tapia, Johanisson, Wallgren and Rodríguez Martínez2005), although sperm morphology is considered as one of the better indicators of quality (Phillips et al., Reference Phillips, MacGowan, Johnston and Mayer2004). Morphology of the spermatozoan may reflect DNA content and chromatin organization, since the sperm head consists almost entirely of DNA, we hypothesized that subtle differences in sperm morphology can be related to sperm DNA content and organization. These differences cannot be detected with the traditional visual estimation of sperm morphology but it can be done using computerized analysis of sperm morphology (ASMA). The sperm chromatin structure assay, SCSA, was first described by Evenson et al. (Reference Evenson, Darzynkiewicz and Melamed1980), developed by Evenson and Jost (Reference Evenson and Jost2000) and redefined by Evenson et al. (Reference Evenson, Larson and Kost2002).
Using this staining technique, significant differences were found between proven fertile and sub/infertile men and bulls in their susceptibility of sperm nuclear DNA to denaturation (Evenson et al., Reference Evenson, Darzynkiewicz and Melamed1980).
Since this first publication, the SCSA has demons-trated to be a strong indicator of semen quality in a number of species including humans (Evenson et al., Reference Evenson, Larson and Kost2002), however to the best of our knowledge similar studies have not been performed in dogs. In addition, the data obtained from SCSA analysis always have been used as mean values. We hypothesized that this data can be used to disclose sperm subpopulations within the ejaculate, showing different degree of chromatin condensation, and thus given a new information on biological characteristics that is not given through a traditional use of these data.
Thus the aims of this study were to: (i) develop a simple multi step procedure to identify sperm subpo-pulations. These subpopulations will be disclosed based in morphometric and on DNA integrity characteristics of the spermatozoa; and (ii) test the hypothesis that both subpopulations are related and thus that ASMA derived sperm characteristics may reflect sperm DNA content and organization.
Material and methods
Semen collection
Semen was collected by masturbation in a prewarmed graduated test tube; from four mongrel dogs (five ejaculates per dog) of known fertility (all of them had sired a litter). The ages of the dogs were from 2 to 5 years and all of them sired their last litter within the last 12 months. After collection, sperm samples were keep at 37 °C in a water bath. An aliquot was removed for sperm concentration measurement and evaluation of motility and morphology (phase contrast, microscopy). Only samples with at least 70% motility and 80% normal morphology were included in the study.
Sperm staining and computerized morphometric analysis (ASMA)
Sperm cells were stained and analyzed as described in Peña et al., Reference Peña, Saravia, García Herreros, Núñez Martínez, Tapia, Johanisson, Wallgren and Rodríguez Martínez2005. Each sperm head was measured for nine primary parameters: head area (A) μm2, head perimeter (P) μm, head length (L) μm, head width (W) μm, acrosome area (aa) %, midpiece width (w) μm, midpiece area (a) μm, distance (d) between the major axes of the head and midpiece μm, angle (θ) (°) of divergence of the midpiece from the head axis; and four derived parameters of head shape: FUN1 (L/W), FUN2 (4πA/P2), FUN3 ((L – W)/(L + W)), FUN 4 (πLW/4A).
Sperm chromatin structure assay (SCSA)
In this procedure, sperm are first treated for 30 s at pH 1.2, potentially to denature DNA in situ. With normal chromatin structure sperm DNA does not denature under such conditions. The sperm are then stained with the metachromatic DNA stain acridine orange (AO). When intercalated into native, double-stranded, DNA, AO fluoresced green whereas AO associated with single-stranded DNA fluoresced red. The amount of red and green fluorescence emitted by each of 5000 spermatozoa is measured per sample with a flow cytometer and provides an index of the percentage of cells with denatured DNA (percentage cells outside of the main population, %COMP). More recently has been replaced by percentage spermatozoa with non-detectable (formerly the main population) and detectable (moderate and high populations) DNA fragmentation index (DFI; the extent of DNA denaturation in each individual spermatozoon, expressed as αt and is red/(red + green) fluorescence). Moderate + high DFI equates to the previous COMP value (Evenson et al., Reference Evenson, Larson and Kost2002). SCSA data are expressed as the means of these parameters as well as the variation.
Results of the principal components analysis (PCA) performed on the ASMA data

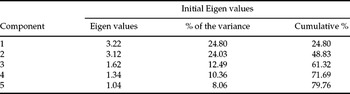
The Eigen values of the first five principal components are given. The percentage of variance is the proportion of the total variance explained by each principal component. The Eigen vectors are a measure of the association of the original parameters with the resulting principal components.
SCSA was performed as described by Januskauskas et al. (Reference Januskauskas, Johannisson and Rodriguez Martínez2001). Briefly, sperm were diluted in TNE buffer (0.15 N HCl, 0.001 M Tris and 0.001 M Na2–EDTA pH 6.8) to 1–2 million spermatozoa per ml. Then 200 μl of this dilution were treated with 400 μl of an acid–detergent solution (0.08 N HCl, 0.1% Triton X-10, pH 1.2) for exactly 30 s, then 1.20 ml of a AO staining solution (Sigma) (6 μg/ml in phosphate citrate buffer) was added and the sample placed in the flow cytometer (Becton Dickinson). SCSA data were collected 3 min later from 5000 spermatozoa in two replicates for each ejaculate and dog. Data were exported to Microsoft Excel for further analysis. The parameters evaluated were: %COMP (cells with increased red and decreased green fluorescence, indicative of denatured DNA). The mean and standard deviation of αt, which represents the amount of denatured DNA for each individual spermatozoa.
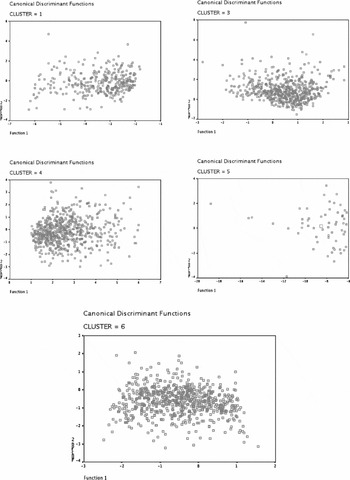
Example of the subpopulations obtained after the discriminant analysis. Dot plots of the morphometric data defined by the two first principal components (PRIN1 and PRIN2). Each event represents an individual spermatozoon. Clusters are presented individually to facilitate its visualization.

Statistical analysis
The main objective of the analysis was to extract sperm subpopulations using the morphometric data obtained from each dog ejaculate by means of clustering procedures as described in Peña et al. Reference Peña, Saravia, García Herreros, Núñez Martínez, Tapia, Johanisson, Wallgren and Rodríguez Martínez2005. In order to study the distributions of observations (individual spermatozoa) within dogs, ejaculates and within subpopulations, we used the ANOVAs and chi-squared tests.
The analysis of the SCSA-derived data was similar except that the first step was not performed since we only used αt as variable, that reflects the amount of denatured DNA in each individual spermatozoa. To investigate the prediction of the amount of denatured DNA (αt) from morphometric-derived parameters in every individual spermatozoa a two-stage least squares regression analysis was performed. Regression analyses are used to describe the relationship among variables precisely, by means of an equation that has predictive value. In contrast to correlation analysis that merely shows that two variables change at the same time. The two-stage least squares regression analysis takes in account that some predictive variables may be correlated, as is the case in some ASMA-derived data.
The classification of spermatozoa was done in two steps. The first one consisted on the definition of low, medium and high DNA fragmentation within an individual spermatozoon. The threshold for each class was established, considering the 25th percentile as low and the 75th percentile as high DNA fragme-ntation within each spermatozoon. Receiver operating characteristics (ROC) curves were used to evaluate the value of the different morphometric parameters in the prediction of the amount of denatured DNA within each spermatozoon.
To study the frequency of distribution of spermatozoa within category within each category a chi-squared test was used. All analysis was performed using SPSS for Windows software version 12.0 (SPSS Inc.).
Results
Identification of morphometric sperm subpopulations
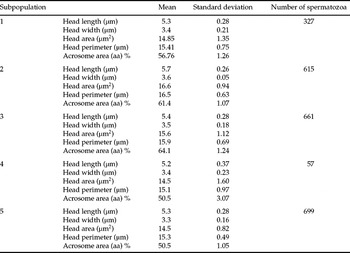
The data matrix consisted of 2361 observations, (morphometric analysis on individual spermatozoa). Five principal components (PC) with Eigen values over 1, representing more of the 79% of the cumulative variance (Table 1). These PC were related to head length (L), head width (W), head area (A), head perimeter (P) and the acrosome area. The second step was k-means clustering analysis using these five variables. For this we used a k-means clustering procedure followed by a discriminant analysis (Figure 1) resulting in the identification of five subpopulations (Table 2). The disclosed subpopulations were characterized by different values of head length (L), width (W), area (A), perimeter (P), and acrosome area (aa). Subpopulations 2 and 3 were characterized by high values of L and W, and percentage of the sperm head occupied by the acrosome, while subpopulations 1, 4 and 5 were sperm cells characterized by lower values of L, W and percentage of sperm heads occupied by the acrosome. The predominant subpopulations were number 1, 3 and 5 while only 57 spermatozoa fell in subpopulation 4. The average values of L, W, A, P and % acrosome were 5.4 ± 0.32 μm, 3.5 ± 0.21 μm, 15.4 ± 1.34 μm2, 15.8 ± 0.85 μm and 60.9% respectively.
Summary of the selected morphometric parameters obtained in this study

This table represents the means values for each subpopulation.
Distribution of sperm morphometric subpopulations in each dog
Depending on the dog considered the predominant subpopulation varied (Table 3). In dog 1 there was a highly significant (p < 0.001) predominance of subpop-ulation number 3. In the other dogs a significant predominance of a sperm subpopulation was also observed, however the distribution of sperm subpopulations was more homogeneous. In dog 4 subpopulation number 2 predominated (p < 0.05) and in dogs 2 and 3 subpopulation number 5 predominated (p < 0.01).
Distribution of spermatozoa (%) falling in each subpopulation derived from the morphometric analysis within each dog

Within a column, values with different superscripts are statistically different α–dp < 0.05.
Effect of the ejaculate in the distribution of morphometric sperm subpopulations
The ejaculate influenced slightly the distribution of sperm subpopulations. However, only subtle, non-significant differences in the sperm morphometric subpopulation structure were found among ejaculates from the same dog.
Identification of sperm subpopulations with different DNA integrity
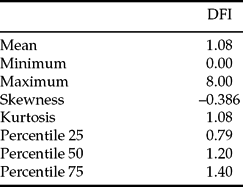
Six subpopulations of spermatozoa showing different DNA integrity (αt) were identified. The data matrix consisted of 63 815 observations and the cluster centre for each subpopulation was: 0.5318, 0.3636, 0.2443, 0.6022, 0.0477, 0.9745 for clusters one to six respectively. In addition, the number of spermatozoa within each cluster was 25 021; 3943; 9469; 22 516; 2682, and 112 for clusters 1 to 6 respectively. The categories for normal, high and low DFIs are given in Table 4. In addition, the percentage of spermatozoa within each dog falling in the category of low medium and high DFI is given in Table 5.
Frequency of distribution of spermatozoa with different degrees of DNA fragmentation
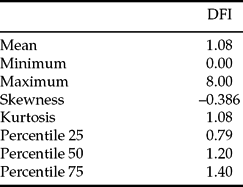
Percentiles are also given. Values are means (n = 63 719); DFI, DNA fragmentation index.
Frequency of distribution of spermatozoa in each dog with the low, medium or high percentage of fragmented DNA

a–d p < 0.05. Spermatozoa with a DFI lower that 0.79 were considered as low percentage, those between 0.79 and 1.20, were considered as medium and those with a DNA fragmentation index (DFI) over 1.20 were considered as spermatozoa showing high DFI. (n = 63 658). Comparisons were made within dogs for each category of DNA fragmentation.
Distribution of sperm αt subpopulations in each dog
Also there was a significant effect of the dog in the distribution of sperm subpopulations (Table 6), in dogs 1 and 4 subpopulation number 4 predominated (p < 0.001), while in dogs 2 and 3 subpopulation number 1 predominated (p < 0.001).
Effect of the ejaculate in the distribution of αt-derived sperm subpopulations
As occurred for morphometric sperm subpopulations, the ejaculate slightly influenced their distribution. However, once again, only subtle differences were observed among ejaculates from the same dog in the sperm subpopulations structure.
Relations among sperm morphometry and DNA integrity
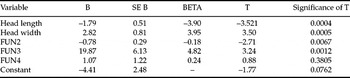
Two-stage least squares regression analysis revealed significant relations among different morphometric-derived variables and the amount of denatured DNA within each individual spermatozoon (Table 7). Head length, width and three derived sperm-shape functions (FUN 2, 3 and 4), were included in the formula obtained to predict the amount of denatured DNA within each spermatozoa. Using ROC curves the morphometric parameter FUN3 (Figure 2) was diagnostic of medium values of DNA fragmentation.
Distribution of spermatozoa (%) falling into each subpopulation derived from the SCSA analysis within each dog

Within a column, values with different superscripts are statistically different, a–dp < 0.05.
Variables in the equation obtained from a two-stage least squares regression analysis model for the prediction of the relationship between the percentage of denatured DNA within each individual spermatozoa (αt) and ASMA-derived morphometric variables

Predictive value of FUN3 ((L – W)/(L + W)), as a diagnostic test of normality in the amount of fragmented DNA.
Discussion
This study presents a relatively simple multivariate analysis statistical procedure, to identify morphometric sperm subpopulations in the canine ejaculate. Development of standardized protocols for analysis of sperm morphology has been considered a high priority for the investigation of human semen (ESHRE, Andrology Special Interest Group, 1998). The procedure used in our study gave relevant information on the characteristics of canine ejaculates. In our study, the ASMA system was successfully used to detect subtle morphometric differences among ejaculates from different dogs and even from the same dog the data obtained allowed us to detect sperm morphometric subpopulations within of each ejaculate. Although there are other studies (Rijsselaere et al., Reference Rijsselaere, Van Soom, Hoflack, Maes and de Kruif2004) on canine sperm morphometry, this is, to the authors’ knowledge, the first description of sperm morphometric subpopulations within the canine ejaculate. Also we disclosed, for the first time, the presence of sperm subpopulations with different amount of denatured DNA (αt) in the spermatozoa. Our findings may therefore have several new implications for the study of the ejaculate. First, the dog ejaculate, as human, presents a great degree of pleomorphism (Soler et al., Reference Soler, de Monserrat, Gutierrez, Nuñez, Sancho, Perez-Sánchez and Cooper2003), in contrast to other domestic species such as boars (Peña et al., Reference Peña, Saravia, García Herreros, Núñez Martínez, Tapia, Johanisson, Wallgren and Rodríguez Martínez2005) and bulls (Ostermeier et al., 2001). Especially in pleomorphic species, the multivariate approach to disclose sperm subpopulations, may greatly improve the evaluation of the ejaculates. It is noteworthy that if mean values of αt are considered, these values are very similar. However when subpopulations are considered, the percentage of spermatozoa within each cluster varies largely depending on the dog considered. This finding may have readily applicable practical implications.
The origin of sperm subpopulations, both morphometric and DNA integrity related, is not clear. Genetically derived variation on sperm, morphology has been demonstrated as the base for phenotypic differences observed between spermatozoa of different strains of mice (Burgyone, 1975). Studies in other animal species infer that is plausible that variation on sperm morphometry arises during spermatogenesis when genotypic effects influence sperm structure. Sperm morphology phenotype appears to be controlled by genes transcribed in the premeiotic phase of development (Beatty, Reference Beatty, Beatty and Gluecksson-Waelsch1972). Inbreeding coefficients have been related to poor ejaculate quality, further demonstrating the genetic control of sperm morphology (Roldan et al., Reference Roldan, Cassinello, Abaigar and Gomendio1998).
It is well known that the chromatin of mammalian spermatozoa differs markedly in composition and structure from somatic chromatin. The DNA in the spermatozoa is complexed with sperm specific basic proteins in a crystalline-like structure, being sixfold more compact than metaphase chromosomes. The predominant chromatin-associated protein is protamine P1, a 50 amino acid highly basic protein possessing an arginine-rich central domain (McLay & Clarke, Reference McLay and Clarke2003). It is generally assumed that since most of the sperm head is condensed DNA, nuclear shape may be related, mainly, to sperm chromatin. Studies (Hinst et al., Reference Hinst, Blottner and Franz1995, Karabinus et al., Reference Karabinus, Vogler, Saacke and Evenson1997) indicate that variation of sperm head morphology is a sensitive biomarker of abnormal chromatin structure and thus of fertility, and that the detection of subtle, yet significant, differences in sperm head morphology is only possible with the aid of ASMA instruments (Hirai et al., Reference Hirai, Boersma, Hoeflich, Wolf, Föll, Aumuller and Braum1997).
In this regard we found significant relationships among sperm-derived morphometric variables and the amount of denatured DNA within each individual cell. The distribution of morphometric sperm subpopulations was similar to that derived from the DNA integrity study. In this regard for example, in dog number 1 cluster number 3 predominated for morphometric distribution of subpopulations and cluster numnber 4 in the αT distribution. In the αT distribution of subpopulations this is a cluster of spermatozoa with a high proportion of denatured DNA. The morphometric cluster number 3, is characterized by short and wide sperm heads. Regression analysis revealed that high DNA denaturation is related to short and wide sperm heads, although the relationship was not so evident in all dogs. This may be related to the fact that some other factors may be related to sperm head shape. The acrosome, subacrosmal layer and manchette during spermiogenesis, or the perinuclear theca of the mature sperm head, may act as extrinsic determinants of sperm nuclear shaping (Dadoune Reference Dadoune2003, Mujica et al., Reference Mujica, Navarro García, Hernández González and Juarez-Mosqueda2003). Nevertheless, the possibility that sperm nuclear shape may also be defined intrinsically by edification of the DNA–nucleoprotein complex cannot be totally excluded. At present there is no available evidence for attribution of predominant role in any of this factors (Mujica et al., Reference Mujica, Navarro García, Hernández González and Juarez-Mosqueda2003), and the relationsip of sperm chromosomal abnormalities and sperm morphologic deformities has been clearly demonstrated (Lewis-Jones et al., Reference Lewis-Jones, Aziz, Seshadri, Douglas and Howard2003) and also a clear relationship between the sperm deformity index and oxidative stress-induced oxidative damage to the sperm DNA (Said et al., Reference Said, Aziz, Sharma, Lewis-Jones, Thomas and Agarwal2001). However, in our study mean DFIs were very low, ranging from 0 to 9%. Although the DFI in the dogs in our study was low, we were able to find a statistically significant area under the ROC curve, when we used FUN3 as diagnostic test. The fact the AUC is relatively low although significant may reflect the low DFI present in the dogs in our study. A recent work on feline epididymal sperm (Mota & Ramalho Santos, 2005) showed that head-staining abnormalities detected using the diff–quick staining method were strongly correlated with, and could accurately predict, sperm DNA defects detected in the same sample using the TUNEL assay.
Together with its relationship to sperm DNA, sperm head shape has been demonstrated to be related to other important facts in a number of species including humans (Aziz et al., Reference Aziz, Fear, Taylor and Kingsland Lewis-Jones1998), such as fertility (Hirai et al., Reference Hirai, Boersma, Hoeflich, Wolf, Föll, Aumuller and Braum1997) or the resistance to cryopreservation (Thurston et al., Reference Thurston, Watson, Mileham and Holt2001). The combined use of sperm head morphometry and DNA integrity evaluation can be considered a powerful tool to improve the spermiogram.
It is noteworthy that in contrast to humans objective criteria to standardize the morphological evaluation of the canine ejaculate have not been developed, thus the classification of a spermatozoon as normal or abnormal is still completely subjective. The combination of techniques evaluating simultaneously DNA integrity and computerized morphometric techniques can help to a rapid development of standardization of the canine spermatozoa. We propose that using our staining technique, spermatozoa belonging to morphometric cluster number 3 can be considered as the best quality spermatozoa. They are related to DNA integrity derived clusters, characterized by low levels of DNA fragmentation. Experiments are in progress in our laboratory to confirm this hypothesis.
The morphometric dimensions of the spermatozoa are slightly different in our experiments from the reports known to date (Dalhbom et al., Reference Dalhbom, Anderson, Vierula and Alanko1997, Rijselaere et al., 2004). Factors such as the magnification objective or the staining procedure may explain this fact. In the previous studies sperm head dimensions were similar, however they are smaller in our study. We used a ×100 objective and a longer staining time. Under our conditions, this gave better microscopic images, and clear boundaries of the sperm head. In the previous study by Rijeseleare et al. (2004) higher magnification objectives gave shorter measures of the sperm head. In addition, individual variations in the sperm head morphometry can also explain the differences observed. Finally, the main factor to explain these differences is the different statistical approach used, the other two experiments gave mean values using parametric statistics, while in our study we describe mean values for each sperm cluster. The statistical tool used in our study was shown to be very powerful, disclosing sperm subpopulations despite the relative low number of dogs used. However a number of recent studies (Rathi et al., Reference Rathi, Colenbrander, Bevers and Gadella2001, Quintero Moreno et al., 2003) suggest that studies using a relative low number of animals, if data are adequately processed can suggest very interesting proposals for the study of the mammalian ejaculate.
In conclusion a multivariate statistical technique has been developed in this study using data derived from the morphometric analysis and DNA integrity data. New information regarding the subpopulations structure of the canine ejaculate has been obtained, and this information can be used to objectively standardize the ejaculate in the canine species.
Acknowledgements
This work was supported by grant AGL 2004–01722 (GAN), CICYT–FEDER. Dr Núñez Martinez received a PhD Grant from Valhondo Calaaf Foundation Cáceres, Spain. Dr JM Moran received a postdoctoral grant from the Ministry of Education and Science in Spain.