


INTRODUCTION
Snow structures and physical properties in the surface layer of an ice sheet were investigated by the use of 30-m cores at four sites in Mizuho Plateau East Antarctica, aiming to evaluate the effect of temperature and accumulation rate on the densification process of polar snow. Mean annual air temperatures and accumulation rates were different at the siles: the former were -15.9°C at S18, -33.1°C at W’200, -38 5°C at U234 and -48.1 C at V142, and the latter were 210 kg/m1.a at SIS, 290 kg/m2-a at W’200, 190 kg/m2.a at U234 and 90 kg/m -a at V142. By measuring the densities of the four cores, Nishimura and others (1983) showed that the regional difference of compactive viscosity coefficient which was calculated from a relation between the density and pressure of overlying snow, was caused by the difference in mean annual temperature and accumulation rate. A convenient diagram was made from this result with which we could estimate the annual accumulation rate at any observation site from the depth of density 550 kg/m3 and the mean annual temperature.
Specific areas of internal free surfaces, degrees of orientation and air permeabilities were measured in relation to the development of depth hoars (Nishimura and Maeno 1984). They showed that depth hoars formed extensively in regions of smaller accumulation rates· the fact was explained by introducing a new index cumulative thermogradient, defined as an absolute temperature gradient multiplied by the staying period It was suggested that the accumulation rate was a very important factor in determining a characteristic structure of snow m polar regions. However, the relations between the structure and the physical properties have not yet been studied in detail.
In the present paper, the physical meaning of the relation between the specific area of internal free surfaces and the air permeability was studied by using the measuring results mentioned above.
AIR PERMEABILITY AND STRUCTURAL PARAMETERS
Densities ρ, specific areas of internal free surfaces Sf and air permeabilities k of snow cores at the four sites are plotted against depth in Figures 1 (S18) 2 (W’200), 3 (U234) and 4 (V142). In these figures, each value of ρ is the mean in 0.5 m-thickness, and St and k are running averages of three consecutive data for eliminating layer-to-layer fluctuations. The critical density of 550 kg/m3 is the point of change in slope of the density profile: the depths are 6.0 m at S18, 11.5 m at W’200, 12.5 m at U234 and 20.0 m at V142 (Nishimura and others 1983).
At S18 (Figure 1) which is located in the region with a larger accumulation rate and high mean annual temperature, both Sf and k decrease with increasing depth with kinks around the depth of 6 m. The decreasing rates at depths above the kinks are larger than those below. Values of Sf and k at W’200 (Figure 2) show similar kinks to S18 around 11.5 m. These kinks are considered to show the change of the densification mechanism of snow as already pointed out earlier (Nishimura and others 1983).


At U234 (Figure 3) and V142 (Figure 4) which are located in the regions with lower mean annual temperatures and smaller accumulation rates, the depth profiles of Sf, and k also seem to show kinks around the depths of the critical density, but the kinks are not so clear as S18 and W’200; the reason is considered to be related with the variation of snow structure by vertical vapour transport, which was already discussed by Nishimura and Maeno (1984).
DISCUSSION
The measurements of Sf and k showed kinks around a depth of the critical density 550 kg/m3 at which the densification mechanism was considered to change. A similar kink for Sf was found in the seasonal snow and polar firn (Narita 1971) and for k in a Mizuho core (Maeno and others 1978).

The decrease in Sf is considered to be caused by rounding of ice particles to reduce the surface-free energy of a system, and also by the growth of ice bondings and of particles. In the initial densification above the critical depth, bonds between particles do not grow significantly (Maeno and others 1978); the decrease seems to be caused mainly by the rounding and the growth of ice particles, which also give rise to the rapid mechanical packing. Below the critical depth, the development of ice bonding may be the main reason of decrease in Sr
The packing of ice particles during densification is accompanied by narrowing and splitting or blocking of air channels which causes the decrease in k. We examine now the processes by using a relation between Sf and k, which will be useful to obtain the physical picture about the change of structure in the surface layer.
According to a general equation for flow through a randomly packed powder material which consists of irregularly shaped particles with uniform size, the air permeability for smaller Reynolds numbers than 20 is expressed as (Ergun 1952):

>where φ is the sphericity of the particle, defined as the surface area of a sphere with the same volume divided by that of the actual particle. Consequently, φ = 1 for sphere and 0 < φ < 1 for the other shaped particles, d is the diameter of a sphere having the same volume as that of the particle. P is the porosity which is defined as P = 1-(ρ/ρ¡) where ρ and ρ¡ are densities of snow and ice, respectively, μ is the viscosity of air which is 1.67 x Lo-6-s/m2 at -10°C. The specific area of internal free surfaces for the powders is related to the sphericity and diameter as:
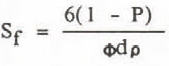
This relation shows that Sf decreases with rounding or growing of particles. Using Equations 1 and 2, the relation among k, Sf and ρ is expressed as:


Permeabilities at densities 450, 500, 550, 600 and 650 kg/m3 measured for the four cores are plotted against Sr, in Figure 5, together with those calculated using equation 3 by smoothed lines. The values of k and Sf decrease with increasing density; k decreases with increasing Sf at each density. The dependence of k on Sf and p is similarly shown in the calculated curves. It should be noted, however, that the calculated k fits the measured k only at the density 450 kg/ms. At larger densities, the difference between the measured and calculated values is considerable and seems to increase with increasing density or decreasing porosity.
During densification, ice particles tend to become large, round and packed in touch with each other; this process causes not only narrowing but splitting and blocking of air channels. Thus Sr, and k decrease with increasing density. But equation 3 includes no consideration of the splitting and blocking of air channels. This is considered to be the main reason that the measured values of k are smaller than those calculated at higher densities.
The regional difference is found in the plots of Figure 5; at a given density, snow in a region with a lower accumulation rate has larger k and smaller Sp which was already mentioned in Nishimura and Maeno (1984); this difference decreases significantly in the densities larger than the critical density, 550 kg/m3. At a given Sf, the differences between measured and calculated k at densities 500 kg/m3 and 550 kg/m3 are smaller in regions with lower accumulation rate.
In a region with a smaller accumulation rate, deposited snow is subjected to a vertical temperature gradient for a longer period, causing to develop a vertically elongated structure by the vapour transport (Nishimura and Maeno 1984). This development promotes the change of particles to simpler shapes and also the growth of the particles, both of which cause to decrease Sf and increase k. The development of the vertical structure is also accompanied by straightening and widening of air channels which also increase k.
CONCLUSIONS
The analyses of strcutures and physical properties of 30-m snow-cores at the four sites in Mizuho Plateau have revealed that the initial densification in the surface layer depends strongly on temperature and accumulation rate; the differences of the density-depth relations among the four sites could be explained by a physical dependence of the densification by refering to compactive viscosity coefficient. In addition to the dependence, the vertical vapour transport caused by temperature gradient produces a great variation of snow structure. The development of depth hoar due to the vertical vapour transport depends not only on the temperature gradient but on the staying period near the surface; thus the accumulation rate is one of the important factors in determining the structure, physical property and densification process of snow in polar regions.
ACKNOWLEDGEMENTS
This work was partly supported by the Grant-in-Aid for Cooperative Research and Scientific Research of the Ministry of Education, Science and Culture, Japan, and National Institute of Polar Research. The authors thank Dr H Narita of the Institute of Low Temperature Science, Hokkaido University, who kindly allowed them to use the permeameter.



