





Introduction
Supply chain shocks and shortages of drugs or medical supplies have substantially affected healthcare delivery and patient outcomes, particularly during COVID-19 and recent weather-related manufacturing disruptions. Reference Pandey, Cohn and Nampoothiri1–Reference Weber, Malani and Shenoy7 In June 2024, a national shortage of BACTEC™ blood culture bottles manufactured by Becton Dickinson 8 prompted conservation guidance from Centers for Disease Control and Prevention (CDC), 9 aligning with ongoing blood culture diagnostic stewardship efforts. Reference Sullivan10–Reference Ryder, Van Schooneveld, Diekema and Fabre16 Hospitals implemented various measures, including stewardship education, Reference Ezran, Herrle, Yen, Mercuro, Diekema and Gordon17–Reference Shelly, Kunz, Mittal, Corwin, Chapman and Ender22 clinical decision support tools, Reference Humphries, Banerjee and Dupont19,Reference Cohen Yatziv, Mena Lora, Gross, Adams, Ismail and Borgetti21–Reference Butt, Kressel and Haines25 and blood culture ordering restrictions, Reference Humphries, Wright and Banerjee18,Reference Humphries, Banerjee and Dupont19,Reference Itoh, Akazawa-Kai, Okumura, Kuriki, Wachino and Kawabata26–Reference Lei, Alkozah and Wilson Dib30 with reports of decreased culture usage. Reference Ezran, Herrle, Yen, Mercuro, Diekema and Gordon17–Reference Lutgring, Maillis and Bryant28
However, the specific approach adopted by some hospitals to restrict to 1 blood culture set per patient Reference Humphries, Wright and Banerjee18,Reference Humphries, Banerjee and Dupont19,Reference Itoh, Akazawa-Kai, Okumura, Kuriki, Wachino and Kawabata26 conflicted with guidance from the Infectious Diseases Society of America and the American Society for Microbiology to collect 2–3 sets for suspected bloodstream infections to maximize sensitivity, adjudicate possible contaminants, and facilitate discontinuation of unnecessary antimicrobials. Reference Miller, Binnicker and Campbell31 Some hospitals reported lower culture positivity during the shortage, Reference Itoh, Akazawa-Kai, Okumura, Kuriki, Wachino and Kawabata26,Reference Lutgring, Maillis and Bryant28 suggesting underdiagnosis. Reference Itoh, Akazawa-Kai, Okumura, Kuriki, Wachino and Kawabata26
At our institution, due to imminent complete supply depletion on the order of days, an electronic health record (EHR) order restriction of 1 blood culture set per patient every 24 hours began June 26, 2024 and ended December 23, 2024, after sufficient blood culture bottle supplies were secured. While necessary due to the critical shortage, we hypothesized that the restriction may have impacted patient outcomes and tested this hypothesis in an interrupted time series analysis.
Methods
Study setting
We studied 2 hospitals within a large, urban academic health system in Philadelphia, Pennsylvania: the Hospital of the University of Pennsylvania (HUP) and Penn Presbyterian Medical Center (PPMC), which have 1,069 and 347 beds, respectively.
Data source, exposure, and defined time periods
We extracted institutional data from Epic Clarity (Epic Systems, Veronia, Wisconsin) and TheraDoc® (Premier, Inc., Charlotte, North Carolina) for hospital encounters and blood cultures, respectively, from June 26, 2023 to June 25, 2025. We divided these into the prerestriction (June 26, 2023–June 25, 2024), restriction (June 26, 2024–December 23, 2024), and postrestriction (December 24, 2024–June 25, 2025) periods. During pre and postrestriction, clinicians had no blood culture order limits, whereas during restriction, an EHR hard stop limited orders to 1 set (comprised of two bottles, aerobic and anaerobic) per patient every 24 hours (<10 exceptions granted by the Clinical Microbiology Laboratory). Clinicians were notified by email the day before, with a daily EHR reminder for the first 3 months of the restriction period. Additionally, educational efforts on best practices for sterile collection and appropriate fill volumes intensified with a tip sheet periodically provided during and after the restriction. Upon restriction withdrawal on December 23, 2024, a new blood culture order panel simultaneously took effect to facilitate appropriate ordering (see Supplementary Methods 1). Reference Fabre, Klein and Salinas11,Reference Fabre, Sharara, Salinas, Carroll, Desai and Cosgrove32 We assigned any encounters spanning cutoff dates based on majority hospitalization time.
We followed the Strengthening the Reporting of Observational Studies in Epidemiology reporting guideline. Reference von Elm, Altman, Egger, Pocock, Gøtzsche and Vandenbroucke33 The University of Pennsylvania Institutional Review Board deemed the study exempt.
Population and outcomes
Inpatient hospitalizations were the unit of analysis and were aggregated into 1-week intervals. Baseline data included patient sociodemographic characteristics (sex, age, race, and ethnicity), Elixhauser Comorbidity Index based on International Classification of Diseases, 10th Edition codes at hospitalization, Reference Elixhauser, Steiner, Harris and Coffey34,Reference Gasparini35 insurance coverage, and hospital.
We evaluated overall culture positivity as a common systemwide metric reflecting the Microbiology Laboratory’s yield under supply constraints: the total number of positive blood culture sets, including possible contaminants, divided by total number of culture sets obtained for the entire health system or hospital, including all hospital encounters. We assessed all other outcomes on a per hospitalization basis, focusing on all hospitalizations as well as its two subgroups: hospitalizations with ≥1 blood culture obtained (≥1-BC hospitalizations) and hospitalizations without blood cultures. Primary outcomes included all-cause in-hospital mortality or hospice discharge; number of revisits within 30 days of discharge, including inpatient admissions, medical observation admissons, and emergency department (ED) revisits; and length of stay (LOS).
Secondary outcomes included blood culture metrics. For all hospitalizations, we determined whether ≥1 culture (regardless of positivity) was obtained at any point during hospitalization. For ≥1-BC hospitalizations, we measured whether there was ≥1 positive culture; total number of cultures and positive cultures obtained; number of calendar days with ≥1 culture or positive culture obtained; and time from admission to first culture obtained. For all hospitalization groups, we also examined antimicrobial use outcomes (any systemic antimicrobials that could be used for bloodstream infections; see Supplementary Methods 2): whether ≥1 antimicrobial was administered at any point; number of days of antimicrobial therapy; and time from admission to first antimicrobial administered.
Statistical analysis
Descriptive statistics were used to report baseline sociodemographic and clinical characteristics. We used χ 2 and Wilcoxon rank-sum tests to compare blood culture metrics pre and postrestriction. Across the entire study period, we used interrupted time series analysis to assess slope and level changes before and after the cutoff dates of June 26 and December 23, 2024, fitting segmented logistic and Poisson regression for binary and count/continuous outcomes, respectively. We employed Newey-West robust standard errors, Reference Newey and West36 with a lag after each change point and maximum lag length guided by the Cumby-Huizinga test. Reference Cumby and Huizinga37 We repeated analyses for each hospital, employed 2-sided hypothesis tests with α = 0.05, and conducted all analyses using R version 4.3.0 (R Foundation for Statistical Computing, Vienna, Austria). 38
Sensitivity analyses
Although restriction implementation and withdrawal were immediate, some outcomes could have lagged. Therefore, we repeated analyses with 1- and 2-week washout periods before and after cutoff dates. Additionally, because hospitalizations spanning cutoff dates have inherent ambiguity regarding restriction exposure, we repeated analyses excluding these hospitalizations.
Results
Study population
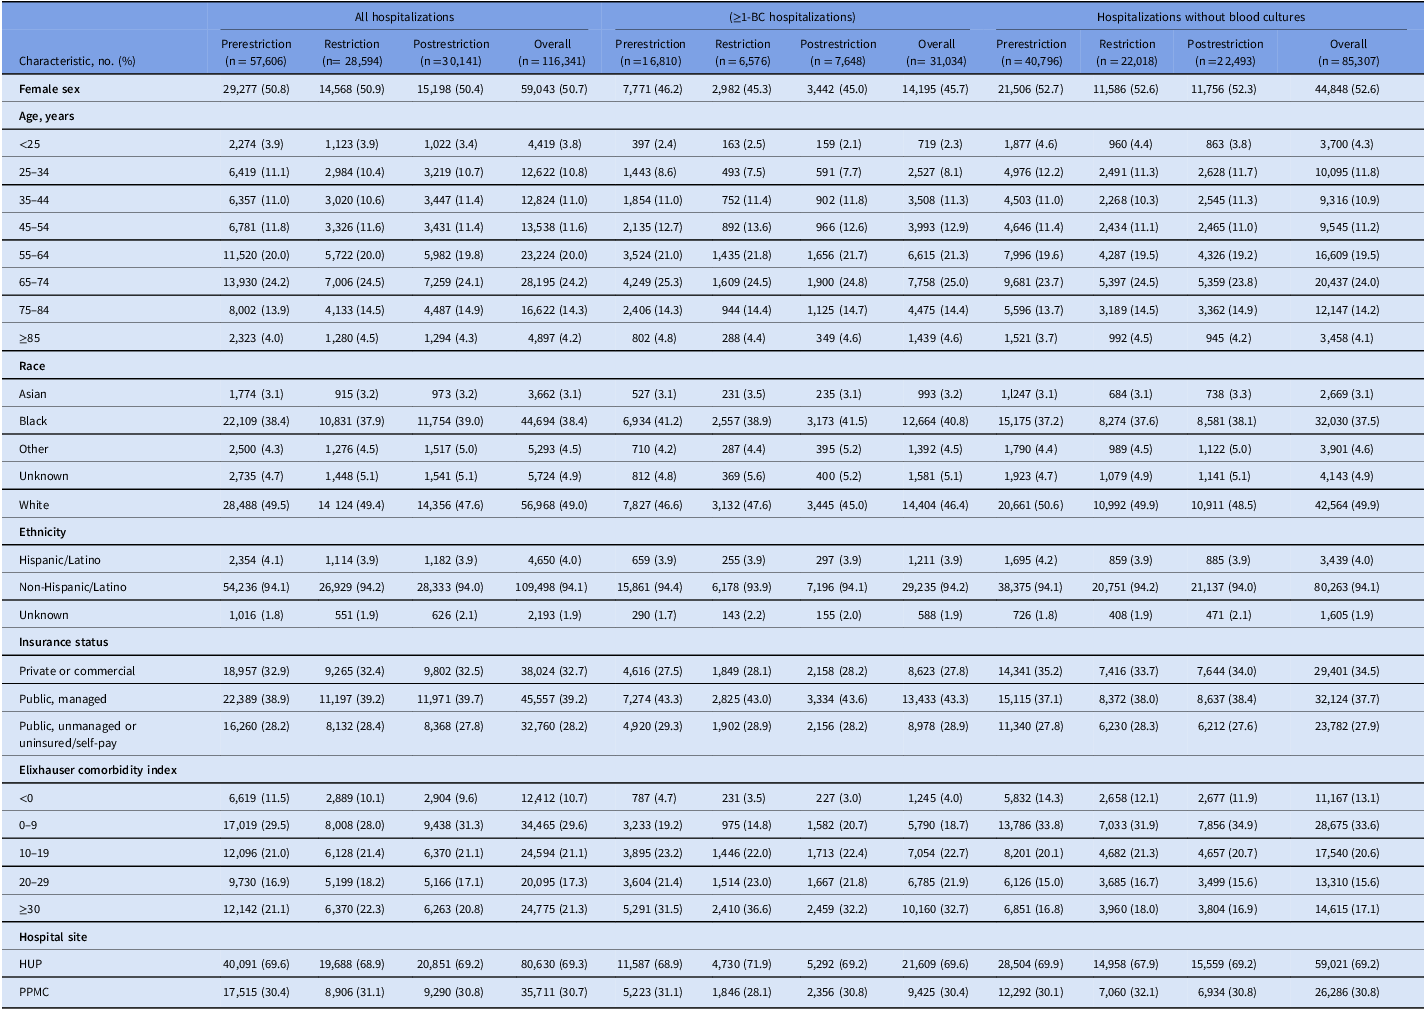
We identified 116,341 hospitalizations, 31,034 ≥1-BC hospitalizations, and 85,307 hospitalizations without blood cultures during the study period. Baseline characteristics were similar across periods, both overall (Table 1) and by hospital (Supplementary Tables 1 and 2).
Sociodemographic and clinical characteristics of patients hospitalized at both hospital sites aggregated by time period

Table 1. Long description
The table presents sociodemographic and clinical characteristics of patients hospitalized at both hospital sites aggregated by time period. It includes data on all hospitalizations, hospitalizations with blood cultures, and hospitalizations without blood cultures. The table has 11 columns and 20 rows, including headers and row labels. The columns are labeled as follows: Characteristic, All hospitalizations (Prerestriction, Restriction, Postrestriction, Overall), ≥1-BC hospitalizations (Prerestriction, Restriction, Postrestriction, Overall), and Hospitalizations without blood cultures (Prerestriction, Restriction, Postrestriction, Overall). The rows include characteristics such as female sex, age groups, race, ethnicity, insurance status, Elixhauser comorbidity index, and hospital site. Each cell contains the percentage of patients fitting the respective characteristic. The table provides a comprehensive overview of the patient demographics and clinical characteristics across different time periods and hospitalization types.
HUP, Hospital of the University of Pennsylvania; PPMC, Penn Presbyterian Medical Center.
The prerestriction period was June 26, 2023 to June 25, 2024; the restriction period was June 26, 2024 to December 23, 2024; and the postrestriction period was December 24, 2024 to June 25, 2025. All data shown are the number of hospitalizations having the indicated characteristic, with percentage in parentheses reflecting this as the numerator and the size of the overall group as the denominator (shown in the headings).
Primary outcomes
In analyses that aggregated data for each period, among all hospitalizations, in-hospital mortality or hospice discharge declined from 3.5% prerestriction to 2.7% afterward (Supplementary Table 3) with similar hospital-specific trends (Supplementary Tables 4 and 5).
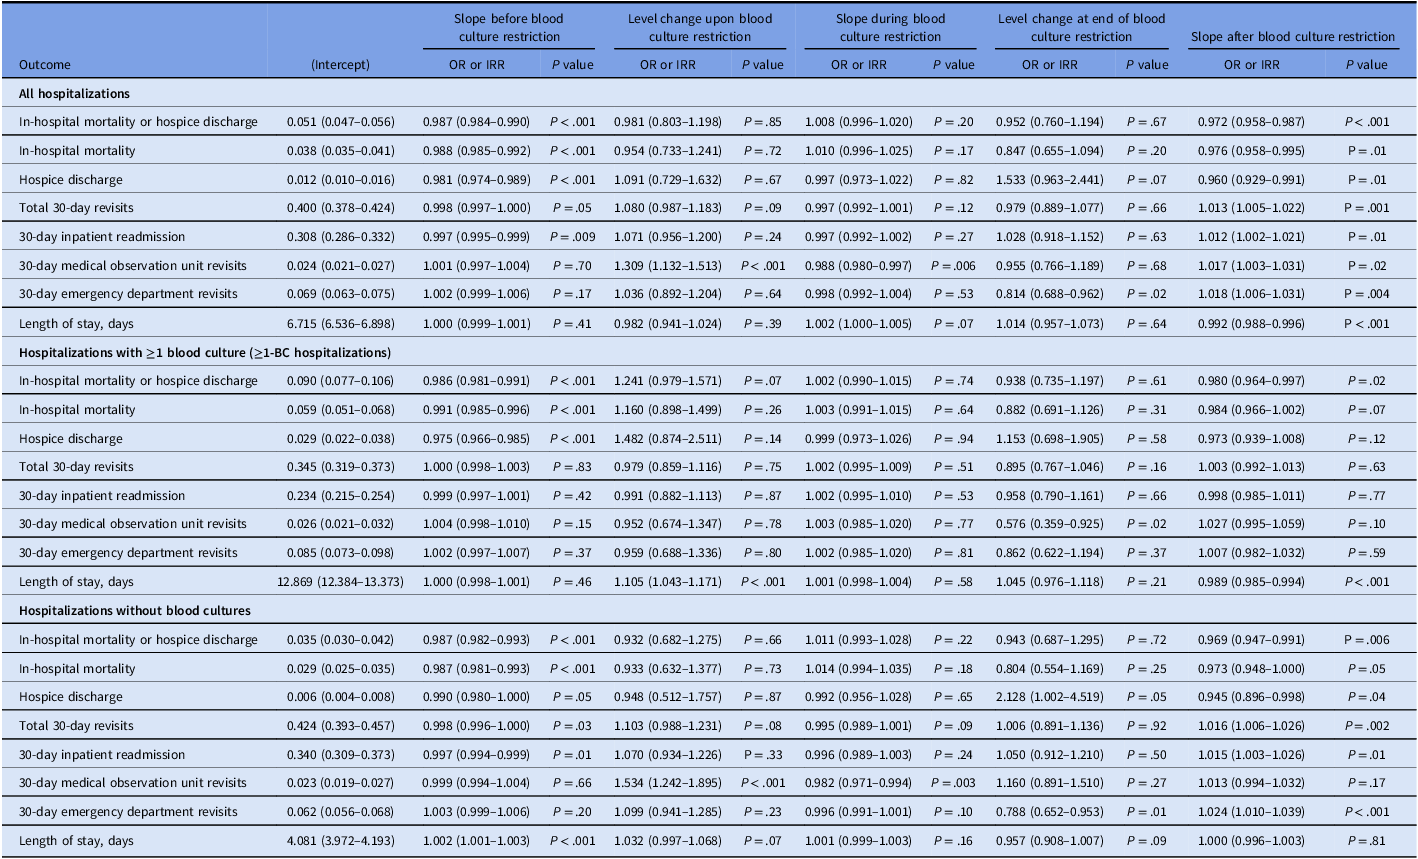
In the primary interrupted time series analyses, across all hospitalizations, in-hospital mortality or hospice discharge declined (Figure 1A and Table 2) at −1.3% per week prerestriction (P < .001) (Supplementary Table 6). During restriction, in-hospital mortality or hospice discharge flattened without significant change, then decreased again at −2.8% per week postrestriction (P < .001). Patterns were similar for in-hospital mortality and hospice discharge individually, as well as for ≥1-BC hospitalizations (Figure 1B, Table 2, and Supplementary Table 7) and hospitalizations without blood cultures (Figure 1C, Table 2 and Supplementary Table 8). Trends were similar when evaluating hospitals individually (Supplementary Figures 1A–C and 2A–C and Supplementary Tables 10 and 11), though with greater weekly variability.
Interrupted time series of primary outcomes at both hospital sites combined. Blue dots represent weekly averages and the red solid line represents the fitted line from the segmented regression model assessing for abrupt level and slope changes at the start and stop dates of the blood culture restriction of 1 blood culture set per patient per 24 hours, which were June 26, 2024 and December 23, 2024, respectively, represented by dashed vertical lines. “≥1-BC hospitalizations” designates the hospitalizations with ≥1 blood culture obtained subgroup of all hospitalizations. Y-axes were individually customized to optimize the balance between visualization of trends and comparisons with other subgroups. The figure displays the following: (A) Percentage of inpatient mortality or hospice discharge for all hospitalizations. (B) Percentage of inpatient mortality or hospice discharge for ≥1-BC hospitalizations. (C) Percentage of inpatient mortality or hospice discharge for hospitalizations without blood cultures. (D) Mean number of total 30-day revisits for all hospitalizations. (E) Mean number of total 30-day revisits for ≥1-BC hospitalizations. (F) Mean number of total 30-day revisits for hospitalizations without blood cultures. (G) Mean length of stay for all hospitalizations. (H) Mean length of stay for ≥1-BC hospitalizations. (I) Mean length of stay for hospitalizations without blood cultures.

Effect estimates of blood culture restriction on primary outcomes for hospitalizations at both hospital sites combined

Table 2. Long description
The table presents the effect estimates of blood culture restriction on various outcomes for hospitalizations. It includes data on all hospitalizations, hospitalizations with ≥1 blood culture, and hospitalizations without blood cultures. The table is divided into several rows and columns, with column headers such as Slope before blood culture restriction, Level change upon blood culture restriction, Slope during blood culture restriction, Level change at end of blood culture restriction, and Slope after blood culture restriction. Each row represents a different outcome, such as in-hospital mortality or hospice discharge, hospice discharge, total 30-day revisits, 30-day inpatient readmission, 30-day medical observation unit revisits, 30-day emergency department revisits, and length of stay. The table provides odds ratios (OR) or incidence rate ratios (IRR) along with P-values for each outcome and time period. For example, the row for in-hospital mortality or hospice discharge shows OR and P-values for the slope before, during, and after blood culture restriction, as well as the level change upon and at the end of restriction. The table also includes similar data for in-hospital mortality, hospice discharge, and other outcomes. The data is presented for all hospitalizations, hospitalizations with ≥1 blood culture, and hospitalizations without blood cultures, providing a comprehensive view of the effects of blood culture restriction on various hospital outcomes.
OR, odds ratio; IRR, incidence rate ratio.
The prerestriction period was June 26, 2023 to June 25, 2024; the restriction period was June 26, 2024 to December 23, 2024; and the postrestriction period was December 24, 2024 to June 25, 2025. The total 30-day readmission outcome is comprised of all readmissions, including inpatient readmissions, medical observation unit revisits, and emergency department revisits. Effect estimates for in-hospital mortality or hospice discharge were odds ratios as this was a binary outcome. Effect estimates for all other outcomes included here were incidence rate ratios as they were count or continuous data.
Thirty-day revisits did not change significantly throughout the study period except for a postrestriction increase of +1.3% per week (P = .001), driven largely by hospitalizations without blood cultures (Figure 1D–F and Supplementary Tables 6–8) and PPMC (Supplementary Figure 2D–F and Supplementary Table 11) where it was +1.6% per week (P = .002) and +3.4% per week (P = .003), respectively. LOS showed no sustained increase during the restriction period among all hospitalizations, but decreased postrestriction at −0.8% per week (P < .001, Figure 1G, Table 2, and Supplementary Table 6); among ≥1-BC hospitalizations, there was also a level increase of +10.5% (P < .001) upon restriction onset (Figure 1H, Table 2, and Supplementary Table 7), and among hospitalizations without blood cultures, there was an increase of +0.2% per week (P < .001) in the prerestriction period (Figure 1I, Table 2, and Supplementary Table 8). Trends for LOS were similar when evaluating hospitals individually (Supplementary Figures 1G–I and 2G–I and Supplementary Tables 10 and 11).
Secondary blood culture outcomes
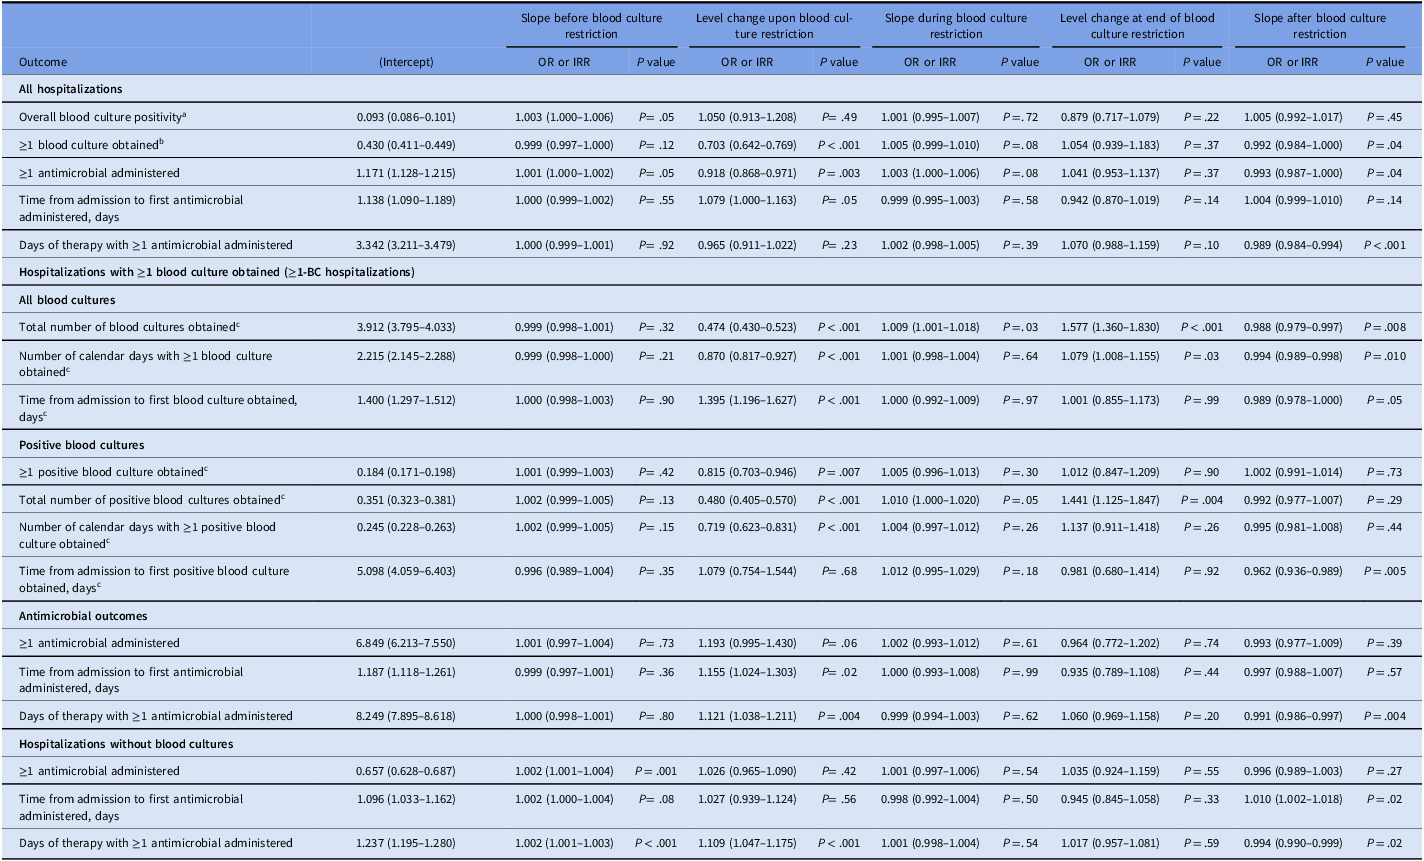
The proportion of hospitalizations with ≥1 blood culture fell from 29.2% prerestriction to 23.0% during restriction before increasing to 25.4% postrestriction. In segmented models, the proportion of hospitalizations with ≥1 blood culture decreased −29.7% upon restriction onset (P < .001), increased at +0.5% per week during restriction (P = .08), and decreased at −0.8% per week postrestriction (P = .04, Figure 2B, Table 3, and Supplementary Table 6).
Interrupted time series of secondary blood culture outcomes at both hospital sites combined. Blue dots represent weekly averages and the red solid line represents the fitted line from the segmented regression model assessing for abrupt level and slope changes at the start and stop dates of the blood culture restriction of 1 blood culture set per patient per 24 hours, which were June 26, 2024 and December 23, 2024, respectively, represented by dashed vertical lines. “≥1-BC hospitalizations” designates the hospitalizations with ≥1 blood culture obtained subgroup of all hospitalizations. Y-axes were individually customized to optimize the balance between visualization of trends and comparisons with other subgroups. The figure displays the following: (A) Percentage of overall blood culture positivity across both hospital sites combined. (B) Percentage of hospitalizations with ≥1 blood culture obtained for all hospitalizations. (C) Mean number of blood cultures obtained for ≥1-BC hospitalizations. (D) Mean number of days with ≥1 blood culture obtained for ≥1-BC hospitalizations. (E) Mean length of time from admission to the first blood culture obtained for ≥1-BC hospitalizations. (F) Percentage of hospitalizations with ≥1 positive blood culture obtained for ≥1-BC hospitalizations. (G) Mean number of positive blood cultures obtained for ≥1-BC hospitalizations. (H) Mean number of days with ≥1 positive blood culture obtained for ≥1-BC hospitalizations. (I) Mean length of time from admission to the first positive blood culture obtained for ≥1-BC hospitalizations.

Effect estimates of blood culture restriction on secondary outcomes for hospitalizations at both hospital sites combined

Table 3. Long description
The table presents the effect estimates of blood culture restriction on secondary outcomes for hospitalizations at both hospital sites combined. It includes various outcomes and their respective odds ratios (OR) or incidence rate ratios (IRR) and P values across different periods: before blood culture restriction, upon blood culture restriction, during blood culture restriction, at the end of blood culture restriction, and after blood culture restriction. The table is divided into sections for all hospitalizations, hospitalizations with ≥1 blood culture obtained, and hospitalizations without blood cultures. The hospitalizations with ≥1 blood culture obtained section is further subdivded into all blood cultures, positive blood cultures, and antimicrobial outcomes. Each section lists specific outcomes with their corresponding OR or IRR and P values for different periods. Notable trends include significant changes in the proportion of hospitalizations with 1 blood culture upon restriction onset and during the restriction period.
OR, odds ratio; IRR, incidence rate ratio.
The prerestriction period was June 26, 2023 to June 25, 2024; the restriction period was June 26, 2024 to December 23, 2024; and the postrestriction period was December 24, 2024 to June 25, 2025. Effects estimates for binary outcomes (≥1 blood culture obtained, ≥1 positive blood culture obtained, ≥1 antimicrobial administered, ≥1 broad-spectrum antimicrobial administered, and ≥1 non-broad-spectrum antimicrobial administered) were odds ratios. Effect estimates for count and continuous outcomes (total numbers of blood cultures and positive blood cultures obtained, number of calendar days with ≥1 blood culture or ≥1 positive blood culture obtained, time from admission to first blood culture obtained, time from admission to first antimicrobial administered including broad and non-broad-spectrum, and days of therapy with ≥1 antimicrobial administered including broad and non-broad-spectrum) were incidence rate ratios. Of note, hospitalizations without blood cultures has only antimicrobial and clinical outcomes, lacking any blood culture outcomes by definition.
a Effect estimates for the overall culture positivity rate reflect both hospital sites in the aggregate rather than averaged measures for individual hospitalizations, and thus are not shown for the hospitalizations with ≥1 blood culture obtained subgroup (≥1-BC hospitalizations).
b Effect estimates were not calculated for ≥1-BC hospitalizations as this subgroup had ≥1 blood culture obtained by definition.
c Effect estimates were only calculated for ≥1-BC hospitalizations.
Overall culture positivity, a per-culture systemwide metric including possible contaminants, increased from 9.6% prerestriction to 11.2% during restriction and decreased to 10.2% postrestriction (Supplementary Table 3). In segmented models, overall culture positivity did not show any sustained significant shift (Figure 2A, Table 3, and Supplementary Table 6).
By contrast, patient-level positive culture metrics among ≥1-BC hospitalizations showed several shifts. The mean number of cultures per hospitalization per week decreased −52.6% upon restriction onset (P < .001), increased at +0.9% per week during restriction (P = .03) and +57.7% upon postrestriction onset (P < .001), and finally decreased at −1.2% per week postrestriction (P = .008, Figure 2C, Table 3, and Supplementary Table 7). Trends were similar for mean number of hospital days with ≥1 blood culture, proportion of hospitalizations with ≥1 positive blood culture, mean number of positive blood cultures, and mean number of hospital days with ≥1 positive blood culture obtained (Figure 2D and 2F–H, Table 3, and Supplementary Table 7). Mean length of time from admission to first blood culture obtained increased +39.5% upon restriction onset (P < .001), then decreased at −1.1% per week postrestriction (P = .05), though this did not reach statistical significance (Figure 2E, Table 3, and Supplementary Table 7); mean length of time to first positive culture, a downstream outcome of time to first culture, had a similar postrestriction trend (Figure 2I, Table 3, and Supplementary Table 7). Individual hospitals followed similar trends with varying significance (Supplementary Figures 3 and 4 and Supplementary Tables 10 and 11).
To determine whether any restriction-associated changes in blood culture utilization endured postrestriction, we compared aggregate outcomes between the pre and postrestriction periods (Supplementary Table 12). Blood culture positivity remained increased (9.6% prerestriction versus 10.2% postrestriction, P = .004) and the proportion of hospitalizations with ≥1 blood culture remained decreased (29.2% versus 25.4%, P < .001). Time from admission to first blood culture collection, whether any culture or first positive culture, also remained increased (P < .001). Notably, other metrics reflecting number of cultures overall were statistically significantly decreased in the postrestriction period, but this was not the case for analogous outcomes for positive cultures.
Secondary antimicrobial outcomes
Antimicrobial outcomes showed several discrete level and slope changes, particularly among ≥1-BC hospitalizations. The proportion of hospitalizations with ≥1 antimicrobial administered slightly but significantly increased at +0.1% per week prerestriction (P = .03), decreased −8.4% upon restriction onset (P = .003), and decreased −0.7% per week postrestriction (P = .04) (Figure 3A, Table 3, and Supplementary Table 6). Among ≥1-BC hospitalizations, there was a +22.5% increase (P = .04) upon restriction onset (Figure 3B, Table 3, and Supplementary Table 7), while among all hospitalizations without blood cultures, there was an increase of +0.2% per week (P < .001) in the prerestriction period (Figure 3C, Table 3, and Supplementary Table 8). Mean length of time from admission to first antimicrobial administered increased +7.9% (P = .05) and +15.5% (P = .02) in all hospitalizations (Figure 3D, Table 3, and Supplementary Table 6) and ≥1-BC hospitalizations (Figure 3E, Table 3, and Supplementary Table 7), respectively; we did not observe this increase in hospitalizations without blood cultures, but did observe a +1.0% increase per week (P = .02) in the postrestriction period (Figure 3F, Table 3, and Supplementary Table 8). The mean number of days of antimicrobial therapy had level increases of +12.1% (P = .004) and +10.9% (P < .001) upon restriction onset in ≥1-BC hospitalizations and hospitalizations without blood cultures, respectively (Figure 3H and 3I, Table 3, Supplementary Tables 7 and 8), with a decrease in the postrestriction period in all groups (Figure 3G–I, Table 3, and Supplementary Tables 6–8). For outcomes described above, trends were similar to varying degrees of significance when evaluating broad-spectrum and non-broad-spectrum agents separately (Supplementary Figure 5 and Supplementary Table 9) and when evaluating HUP and PPMC individually (Supplementary Figures 6 and 7 and Supplementary Tables 10 and 11).
Interrupted time series of selected secondary antimicrobial outcomes at both hospital sites combined. Blue dots represent weekly averages and the red solid line represents the fitted line from the segmented regression model assessing for abrupt level and slope changes at the start and stop dates of the blood culture restriction of 1 blood culture set per patient per 24 hours, which were June 26, 2024 and December 23, 2024, respectively, represented by dashed vertical lines. “≥1-BC hospitalizations” designates the hospitalizations with ≥1 blood culture obtained subgroup of all hospitalizations. Y-axes were individually customized to optimize the balance between visualization of trends and comparisons with other subgroups. The figure displays the following: (A) Percentage of hospitalizations with ≥1 antimicrobial administered for all hospitalizations. (B) Percentage of hospitalizations with ≥1 antimicrobial administered for ≥1-BC hospitalizations. (C) Percentage of hospitalizations with ≥1 antimicrobial administered for hospitalizations without blood cultures. (D) Mean length of time from admission to first antimicrobial administered for all hospitalizations. (E) Mean length of time from admission to first antimicrobial administered for ≥1-BC hospitalizations. (F) Mean length of time from admission to first antimicrobial administered for hospitalizations without blood cultures. (G) Mean number of days of antimicrobial therapy for all hospitalizations. (H) Mean number of days of antimicrobial therapy for ≥1-BC hospitalizations. (I) Mean number of days of antimicrobial therapy for hospitalizations without blood cultures.

Sensitivity analyses
Excluding hospitalizations during 1- and 2-week washout periods, we observed similar trends as in the main analysis with minimal change in effect estimates (Supplementary Tables 13 and 14). We also observed similar trends when excluding hospitalizations with admission and discharge dates overlapping cutoff dates (Supplementary Figures 9–10 and Supplementary Table 15). However, we observed a truncation effect at cutoff dates, likely due to selection bias affecting effect estimates, particularly for count or continuous outcomes. For example, LOS had significant changes associated with the restriction period in the sensitivity analysis (Supplementary Figure 10G–I and Supplementary Table 15) not seen in the main analysis (Figure 1G–I and Table 2).
Discussion
The near-universal single-set blood culture restriction was associated with immediate decreases in blood culture use and longer time from admission to first culture collection. These changes likely reflect clinician adaptation to a strict ordering constraint but may also reflect broader workflow disruptions during the shortage. We also observed delayed antimicrobial initiation among all hospitalizations and ≥1-BC hospitalizations, along with shifts in antimicrobial exposure. In-hospital mortality or hospice discharge had been declining before the restriction—consistent with nationwide trends starting in late 2021 of mortality rates returning to levels predating the COVID-19 pandemic Reference DeRienzo, Levine, Jain and Harris39,Reference Minhas, Fudim, Michos and Abramov40 —then flattened during the restriction and resumed declining afterward. These mortality patterns were temporally associated with the restriction period but should not be interpreted as necessarily causal, particularly because similar trends were observed among hospitalizations without blood culture. Broader system-level effects, residual confounding, or unmeasured secular trends may also have contributed. Additionally, other temporal factors, e.g., seasonality and year quarter, have known associations with in-hospital mortality, which our study could not fully capture. Reference Parks, Bennett, Foreman, Toumi and Ezzati41,Reference Sato, Hasegawa and Dugar42
Many blood culture metrics returned to prerestriction baseline levels in the postrestriction period, but not all. For example, the proportion of hospitalizations with ≥1 blood culture obtained started at 30.1% prerestriction and ended at 24.2% by end of the study period (calculated using effect estimates). Notably, blood culture positivity remained increased and metrics reflecting overall blood culture usage remained decreased in the postrestriction period, but analogous metrics for positive cultures were not significantly different pre and postrestriction. The incomplete return to baseline may have been due to residual effects of the restriction and the new blood culture order panel that simultaneously came into effect with restriction withdrawal. That in-hospital mortality or hospice discharge continued to decline even with fewer blood cultures being ordered than during prerestriction suggests that it is possible to lessen blood culture ordering through diagnostic stewardship interventions without worsening certain patient outcomes.
Other hospitals have reported various responses to the shortage. Several reported use of some combination of educational efforts, EHR order-set changes, and clinical decision-support tools, generally observing decreased culture use without apparent harm Reference Ezran, Herrle, Yen, Mercuro, Diekema and Gordon17–Reference Butt, Kressel and Haines25 though with one reporting decreased culture positivity, raising concern for possible bloodstream infection underdiagnosis (albeit without patient outcomes explicitly assessed). Reference Itoh, Akazawa-Kai, Okumura, Kuriki, Wachino and Kawabata26 Some centers also used single-set blood culture restrictions to a more limited degree with exceptions, e.g., neutropenia, Reference Humphries, Wright and Banerjee18,Reference Hanai, Shintani, Higashimoto, Uehara and Doi27 or only evaluated for certain conditions or populations such as febrile neutropenia, Reference Lei, Alkozah and Wilson Dib30 Staphylococcus aureus bacteremia, Reference Humphries, Banerjee and Dupont19 or ED patients Reference Takkavatakarn, Patel and Oh23 ; two centers reported no change in sepsis-related mortality rates. Reference Cohen Yatziv, Mena Lora, Gross, Adams, Ismail and Borgetti21,Reference Shelly, Kunz, Mittal, Corwin, Chapman and Ender22 The Children’s Hospital of Los Angeles implemented various ordering restrictions (e.g., 48-h restriction on aerobic cultures) and reported decreased blood culture usage with no change in positivity rates or other outcomes such as mortality due to septic shock, though this was done in a pediatric population, in contrast with the other adult hospitals described above. Reference Vaugon, Costales and Assad29 A recent CDC-led analysis similarly found that most facilities were affected by the shortage and that facilities reliant on BD BACTEC™ bottles had greater reductions in culture use and positivity, though this work focused on blood culture metrics, not measuring patient outcomes such as mortality. Reference Lutgring, Maillis and Bryant28
Our study is distinctive in that we evaluated changes in outcomes coinciding with a near-universal single-set blood culture restriction applied to all patients, regardless of setting and without condition-specific exceptions. Our findings support real-time monitoring of balancing measures when crisis-driven diagnostic restrictions deviate from standard practice, including culture utilization, time to culture collection, antimicrobial administration, and patient safety outcomes such as in-hospital mortality. Future studies could evaluate indication-specific strategies rather than universal restrictions. For example, our institution’s revised blood culture order panel discourages repeat cultures to document clearance of uncomplicated gram-negative bacteremia while prompting collection of ≥2 sets when Staphylococcus aureus bacteremia is suspected or confirmed, alongside ongoing clinician education. Reference Fabre, Carroll and Cosgrove15,Reference Ryder, Van Schooneveld, Diekema and Fabre16 Our study also reinforces the need to build supply chain resiliency, not only for drugs and medications Reference Pandey, Cohn and Nampoothiri1–Reference Shahzad, Nogueira and Wagner5 but also for critical diagnostic testing supplies Reference Weber, Malani and Shenoy7 such as blood culture bottles. Reference Miller, Binnicker and Campbell31
Limitations
This study had certain limitations. First, its single-center design, while conducted across 2 hospitals, limits generalizability, particularly without a simultaneous comparator group. Second, we did not evaluate additional outcomes such as blood culture appropriateness, sepsis, intensive care admission, postdischarge mortality, contamination rates, antimicrobial appropriateness, or pathogen-specific results, though we did examine microbiologically-focused outcomes in another work recently published elsewhere. Reference Ladines-Lim, Van, Cressman, Bilker, Degnan and David43 Consequently, because culture positivity included possible contaminants and organism-level adjudication was beyond the scope of this analysis, our findings should not be interpreted as demonstrating decreased detection of true bloodstream infection. Additionally, it is certainly plausible that the increased difficulty in adjudicating contamination during the restriction could have led to the increased antimicrobial exposure and LOS that we observed, further supporting indication-specific rather than blanket restriction strategies. Third, we could not capture data from other nearby health systems that may have influenced outcomes, e.g., readmissions (although we would not expect secular change in readmissions at other institutions), and unmeasured factors may have differed across periods. Fourth, our study design did not separate effects of the restriction from other likely confounders; in addition to seasonality and quarter, these include educational efforts on optimal blood culture collection that intensified at the start of the restriction period and the clinical decision support tool that was implemented postrestriction. Finally, some subgroup analyses were underpowered, and residual secular or seasonal trends could have influenced results.
Conclusions
The 2024 blood culture bottle shortage compelled implementation of a near-universal single-set restriction, which coincided with decreased and delayed testing, delayed antimicrobial initiation, and worsened trends in patient outcomes. Crisis-driven diagnostic stewardship interventions should incorporate indication-specific guidance and real-time safety monitoring, while health systems and policymakers should strengthen supply-chain resiliency for critical diagnostics.
Supplementary material
The supplementary material for this article can be found at https://doi.org/10.1017/ice.2026.10527.
Data availability statement
Data not publicly available. De-identified data and analytic code are available upon reasonable request, subject to institutional policies.
Acknowledgments
None.
Author contributions
J. B. L: developed the study design, analyzed the data, and wrote the manuscript with input from all authors. B. V.: analyzed the data, reviewed the manuscript, and provided edits and feedback. L. C.: analyzed the data, reviewed the manuscript, and provided edits and feedback. W. B. B.: reviewed the manuscript and provided edits and feedback. L. G.: reviewed the manuscript and provided edits and feedback. K. O. D.: reviewed the manuscript and provided edits and feedback. M. Z. D.: developed the study design, reviewed the manuscript, and provided edits and feedback. We are also grateful for thoughtful discussions with Kyle Rodino on the topic of the manuscript.
Financial support
This work was not supported by any external funding. J. B. L. is separately supported by a T32 training grant [grant number GM-075766] and M. Z. D. is separately supported by R01 research grants [grant numbers AI139188 and AI158452] from the National Institutes of Health.
Competing interests
J. B. L. reports a Trainee Travel Award for the IDWeek 2025 meeting in Atlanta, Georgia, where a previous iteration of this study was presented. All other authors report no conflicts of interest. All authors have submitted the ICMJE Form for Disclosure of Potential Conflicts of Interest.




 Open access

