Introduction
Ecological niche models (ENMs) predict the potential geographical distribution of species by correlating their ecological niches with environmental variables (Escalante et al. Reference Escalante, Linaje, Illoldi-Rangel, Rivas, Estrada, Neira and Morrone2009). Drawing on Grinnell’s (Reference Grinnell1924) niche concept, ENMs relate species distributions to their ecological requirements, defined by physical and climatic factors. These models use species occurrence data alongside local climatic conditions to estimate climatic tolerances and predict regions of potential climatic suitability (Anderson et al. Reference Anderson, Lew and Peterson2003). Identifying such regions is critical for conservation, especially in landscapes undergoing rapid transformation where opportunities for protection are limited (Pressey et al. Reference Pressey, Cabeza, Watts, Cowling and Wilson2007, Moraes et al. Reference Moraes, Santos, Gonçalves, Oliveira, Gomes and Lima2020). ENMs inform conservation decision-making by generating distribution scenarios, pinpointing priority areas for biodiversity conservation (Koch et al. Reference Koch, Almeida-Cortez and Kleinschmit2017) and evaluating the efficiency of existing protected areas (PAs; Sánchez-Fernández et al. Reference Sánchez-Fernández, Abellán, Picazo, Millán, Ribera and Lobo2013).
Most land-use change entails the replacement of natural landscapes with human-modified systems, including agriculture, pastures, mining and urban development (Turner II et al. Reference Turner, Lambin and Reenberg2007, Groffman et al. Reference Groffman, Cavender-Bares, Bettez, Grove, Hall and Heffernan2014). The anthropogenic transformations significantly impact ecological communities, altering species compositions, changing species distributions and affecting species abundances (Queiroz et al. Reference Queiroz, Rabello, Braga, Santiago, Zurlo, Philpott and Ribas2020, Nunes et al. Reference Nunes, Berenguer, França, Ferreira, Lees and Louzada2022). Ecological niche modelling can assess the impacts of land-use change on species richness (Peterson et al. Reference Peterson, Sánchez-Cordero, Martínez-Meyer and Navarro-Sigüenza2006, Newbold Reference Newbold2018).
Yet understanding the spatial and temporal dynamics of large species assemblages remains challenging, particularly in biodiversity hotspots. However, biological indicator groups can help point to consistent and predictable responses to ecological stressors (McGeoch Reference McGeoch1998, Del Toro et al. Reference Del Toro, Ribbons and Pelini2012). Ants are widely recognized as indicator taxa due to their high diversity, broad geographical distribution, critical ecosystem functions and well-established responses to anthropogenic disturbances (Underwood & Fisher Reference Underwood and Fisher2006, Ribas et al. Reference Ribas, Campos, Schmidt and Solar2012, Schmidt et al. Reference Schmidt, Ribas and Schoereder2013).
Ant species can be classified into the habitat-use guilds of forest specialists, open-habitat specialists and generalists. Forest specialists rely on intact forest environments and thus are highly sensitive to disturbances, while open-habitat specialists are adapted to disturbed and open conditions. Generalists occupy both forest and open habitats (Leal et al. Reference Leal, Ribeiro-Neto, Arnan, Oliveira, Arcoverde, Feitosa, Andersen, da Silva, Leal and Tabarelli2017, Vasconcelos et al. Reference Vasconcelos, Maravalhas, Feitosa, Pacheco, Neves and Andersen2018). These guilds exhibit distinct responses to land-use changes. For instance, forest clearing decreases the diversity of forest specialists while increasing the diversity of open-habitat specialists and generalists (Paolucci et al. Reference Paolucci, Schoereder, Brando and Andersen2017, Sales & Schmidt Reference Sales and Schmidt2023). These responses align with the ‘winners and losers’ framework, in which winner species adapted to disturbed environments replace losers that are unable to tolerate such changes (McKinney & Lockwood Reference McKinney and Lockwood1999, Filgueiras et al. Reference Filgueiras, Peres, Melo, Leal and Tabarelli2021).
The state of Acre (south-western Brazilian Amazon) supports exceptional biodiversity owing to its diverse soils, topography, climate and hydrology, which together create highly heterogeneous ecosystems and landscapes (Acre 2010b). Although c. 80% of Acre’s original vegetation remains intact within a network of PAs, land occupation – primarily for pasture expansion – has driven extensive deforestation and forest fragmentation over the last four decades (INPE 2019, MapBiomas 2019). Pastures dominate deforested areas, accounting for 80% of land cleared in Acre (Acre 2010b). The Acre River basin (eastern Acre) is the best-documented region for ant diversity and distribution in Acre (Schmidt et al. Reference Schmidt, Costa, Martello, De Oliveira, Menezes and Fontenele2020) and also has the highest levels of deforestation and pasture expansion in Acre (Duarte Reference Duarte2011, Adamy Reference Adamy2015); however, the impacts of these land-use changes on ant species richness and distributions have scarcely been explored (Schmidt et al. Reference Schmidt, Da Costa, Sales, Fontenele, Dormann, Batáry, Grass, Klein, Loss and Scherber2023).
We investigated the impacts of land-use change on the diversity and distribution of forest specialist, generalist and open-habitat specialist ants in the Acre River basin. Initially, we estimated the potential diversity distribution of these guilds under natural conditions, considering climatic variables, altitude and soil types (Vasconcelos et al. Reference Vasconcelos, Maravalhas, Feitosa, Pacheco, Neves and Andersen2018, Lasmar et al. Reference Lasmar, Bishop, Parr, Queiroz, Schmidt and Ribas2021). We then hypothesized that forest specialists will exhibit the highest diversity due to their association with humid environments, while open-habitat specialists will have limited distributions, restricted to drier areas. Generalists were expected to display moderate diversity with limited spatial variation.
Additionally, we incorporated past and projected future forest-to-pasture transitions into our models to evaluate their effects on ant diversity. We predicted that forest specialists will increasingly be restricted to remaining forested areas, open-habitat specialists will expand into pasture-dominated regions and generalists will exhibit minimal changes in their distribution. Overall, we anticipated a reduction in forest specialist diversity and an increase in the diversity of open-habitat specialists and generalists over time in this area.
Materials and methods
Study area
The Acre River basin, in the south-western Brazilian Amazon (Fig. 1), is located on the border between Bolivia, Brazil and Peru. In Brazil, the Acre River basin covers c. 35 000 km2 (Duarte & Gioda Reference Duarte and Gioda2014) across 10 municipalities in Acre and one in the state of Amazonas (Acre 2012), where the mean annual precipitation is 1900 mm, the mean altitude is 240 m and there is a predominance of Argisoils (Acre 2010a, 2012). Up until the 1980s, only c. 13% of the basin had been deforested (Latrubesse et al. Reference Latrubesse, Silvia, Moraes, Marchetti and Rivas2001), and in 2008, 70% of deforestation in the state was concentrated in this region (Acre 2010c). We modelled the potential distribution of ant species only in the portion of the basin inside Brazilian territory, where we have records of ant species occurrence and access to climate and land-use variables.
Location of Acre River basin in relation to the Brazilian Amazon and South America.

Sampling points of ant species occurrence
Our ant species occurrence reports for the Basin came from Schmidt et al. (Reference Schmidt, Costa, Martello, De Oliveira, Menezes and Fontenele2020) and records on species occurrence reported by the GBIF database (2021). We searched for records of the family Formicidae georeferenced in GBIF and restricted to a polygon between –8.48 and –11.10°S and between –66.96 and –70.63°W, which corresponds to the Acre River basin region. We used the ant records in GBIF in June 2021 using the rgbif package (Chamberlain & Boettiger Reference Chamberlain and Boettiger2017). We conducted modelling only for species with more than five observations to avoid rendering the areas of potential distributions too imprecise. We removed duplicate occurrences, those from coordinates outside of the polygon or erroneous records. We checked the nomenclature of ant species with that of Bolton (Reference Bolton2021).
Climatic and environmental variables sampling
In all sites with ant species occurrence, we used the data on nine bioclimatic and environmental variables, namely mean annual temperature, maximum temperature in the hottest month, minimum temperature in the coldest month, mean annual precipitation, precipitation in the wettest month, precipitation of the hottest month, altitude, soil type and land use. These variables were sampled as a set of raster layers available in WorldClim (bioclimatic variables; Fick & Hijmans Reference Fick and Hijmans2017), AmbData (altitude and soil type; Amaral et al. Reference Amaral, Costa, Arasato, Ximenes and Rennó2013) and Project MapBiomas version 5.0 (land-use categories; Souza et al. Reference Souza, Shimbo, Rosa, Parente, Alenca and Rudorff2020). Information regarding the potential change in land use in a future period was obtained through raster data from the SimAmazônia website (Soares-Filho et al. Reference Soares-Filho, Nepstad, Curran, Cerqueira, Garcia and Ramos2006). Each raster with climate variables, land use or future change projections were clipped to the Acre River basin.
MapBiomas (Collection 5.0) provided maps with high resolution (30 × 30 m) of the different land-use categories from 1985 to 2019 (Souza et al. Reference Souza, Shimbo, Rosa, Parente, Alenca and Rudorff2020). First, we downloaded maps from the collections for the Amazon biome. Then, we applied a crop to delimit the study area. We used the 1985 and 2019 maps as representative of the historical and contemporary deforestation in the basin, respectively. In MapBiomas land-use maps, we coded each pixel as 1 for forest formations and 0 when other land-use categories were present.
The WorldClim database provided environmental and climate data with a spatial resolution of 30 arc-seconds, or c. 1 km2 (Amaral et al. Reference Amaral, Costa, Arasato, Ximenes and Rennó2013, Fick & Hijmans Reference Fick and Hijmans2017). For the future bioclimatic variables, we used the projections of the Atmosphere–Ocean Global Circulation Model CCSM4 for the intermediate climatic scenario (Representative Concentration Pathway 4.5) of CMIP5 (IPCC 2013).
The SimAmazônia1 model (Amazon simulation) produced annual maps of future deforestation (from 2001 to 2050), simulated using spatial information on paved roads, PA networks, PA effectiveness, deforestation rates and land cover (Soares-Filho et al. Reference Soares-Filho, Nepstad, Curran, Cerqueira, Garcia and Ramos2006). This deforestation estimate is based on trends from 1997 to 2002 resulting from deforestation maps based on satellite images (Soares-Filho et al. Reference Soares-Filho, Nepstad, Curran, Cerqueira, Garcia and Ramos2006). We used the deforestation projections for the year 2050 from the business-as-usual scenario to explore the expected effects of changing forest cover on the distribution of ant species. In the SimAmazônia1 raster, we coded each pixel as 1 when it showed forest formations and 0 when it did not. Because the raster layers differed in spatial resolution, we projected each raster to a resolution of 2.5º and resampled the values of each cell. For raster layers with binary values (0 or 1) and continuous variables (bioclimatic variables and altitude), we used the modal and mean value, respectively, as representative of the redesigned grid.
Determination of habitat-use ant guilds
To determine the habitat-use guilds of the ant species, we used Vasconcelos et al. (Reference Vasconcelos, Maravalhas, Feitosa, Pacheco, Neves and Andersen2018); where ant species had no assigned habitat-use guild, we quantified the number of habitat occurrences reported in the AntWeb (2021) database. Thus, we considered an ant species to be specialist in a habitat (forest or open-habitat) only if 80% or more of the records matched these habitat types, while those below 80% were considered generalists. Records of habitat-use guilds from AntWeb (2021) were validated using habitat occurrence data from the entomological collections of Padre Jesus Santiago Moure (Federal University of Paraná) and the Museum of Zoology (University of São Paulo).
Data analysis
To assess differences in the potential distribution of ant habitat-use guilds, we conducted niche modelling. We modelled each ant species using niche models with different levels of computational complexity, including climate envelope techniques (BioClim and Mahalanobis distance), multiple statistical methods (generalized linear models (GLMs), generalized additive linear models (GAMs) and adaptive multivariate spline regressions (MARSs)) and machine learning (augmented decision tree regression (ML), classification and tree regression (CART), Random Forest and the maximum entropy analogue method (Maxlike); Diniz-Filho et al. Reference Diniz-Filho, Bini, Rangel, Loyola, Hof, Nogués-Bravo and Araújo2009, Naimi & Araújo Reference Naimi and Araújo2016). The projections of each niche model were calibrated using 1000 pseudo-absences randomly sampled within the boundaries of the Acre River basin (Barbet-Massin et al. Reference Barbet-Massin, Jiguet, Albert and Thuiller2012). Before modelling, we evaluated the collinearity between the variables of each set of explanatory variables (climatic-environmental and land-cover or land-use change) using variance inflation factors (VIFs; Dormann et al. Reference Dormann, Elith, Bacher, Buchmann, Carl and Carré2013), removing variables with VIFs > 10 to avoid strong collinearity in niche modelling (Dormann et al. Reference Dormann, Elith, Bacher, Buchmann, Carl and Carré2013, Naimi & Araújo Reference Naimi and Araújo2016).
We conducted a joint projection (ensemble forecasting; Araújo & New Reference Araújo and New2007) for each species to reduce the effects of idiosyncrasies in species distributions arising from differences in niche model algorithms. In the joint projection, we weighted the projection of each niche model by the area under the curve (AUC) statistics (Marmion et al. Reference Marmion, Parviainen, Luoto, Heikkinen and Thuiller2009). We considered probable locations for occurrences of a given species (suitability), a threshold that maximized the true skill statistic (TSS; Allouche et al. Reference Allouche, Tsoar and Kadmon2006). Finally, we superimposed the joint projections of ant species to generate maps of potential distribution of species richness for each habitat-use guild (forest specialists, open-habitat specialists and generalists) in the Acre River basin.
The ENMs, which included only climatic variables, altitude and soil type as predictors, were used to estimate the potential distribution of each habitat-use guild in the absence of human interference, as land use was not included in these models. These models were considered as Scenario 1. After generating diversity distribution maps by overlapping suitability maps for all species within each habitat-use ant guild, we evaluated potential differences in estimated ant species richness among guilds. Species richness was treated as the response variable and habitat-use guild as the explanatory variable using a GLM with a Poisson distribution to account for the discrete nature of species richness (Zuur et al. Reference Zuur, Ieno, Walker, Saveliev and Smith2009, O’Hara & Kotze Reference O’Hara and Kotze2010).
To investigate the responses of the potential diversity distributions of the three habitat-use ant guilds to land-use changes in the Acre River basin over time and in the future, we considered the three years: 1985, 2019 and 2050, which were used to represent, respectively, the oldest, recent and future land-use scenarios from the MapBiomas (Souza et al. Reference Souza, Shimbo, Rosa, Parente, Alenca and Rudorff2020) and SimAmazônia (Soares-Filho et al. Reference Soares-Filho, Nepstad, Curran, Cerqueira, Garcia and Ramos2006) data. To the climatic variables, altitude and soil type we added land use as a predictor variable of potential distribution area in the ENMs for each year, labelling these as Scenario 2 (i.e., Scenario 2_1985, Scenario 2_2019, Scenario 2_2050). After generating diversity distribution maps (i.e., overlaying suitability maps for all species in a habitat-use ant guild), we evaluated potential differences in ant species richness among habitat-use ant guilds (GLM; Zuur et al. Reference Zuur, Ieno, Walker, Saveliev and Smith2009). Species richness was considered the response variable and habitat-use guild as the predictor variable in the GLM, which used a Poisson distribution due to the discrete nature of species richness (O’Hara & Kotze Reference O’Hara and Kotze2010). We conducted ENMs and evaluated differences in species richness among habitat-use guilds separately for each of the years 1985, 2019 and 2050. In each GLM, we computed the ratio between the residual deviance and the degrees of freedom as a measure of potential overdispersion (Zuur et al. Reference Zuur, Ieno, Walker, Saveliev and Smith2009). All of those ratios approached 1, indicating that overdispersion was not a concern (Zuur et al. Reference Zuur, Ieno, Walker, Saveliev and Smith2009).
For each habitat-use ant guild, we explored the changes in species richness over time in Scenario 2. The variation in species richness was expressed as a percentage to represent the gain or loss in species richness in relation to the 1985 baseline. We performed all analyses in the R 3.4.3 program (R Core Team 2019), using the rgbif (Chamberlain & Boettiger Reference Chamberlain and Boettiger2017), usdm (Naimi et al. Reference Naimi, Hamm, Groen, Skidmore and Toxopeus2014), raster (Hijmans et al. Reference Hijmans, Van Etten, Summer, Cheng, Baston and Bevan2021) and sdm (Naimi & Araújo Reference Naimi and Araújo2016) packages.
Results
We recorded 155 ant species in the Rio Acre basin (79 forest specialists, 63 generalists and 13 open-habitat specialists); 78 species had more than five occurrences, and these were used in the distribution models. The Myrmicinae subfamily was the most diverse (31 species), followed by Formicinae (15), Ponerinae (11), Dolichoderinae (8), Ectatomminae (6), Pseudomyrmecinae (4), Dorylinae (2) and Paraponerinae (1).
Distribution of habitat-use ant guilds in the different scenarios
Although some regions lacked records, these areas had to be marked as blank spaces on the maps due to the absence of data, and the highest diversities of forest specialist ants were observed in the east-north-eastern and south-western regions of the basin; this was also the case with the open-habitat specialists, but to a lesser extent, while generalists exhibited a wider spatial distribution (Fig. 2). The differences in distribution and diversity of ant groups intensified over time. Specifically, there was decreased diversity of forest habitat specialist ant species and increased diversity of open-habitat specialist species, while generalist species did not vary much over time in the Acre River basin (Fig. 2).
Distribution of forest specialist, open-habitat specialist and generalist ant species over time in the Acre River basin, south-western Brazilian Amazonia in (a,e,i) Scenario 1 (models considering only bioclimatic variables, altitude and soil type), (b,f,j) Scenario 2_1985 (models considering bioclimatic variables, altitude, soil type and land use in 1985), (c,g,k) Scenario 2_2019 (models considering bioclimatic variables, altitude, soil type and land use in 2019) and (d,h,l) Scenario 2_2050 (models considering bioclimatic variables, altitude, soil type and land use projected to 2050).

Ant richness in ant habitat-use guilds in the different scenarios
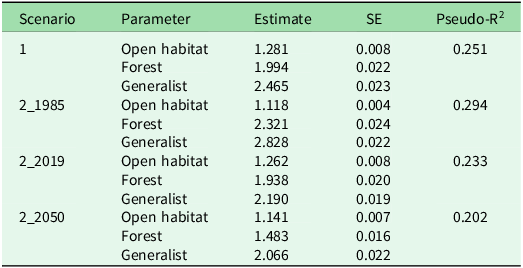
Across all distribution scenarios, we observed differences in ant species richness between the ant guilds (Fig. 3 & Table 1), with generalist ant species having the highest species richness, followed by forest specialists and then open-habitat specialists. This difference in species richness among habitat-use guilds is the most evident in Scenario 2_1985, which had the highest predictive value (pseudo-R2 = 0.294; Table 1).
Ant species richness (± standard deviation) by ant habitat-use guilds in (a) Scenario 1 (models considering only bioclimatic variables, altitude and soil type), (b) Scenario 2_1985 (models considering bioclimatic variables, altitude, soil type and land use in 1985), (c) Scenario 2_2019 (models considering bioclimatic variables, altitude, soil type and land use in 2019) and (d) Scenario 2_2050 (models considering bioclimatic variables, altitude, soil type and land use projected to 2050).

Species richness of ant habitat-use guilds in different scenarios: Scenario 1 (models considering only bioclimatic variables, altitude and soil type), Scenario 2_1985 (models considering bioclimatic variables, altitude, soil type and land use in 1985), Scenario 2_2019 (models considering bioclimatic variables, altitude, soil type and land use in 2019) and Scenario 2_2050 (models considering bioclimatic variables, altitude, soil type and land use projected to 2050).

SE = standard error.
We observed a significant reduction in mean species richness of forest specialists and generalists in relation to the year 1985 based on deforestation estimates and projections (Table 2). In 2019, the mean species richness of generalist species corresponded to 77% of that seen in 1985. In 2050, a more pronounced reduction is expected for forest specialist species, with the mean species richness for this group corresponding to c. 64% of that observed in 1985. Although open-habitat specialists showed relatively less change over time, their species richness tended to increase (Table 2).
Average percentage of ant species richness relative to 1985 for open-habitat specialist, forest specialist and generalist habitat-use ant guilds in Scenario 2.

Discussion
This study is the first to model the space–time distribution of ants in the south-western Brazilian Amazon. Our approach provides insights into the possible responses of ants to land-use changes and could be applied more widely. Despite gaps in ant occurrence records, the available data enabled the construction of diversity distribution scenarios based on varying deforestation levels, primarily driven by forest-to-pasture conversion. Our results show distinct temporal trends in species richness across the ant habitat-use guilds considered. This faunal shift induced by climate change has also been observed in mammal species (Sales et al. Reference Sales, Galetti and Pires2020).
Ant species occurrence records
The lack of information on species occurrence for 77 of the 155 species recorded is known as a ‘Wallacean knowledge shortfall’ (Hortal et al. Reference Hortal, de Bello, Diniz-Filho, Lewinsohn, Lobo and Ladle2015); knowledge of the geographical distribution of these species was incomplete (Lomolino & Heaney Reference Lomolino and Heaney2004). The large gaps in ant species occurrence in our study reflect the limited sampling throughout the south-western Brazilian Amazon; this is particularly troublesome because the Acre River basin has the largest number of ant occurrence records in the region (Schmidt et al. Reference Schmidt, Costa, Martello, De Oliveira, Menezes and Fontenele2020), and so the situation must be worse in other basins in the region. Efforts to improve ant sampling throughout Acre state are important. However, recurrent cuts in investment in science and technology have limited the number of such projects receiving these financial resources (Escobar Reference Escobar2015, Angelo Reference Angelo2019), which hinders advances in biodiversity knowledge as well as in the training of qualified professionals in biodiversity.
Distribution of habitat-use ant guilds in the different scenarios
Each habitat-use ant guild responded differently to the scenarios considered in the distribution models. First, as forest specialist ants are linked to forest environments, we noticed that their occurrence is directly associated with sites that are naturally more humid in the region, and these overlap with places where conservation units are located (Acre 2012). This reinforces the importance of maintaining these areas to mitigate deforestation in the region (Milien et al. Reference Milien, Rocha, Brown and Perz2021) and to conserve biodiversity, such as that of ants in forest habitats (Martins et al. Reference Martins, Ortega, Guerra, Costa, Martello and Schmidt2022). On the other hand, aside from the fact that they occur naturally in low numbers in the region, open-habitat specialists had their distribution restricted to pasture areas, leading to a lower species richness throughout the basin. Although our distribution models do not consider the immigration of ant species from naturally open areas, this could be happening from savannah-like vegetation in Brazil and nearby Bolivia (Marques et al. Reference Marques, Marimon-Junior, Marimon, Matricardi, Mews and Colli2019, Singh et al. Reference Singh, Sood and Collins2022), leading to a dominance of open-habitat specialists in degraded areas and pastures in the Amazon region (Paolucci et al. Reference Paolucci, Schoereder, Brando and Andersen2017, Martins et al. Reference Martins, Ortega, Guerra, Costa, Martello and Schmidt2022). The generalists have a broader distribution, which emphasizes their plasticity regarding habitat use and shows that they potentially benefit from the conversion of forest areas into pastures, possibly replacing some of the forest specialist species (Martins et al. Reference Martins, Ortega, Guerra, Costa, Martello and Schmidt2022).
Ant richness of habitat-use ant guilds in different scenarios
Habitat-use ant guilds have different responses to the progression of deforestation over time throughout the Acre River basin. A few winner species (McKinney & Lockwood Reference McKinney and Lockwood1999), which are more resistant to or benefit from disturbances, gradually replace native species that do not tolerate induced disturbances, which are thus considered losers (Filgueiras et al. Reference Filgueiras, Peres, Melo, Leal and Tabarelli2021). The consequent decrease in species richness of forest specialist ants with increased deforestation throughout the scenarios would render them as losers. Although generalist ants also show a decrease in species richness, they can be considered winners because they are more resistant to deforestation than forest specialists. Since open-habitat specialist ant species richness is intensified with deforestation, they could be considered winners as well. This species replacement has already been reported in both forested areas and in areas with degraded forests in the south-western and southern Brazilian Amazon, respectively, where open-habitat specialists and generalists dominate the ant assemblages in areas with low forest cover (Paolucci et al. Reference Paolucci, Schoereder, Brando and Andersen2017, Martins et al. Reference Martins, Ortega, Guerra, Costa, Martello and Schmidt2022).
These findings of both observed and simulated species replacements (Paolucci et al. Reference Paolucci, Schoereder, Brando and Andersen2017, Martins et al. Reference Martins, Ortega, Guerra, Costa, Martello and Schmidt2022) converge with Amazon forest conversion theories arguing that biological communities will suffer declines in the abundance of forest specialist species and observe increases in the abundance and richness of generalist or open-habitat species (Brejão et al. Reference Brejão, Hoeinghaus, Roa-Fuentes, Pérez-Mayorga, Ferraz and Casatti2021). According to simulations that consider the combined effects of several stress factors, this transition point is quite close in time (Willcock et al. Reference Willcock, Cooper, Addy and Dearing2023).
Conclusions
Using these ant species, we corroborate the negative effects of forest-to-pasture transitions on Amazon biodiversity (Newbold Reference Newbold2018, Nunes et al. Reference Nunes, Berenguer, França, Ferreira, Lees and Louzada2022) in the past and in the predicted future (Willcock et al. Reference Willcock, Cooper, Addy and Dearing2023). We therefore highlight the urgent need for the better design of landscape use in the Amazon, providing more favourable land uses (Arroyo-Rodrigues et al. Reference Arroyo-Rodríguez, Fahrig, Tabarelli, Watling, Tischendorf and Benchimol2020), as well as the restoration of large areas (Becker Reference Becker2010) to promote forest biodiversity and ecosystem functioning.
Supplementary material
To view supplementary material for this article, please visit https://doi.org/10.1017/S0376892925100180.
Acknowledgements
We thank S Perz and the anonymous referees for reviewing the manuscript, and all those who directly or indirectly contributed to the execution of this study.
Financial support
We thank FAPAC (Grant Agreement No. 017/2021, Call Notice 003/2019 FAPAC/CNPq, Agreement 865143/2018) and CAPES (Financing Code 001) for financial support. We also acknowledge the translator funded by CAPES (Portaria 15, 10 August 2022).
Competing interests
The authors declare none.
Ethical standards
Not applicable.