INTRODUCTION
Senescence is an active phase of plant development involving degradation and remobilization processes. Stay-green (SG) is the general term given to genotypes in which senescence is delayed compared with standard reference (hereafter referred to as ‘normal’) genotypes (Thomas & Howarth Reference Thomas and Howarth2000). According to Thomas & Smart (Reference Thomas and Smart1993) there are different types of SG. Functional SG hybrids photosynthesize longer than normal types owing to a delayed onset and/or a slower decrease in photosynthetic capacity (P sat). Cosmetic SG types retain chlorophyll and chloroplast membrane proteins in senescing leaves, but P sat declines at a rate similar to normal types (Thomas & Howarth Reference Thomas and Howarth2000).
Functional SG types can be identified by measuring P sat as the net carbon dioxide (CO2) assimilation rate (He et al. Reference He, Osaki, Takebe and Shinano2003; Zhang et al. Reference Zhang, Li, Gao, Zhang, Yang, Liu and Meng2012). Measuring P sat in the field is time- and labour-intensive, and the results may be influenced by weather conditions during measurement. Hence, most studies measure proxies to characterize the SG trait. Destructive measurements, such as chlorophyll and nitrogen (N) concentrations in the leaves, suffer far less from daily weather fluctuations, but they still require laboratory facilities. Leaf greenness can be measured by a SPAD portable chlorophyll meter (Chapman & Barreto Reference Chapman and Barreto1997; Subedi & Ma Reference Subedi and Ma2005; Boussadia et al. Reference Boussadia, Steppe, Zgallaï, Ben El Hadj, Braham, Lemeur and Van Labeke2011) or it can simply be scored by visual evaluation (Pommel et al. Reference Pommel, Gallais, Coque, Quilleré, Hirel, Prioul, Andrieu and Floriot2006; Kosgey et al. Reference Kosgey, Moot, Fletcher and McKenzie2013).
Delayed leaf senescence is one of several traits that has contributed to increased yield potential of new maize (Zea mays L.) hybrids (Echarte et al. Reference Echarte, Rothstein and Tollenaar2008), but this is only valid in functional SG types. Indeed, differences in leaf senescence among older and newer forage maize hybrids have been associated with a specific difference in carbon (C) and N flux to fill grains (Rajcan & Tollenaar Reference Rajcan and Tollenaar1999). Many current forage maize varieties are claimed to be SG types but it is unclear if SG in these varieties is functional or cosmetic. For example, Wilkinson & Hill (Reference Wilkinson and Hill2003) found no yield advantage of SG varieties because environmental effects on yield were greater than effects of plant type.
By delaying senescence, SG varieties have the opportunity to intercept more solar radiation and the potential to accumulate more dry matter (DM). A surplus of assimilates can be stored in the stover, which acts as a buffer (Rajcan & Tollenaar Reference Rajcan and Tollenaar1999), or translocated to the roots, resulting in a higher post-flowering N uptake (He et al. Reference He, Osaki, Takebe and Shinano2003). Grain N requirements during grain-filling are met from soil uptake and remobilization from the stover. However, Kosgey et al. (Reference Kosgey, Moot, Fletcher and McKenzie2013) reported that SG varieties had lower grain N concentrations because they retained N in their leaves without taking up more N from the soil compared with normal varieties.
The current work studied eight forage maize varieties with a different genetic background and a different number of days to reach maturity. Support was sought for three hypotheses: (i) the variation in P sat and its proxies leaf N concentration, chlorophyll concentration, SPAD and greenness score between varieties is large enough to define plant types; (ii) the SG trait provokes a higher assimilate production; and (iii) the surplus assimilates results in a yield advantage.
MATERIALS AND METHODS
Experimental site and design
Eight varieties of forage maize were grown at two experimental sites, Merelbeke (50°59′N, 3°47′E, 20 m a.s.l.) and Bassevelde (51°15′N, 3°39′E, 2 m a.s.l.) in Flanders (the northern part of Belgium), during two consecutive years (2013–14). Different soil types characterized the two sites: sandy loam in Merelbeke and clay in Bassevelde. Eight varieties were chosen representing the variation between varieties available on the Belgian market: Banguy (Limagrain), Kalientes (KWS), LG 30·222 (Limagrain), LG 30·224 (Limagrain), LG 3220 (Limagrain), MAS 17E (Maisadour), NK Falkone (Syngenta) and Ronaldinio (KWS). Maize varieties are rated based on cumulative temperature in the growing season (Ontario Units, OU; Brown Reference Brown1969). Daily OU are calculated from minimum and maximum temperatures OU = (Y max + Y min)/2 using following equations for Y max and Y min:
 $$\matrix{Y_{{\rm max}} = 3{\cdot}33(T_{{\rm max}} - 10) - 0{\cdot}084(T_{{\rm max}} - 10)^2, \hfill & Y_{{\rm max}} = 0\; \;{\rm if}\;\; T_{{\rm max}} \lt 10\; ^\circ {\rm C,} \cr Y_{{\rm min}} = 1{\cdot}8(T_{{\rm min}} - 4{\cdot}4),\hfill & \; Y_{{\rm min}} = 0\; \;{\rm if}\;T_{{\rm min}} \lt 4{\cdot}4\; ^\circ {\rm C}\hfill } $$
Temperatures were registered in weather stations a maximum of 20 km way from the experimental fields. The OU required to reach 35% DM differed among varieties, with a maximum difference of 100 OU. The experimental design was a completely randomized block with three replicates. Plots consisted of 20 rows with a length of 8 m. Row width was 0·75 m and the plant density was 100 000 plants/ha. Sowing dates were between 17 and 25 April (depending on the site and year). Manure and fertilizers were applied to ensure optimal N conditions (varying from 130 to 300 kg N/ha supply) according to recommended agricultural practices in line with current Belgian regulations.
Weather conditions and monitoring dates
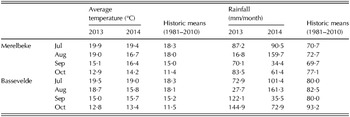
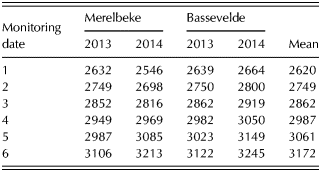
The weather conditions are presented in Table 1. The 2013 growing season was characterized by normal daily average temperatures and normal precipitation in July. In August, rainfall was about 55 mm less than the historic mean (1981–2010). In September and October, 45 mm above-average precipitation was measured in Bassevelde, while precipitation was normal in Merelbeke. The 2014 growing season was characterized by temperatures that were 2 °C lower than average in August and 2–3 °C higher in October. Rainfall was high in July and August: rainfall in July was 20 mm above average and double the historic mean for August. In September and October, rainfall was 15–45 mm below average. Six monitoring dates were applied during plant maturation. Harvesting was initiated when the kernels of the earliest hybrid, Kalientes, were at the dent stage (R5) (Ritchie et al. Reference Ritchie, Hanway and Benson1997) targeting a whole-crop DM concentration of about 24%. The first monitoring date coincided with 2633–2664 OU depending on site and year (Table 2). Subsequent dates were taken with intervals of 1 week (74–130 OU), targeting a whole-crop DM concentration of about 40% at the last monitoring date.
Monthly temperatures and rainfall from July to October in Merelbeke and Bassevelde in 2013 and 2014

Ontario Units per monitoring date, site and year

Field and laboratory measurements
Net photosynthesis at saturation level (P sat) and stomatal conductance (g s) were simultaneously measured using an open gas exchange system (LI-6400; LI-COR, Lincoln, NE, USA) with an integrated fluorescence chamber head (LI-6400-40 leaf chamber fluorometer). The light sources, air temperature and CO2 concentration inside the fluorescence head were set at 1500 µm photons/m2s, 25 °C and 450 µm CO2/m, respectively. Measurements were made on a single plant labelled with a small piece of string, on the third leaf from the top at the central part of the leaf blade, excluding the midrib. SPAD measurements were performed with a Konica-Minolta SPAD-502 (Konica Minolta Sensing, Inc., Osaka, Japan) on the same leaf of this plant and on the third leaf from the top of two additional randomly chosen plants. In line with Chapman & Barreto (Reference Chapman and Barreto1997), the mean of three measurements near the middle of the leaf was used as the SPAD value. The whole plot was visually scored for greenness on a scale from 1 (fully matured, brown) to 10 (green) at each monitoring date. At each monitoring date, a mixed sample of 10 cm2 was taken from the third leaf from the top of an additional set of three randomly chosen plants and taken immediately to the laboratory. Chlorophyll was determined according to Lichtenthaler (Reference Lichtenthaler1987). Sugars were extracted with 80% ethanol at 70 °C for 10 min and for a further 3 h at 45 °C, followed by centrifugation at 5000 g for 5 min. Fructose and sucrose were analysed using high-pH anion exchange chromatography with pulsed amperometric detection (Waters; CarboPac MA1 column with companion guard column; Thermo Fisher Benelux B.V., Amsterdam, The Netherlands; eluent: 50 mm sodium hydroxide (NaOH), 22 °C). The remaining ethanol-insoluble material was washed twice with ethanol 80% and the residual pellet was treated with 1 m hydrochloric acid (HCl) for 2 h at 95 °C for starch hydrolysis. Starch was determined spectrophotometrically at 340 nm by the enzymatic reduction of nicotinamide adenine dinucleotide phosphate (NADP+; UV–VIS, Biotek Uvikon XL, Winooski, VT, USA). At each of the monitoring dates, plants were taken to determine DM yield, and N concentration. A plot of 10 m2 (approximately 100 plants) was harvested and weighted to determine fresh yield. From these 100 plants, five representative plants were chosen at random and chopped completely, while ten more representative plants were used to sample leaves and ears (dehusked). The ten ears were weighted to determine fresh ear yield. Leaves and ears were chopped separately. All chopped material (whole-crop and plant parts) was dried at 70 °C for 72 h and milled over a 1 mm screen using a cutting mill (Retsch Model PK 1000, Retsch, Haan, Germany). Nitrogen concentration was determined by the Kjeldahl method (ISO 2005). Measurements of P sat, stomatal conductance, leaf N concentration and greenness score were performed in both years and at both sites. Chlorophyll concentration, SPAD values, DM yield and N concentration of ear and whole-crop were only measured in 2014, at both sites. Leaf sucrose, fructose and starch concentration were only measured in Merelbeke, 2014.
Determination of measuring Ontario Units
The maturity rate (expressed as DM increase per OU) was independent of variety from monitoring date 2 to date 6. Therefore, the first monitoring date was excluded from the dataset for all following calculations. As the varieties had a different DM concentration at the onset of the measurements, monitoring dates were transformed into measuring Ontario Units (MOU) in such a way that the first MOU corresponded with a fixed DM level for all varieties. Measuring Ontario Units are a measurement for plant development: it reports OU until a DM concentration of 26% is reached; they were calculated based on the linear regression between DM concentration and OU for variety i, year j and site k using the following equations:
 $$\eqalign{& {\rm DM}_{ijk} = a_{ijk} + {\rm} b_{\,jk} \times {\rm OU}_{\,jk} \cr & {\rm MOU}_{ijk} = {\rm OU}_{\,jk} -(26 - a_{ijk} )/b_{ijk} + 2770} $$
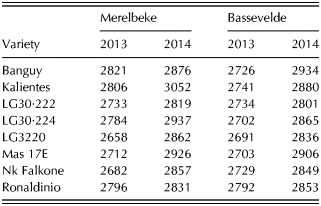
The MOU with value 2770 coincides with a DM concentration of 26%. The value of MOU at the second monitoring date is presented in Table 3.
Measuring Ontario Units (MOU) corresponding with monitoring date 2 for each variety, year and site (MOU = 2770 corresponds with 26% DM concentration)

Determination of photosynthetic capacity
At each monitoring date, P sat of all varieties at the two sites were measured on a single day between 09·00 and 16·00 h. One reference plant was chosen in each field trial and the P sat of this reference plant was measured four times during the day to quantify potential daily changes due to changes in the environment. When the four measurements differed statistically, a linear regression was made between P sat and time. This regression was used to adjust all measurements for that day.
Determination of the plant types: stay-green or normal
The eight varieties were divided into plant types based on the linear regression between P sat and MOU. The full regression model included P sat as dependent variable and MOU (β), type (α) with variety nested within type, year (γ; j = 2013, 2014), site (δ; k = Merelbeke, Bassevelde), as independent variables with all possible interactions. All factors in this model were known, except type. A set of different models were calculated: the number of models equalled the number of possible combinations of grouping the varieties; starting from eight groups (every variety is a group) to two groups. The selected model with corresponding grouping of varieties fulfilled three conditions: (1) type α i and/or its interaction with measuring date (αβ) i was/were significant; (2) effects of type α i was independent of year γ j and site δ k ; (3) Akaike's information criterion (AIC) (Crawley Reference Crawley and Crawley2007) was lowest. Statistical analyses were performed using the statistical program R (version 2.14·1). Significance was declared at P < 0·05. Normality and equal variances were checked with a QQ-plot (i.e. a plot of the quantiles of the first dataset against the quantiles of the second dataset) and Levene's test, respectively (Crawley Reference Crawley and Crawley2007).
RESULTS
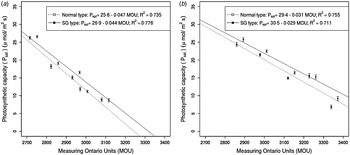
Two plant types could be identified based on P sat measurements during the grain-filling period. The normal type consisted of the varieties LG30·222, MAS 17E and NK Falkone, while Banguy, Kalientes, LG30·224, LG3220 and Ronaldinio were characterized as SG. During the whole grain-filling period, the SG type had P sat values that were 1·1 µm/m2s higher than corresponding values in the normal type (Fig. 1). This difference was found in both years, even though P sat decreased faster during grain filling in 2013: 4 µm/m2s per 100 MOU in 2014 compared to 3 µm/m2s per 100 MOU in 2013. The higher P sat values resulted in a delayed senescence of 28–41 MOU, corresponding with a delayed senescence of 2–3 days.
Photosynthetic capacity for the normal type and SG type in (a) 2013 and (b) 2014. Each point is the mean (±s.e.) across all varieties within the type at the sites Merelbeke and Bassevelde. MOU = 2770 corresponds with 26% DM concentration in the harvested biomass.

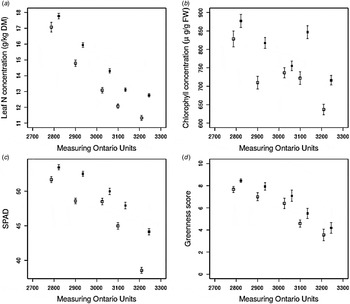
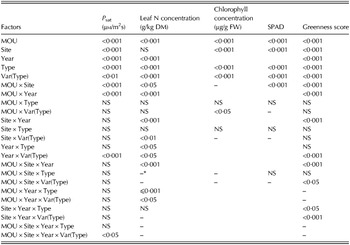
The measured proxies, including leaf N concentration, chlorophyll concentration, SPAD and greenness score, were higher for the SG type compared with the normal type (Fig. 2). These higher values were measured during the whole grain-filling period. The types were defined in such way that the effect of type on P sat was independent of site, year and MOU (Table 4). This independence was also found with chlorophyll concentration and SPAD. The effect of type on leaf N concentration depended on year and MOU (P ⩽ 0·001) and a significant effect of site × year × type interaction (P < 0·05) was measured for greenness score. Yet the SG varieties had a higher leaf N concentration and a higher greenness score at each site, year and MOU.
Relationship between (a) leaf N concentration, (b) chlorophyll concentration, (c) SPAD and (d) greenness score with measuring Ontario Units (MOU) for the normal type (□) and SG type (■). MOU = 2770 corresponds with 26% DM concentration in the harvested biomass. Each point is the mean (±s.e.) across all varieties within the type; sites Merelbeke and Bassevelde; years 2013 and 2014.

Analysis of the effect of: measuring date (MOU), site (Site), year (Year), plant type (Type) and variety nested within plant type (Var(Type)) on photosynthetic capacity (Psat ), leaf nitrogen (N) concentration, chlorophyll concentration, SPAD and greenness score; reported as P values

* The parameter was excluded from the statistical model by stepwise simplification.
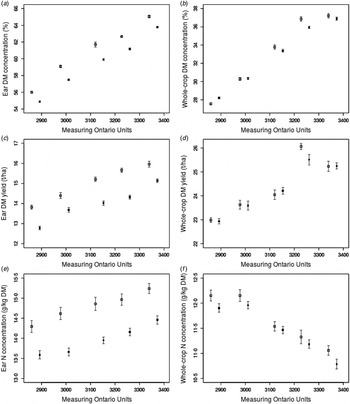
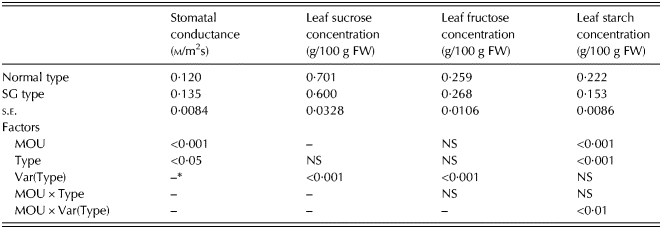
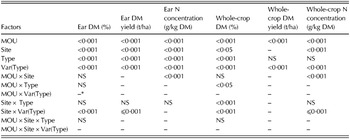
Stomatal conductance was 0·015 m/m2s higher in SG varieties compared with normal varieties, independent of site (Table 5). Leaf sucrose and leaf fructose concentration did not differ between types. Leaf starch concentration was 0·07 g/100 g fresh weight (FW) higher in the normal varieties compared to SG varieties. Effects of type on whole-crop DM concentrations depended on site: SG varieties had lower whole-crop DM levels compared with normal varieties in Merelbeke, but there was no difference in Bassevelde. Differences between the types in DM yield and N concentration were found in the ear, but not in the whole-crop biomass (Fig. 3 and Table 6). Normal varieties accumulated more DM in the ear than SG varieties, but at a similar rate. This resulted in an ear DM yield that was 10% higher in normal varieties than in SG varieties. The higher N retention in the leaves in SG varieties resulted in a 10% lower ear N concentration.
Relationship between (a) ear DM concentration, (b) whole-crop DM concentration, (c) ear DM yield, (d) whole-crop DM yield, (e) ear N concentration and (f) whole-crop N concentration with measuring Ontario Units (MOU) for the normal type (□) and SG type (■). MOU = 2770 corresponds with 26% DM concentration in the harvested biomass. Each point is the mean (±s.e.) across all varieties within the type; sites Merelbeke and Bassevelde in 2014.

Mean ( s.e. ) stomatal conductance, leaf sucrose concentration, leaf fructose concentration and leaf starch concentration per plant type in Merelbeke, 2014 and analysis of the effect of: measuring Ontario Units (MOU), plant type (Type) and variety nested within plant type (Var(Type)); reported as P values

s.e., Standard error of the mean.
* The parameter was excluded from the statistical model by stepwise simplification.
Analysis of the effect of: measuring Ontario Units (MOU), site (Site), plant type (Type) and variety nested within plant type (Var(Type)) on ear DM concentration, whole-crop DM concentration, ear DM yield, whole-crop DM yield, ear nitrogen (N) concentration and whole-crop N concentration in 2014; reported as P values.

* The parameter was excluded from the statistical model by stepwise simplification.
DISCUSSION
Variation in P sat between the eight studied varieties was large enough to identify two plant types: SG and normal. However, by studying assimilate production and yield, the SG trait was characterized as cosmetic. The difference between the two plant types in P sat, although significant, was probably too small to affect DM yield under the conditions of the present experiment. The use of field trials for physiological studies is challenging because environmental effects are likely to be greater than the effect of plant type. Only a few studies have investigated senescence of field-grown maize plants by measuring P sat (He et al. Reference He, Osaki, Takebe and Shinano2003; Acciaresi et al. Reference Acciaresi, Tambussi, Antonietta, Zuluaga, Andrade and Guiamét2014). Similar to Hirasawa & Hsiao (Reference Hirasawa and Hsiao1999), diurnal changes in P sat were observed in the present study. Therefore, a daily P sat pattern of a reference plant was used to adjust all measurements. A second adjustment took into account the whole-crop DM concentration to ensure that differences in P sat were caused by the SG character and not by maturation level. Values for P sat, leaf N concentration and SPAD were numerically comparable with Acciaresi et al. (Reference Acciaresi, Tambussi, Antonietta, Zuluaga, Andrade and Guiamét2014) and Ding et al. (Reference Ding, Wang, Jiang, Liu and Gao2007). Chlorophyll concentrations reported in the present study were however lower than those reported in Ding et al. (Reference Ding, Wang, Jiang, Liu and Gao2007).
The SG type showed P sat values that were 1·1 µm/m2s higher than the corresponding values in the normal type during the whole grain-filling period. Acciaresi et al. (Reference Acciaresi, Tambussi, Antonietta, Zuluaga, Andrade and Guiamét2014) found significant differences in P sat between normal and SG varieties only at the end of the grain-filling period. Whereas the overall difference of 1·1 µm/m2s in the current work was significant, the relative difference increased from 4% (26 v. 25 µm/m2s) at 2700 MOU to 10% (11 v. 10 µm/m2s) at 3000 MOU. The SG varieties always had a higher leaf N concentration, chlorophyll concentration, SPAD and greenness score. It is hypothesized that the higher chlorophyll concentration and the higher leaf N concentration were responsible for the higher P sat values. Indeed, according to Osaki & Shinano (Reference Osaki and Shinano2001), there exists a positive correlation between P sat and leaf N concentration. Although differences in P sat between SG and normal varieties were small, differences in proxies for P sat were more discriminating. According to Osaki & Shinano (Reference Osaki and Shinano2001), P sat is also regulated by photosynthate translocation. When photosynthates accumulate in the leaves, by low translocation of photosynthates, photosynthesis is inhibited by a feedback system (De Schepper et al. Reference De Schepper, Steppe, Van Labeke and Lemeur2010, Reference De Schepper, Vanhaecke and Steppe2011), which causes reduced stomatal opening (Hirasawa & Hsiao Reference Hirasawa and Hsiao1999) and a lower rate of P sat. Indeed, the normal varieties in the present study showed a higher starch concentration in the leaves and a lower stomatal conductance compared with the SG varieties, corresponding with lower P sat values. Overall, compared with normal varieties, SG varieties had higher P sat values, but the difference did not result in a higher concentration of leaf photosynthates. Hence, the SG trait was characterized as cosmetic.
The SG trait influenced N dynamics during grain filling. Compared with normal varieties, SG varieties incorporated more N into the vegetative tissues and translocated less N from the leaves into the ears. The translocation rate (expressed as N concentration in function of MOU) was lower for SG varieties compared with normal varieties in 2013, but not in 2014. As a result of this lower N translocation, the ears of SG varieties contained 20 kg/ha less N than the ears of normal varieties, which corresponds to the study of Kosgey et al. (Reference Kosgey, Moot, Fletcher and McKenzie2013). This resulted in a 10% lower ear N concentration in SG varieties. As C and N metabolism in kernel development is closely coupled (Cazetta et al. Reference Cazetta, Seebauer and Below1999), a 10% lower ear DM yield was also found in the SG varieties compared with the normal varieties. Delayed leaf senescence may allow SG varieties to allocate more C and N to the roots during grain filling and maintain a greater capacity to extract N from the soil compared with normal types (Borrell et al. Reference Borrell, Hammer and Van Oosterom2001). He et al. (Reference He, Osaki, Takebe and Shinano2003) compared an SG and a normal variety and observed that the former had heavier roots, richer in N. No evidence of greater N uptake was found for SG varieties in the current study: whole-crop N concentration and root dry weight (data not shown) did not differ between types.
The SG trait is associated with greater moisture levels in the stover (leaves and stalk) (Thomas & Smart Reference Thomas and Smart1993). Effects of type on whole-crop DM concentrations depended on site. Compared with normal varieties, similar whole-crop DM concentrations of SG varieties (Ettle & Schwarz Reference Ettle and Schwarz2003; Arriola et al. Reference Arriola, Kim, Huisden and Adesogan2012) were only evident in Bassevelde. In contrast with Ettle & Schwarz (Reference Ettle and Schwarz2003), SG varieties had a lower ear DM concentration compared with normal varieties. No statistically significant differences were found in whole-crop DM yield between SG and normal varieties, which is in line with Wilkinson & Hill (Reference Wilkinson and Hill2003). In the absence of whole-crop yield differences, the SG trait mainly provoked shifts in partitioning of DM yield and N concentration between vegetative and generative tissues. Compared with normal varieties, SG varieties had a smaller ear and a larger stover fraction; ears contained less N and stover more. Such shifts must influence the quality of the harvested produce since the ear is more digestible than the stover. Ettle & Schwarz (Reference Ettle and Schwarz2003) associated the SG trait with lower digestibility. In contrast, Arriola et al. (Reference Arriola, Kim, Huisden and Adesogan2012) reported similar digestibility results for SG and normal varieties. These discrepancies emphasize that generalizations about effects of the SG trait may be misleading.
CONCLUSIONS
Stay-green varieties were identified, but the SG trait was cosmetic. Compared with normal varieties, they showed a delayed senescence of 2–3 days: higher P sat values, higher values for leaf N concentration, chlorophyll concentration, SPAD and greenness score. The proxies for P sat were more discriminating than P sat measurements. These SG varieties were characterized as cosmetic because the concentration of photosynthates (sucrose and fructose) in the leaves and whole-crop DM yield did not differ from normal varieties. The lower P sat values of the normal type coincided with an increased level of starch in the leaves and a smaller stomatal conductance. The SG trait influenced N dynamics in the plant: lower translocation of N from the leaves to the ear. Compared with normal varieties, SG varieties had a lower ear DM yield but the whole-crop DM yield did not differ between the two types.
The authors would like to thank Andy Ingels and Astrid D’Haene for their contribution to the field and laboratory analyses.