INTRODUCTION
One of the most important attributes of any animal population is its social structure (Whitehead, Reference Whitehead2009). This is often a key element of the population biology of a species, influencing processes such as gene flows or spatial distribution patterns (Wilson, Reference Wilson1975). Mammals have complex social structures; these may vary considerably through time, both between and within species. Therefore, describing and classifying those structures is complex and challenging (Costa & Fitzgerald, Reference Costa and Fitzgerald1996). Knowledge regarding the identity of the interacting, associating or grouped animals is essential for social structure studies (Whitehead & Van Parijs, Reference Whitehead, Van Parijs, Boyd, Don Bowen and Iverson2010). These types of studies are based on the identification of individual animals and on recording their interactions (Whitehead, Reference Whitehead2008). One of the best methods to achieve this is using photo-identification (photo-id). Photo-id is based on the repeated recognition of individuals through photographs and has become an essential technique to provide information on group stability and association patterns (Würsig & Würsig, Reference Würsig and Würsig1977). Photographing certain body parts is a non-invasive method of identifying and monitoring individuals over time. Bottlenose dolphins (Tursiops truncatus), as well as other dolphin species can be individually identified using photo-id of their dorsal fins (Würsig & Jefferson, Reference Würsig, Jefferson, Hammond, Mizroch and Donovan1990). Each individual has a distinct and unique contour of the fin as a consequence of the interactions with conspecifics, environmental or anthropogenic factors. Thus, the posterior edge of the dolphin's dorsal fin may become irregular, resulting in recognizable patterns of notches and scars (Würsig & Jefferson, Reference Würsig, Jefferson, Hammond, Mizroch and Donovan1990).
Based on genetic information, Quérouil et al. (Reference Quérouil, Silva, Freitas, Prieto, Magalhães, Dinis, Alves, Matos, Mendonça, Hammond and Santos2007) suggest that there is a single population of bottlenose dolphins in the pelagic waters of the North-east Atlantic, which is not significantly differentiated from the pelagic population of the North-west Atlantic. Madeira archipelago is one of the most isolated oceanic habitats in the North-east Atlantic; thus it may be expected to find a greater differentiation in the population structure. However, dolphins are capable of travelling large distances in short periods (Wells et al., Reference Wells, Rhinehart, Cunningham, Whaley, Baran, Koberna and Costa1999), making it possible that the lack of geographic structuring is explained by large home ranges and/or high dispersal in the study area (Quérouil et al., Reference Quérouil, Silva, Freitas, Prieto, Magalhães, Dinis, Alves, Matos, Mendonça, Hammond and Santos2007). In terms of genetic structure the bottlenose dolphins in Madeira seem to be part of a bigger Atlantic pelagic population with high levels of gene flow (Quérouil et al., Reference Quérouil, Silva, Freitas, Prieto, Magalhães, Dinis, Alves, Matos, Mendonça, Hammond and Santos2007). Strong site fidelity, with the presence of both resident groups and resource specialization, as a consequence of different social and behavioural strategies, could be leading factors for a differentiation of genetic structure (Hoelzel et al., Reference Hoelzel, Potter and Best1998). Therefore, the social structure is sensitive to the genetic population structure (Whitehead & Van Parijs, Reference Whitehead, Van Parijs, Boyd, Don Bowen and Iverson2010).
Previous studies on bottlenose dolphins describe them as living in a so-called fission-fusion community, where individuals associate in small groups that change in composition, often on a daily or even hourly basis (Würsig & Würsig, Reference Würsig and Würsig1977; Wells et al., Reference Wells, Scott, Irvine and Genoways1987). Unlike animals that live in groups of constant composition, social relationships in a fission-fusion society may depend strongly on ‘who is there and who is not’ (Connor et al., Reference Connor, Wells, Mann, Read, Mann, Connor, Tyack and Whitehead2000). Several studies (e.g. Wells, Reference Wells, Pryor and Norris1991; Smolker et al., Reference Smolker, Richards, Connor and Pepper1992; Wilson, Reference Wilson1995) reported a great variability in social strategies within and between populations, such as different gender-related bonds that could be due to differences in predation risk, mating and availability or use of resources. In Florida, patterns of social association facilitate the partitioning of continuously distributed resident dolphins into geographic management units (Wells, Reference Wells1986). The frequency of associations between individuals that inhabit overlapping or adjacent ranges can help to define population units. Given that this information is geo-referenced, the definition of management units makes it possible to relate specific threats to a particular population or community, allowing the assessment of potential impacts and mitigation efforts (Connor et al., Reference Connor, Wells, Mann, Read, Mann, Connor, Tyack and Whitehead2000).
In order to investigate the social structure of the bottlenose dolphin population that occurs in the oceanic archipelago of Madeira, individual photo-id data collected during 11 years were analysed. Information on social structure is important for management and conservation plans for this species in the study area, as different social units may require individual management strategies.
MATERIALS AND METHODS
Study area
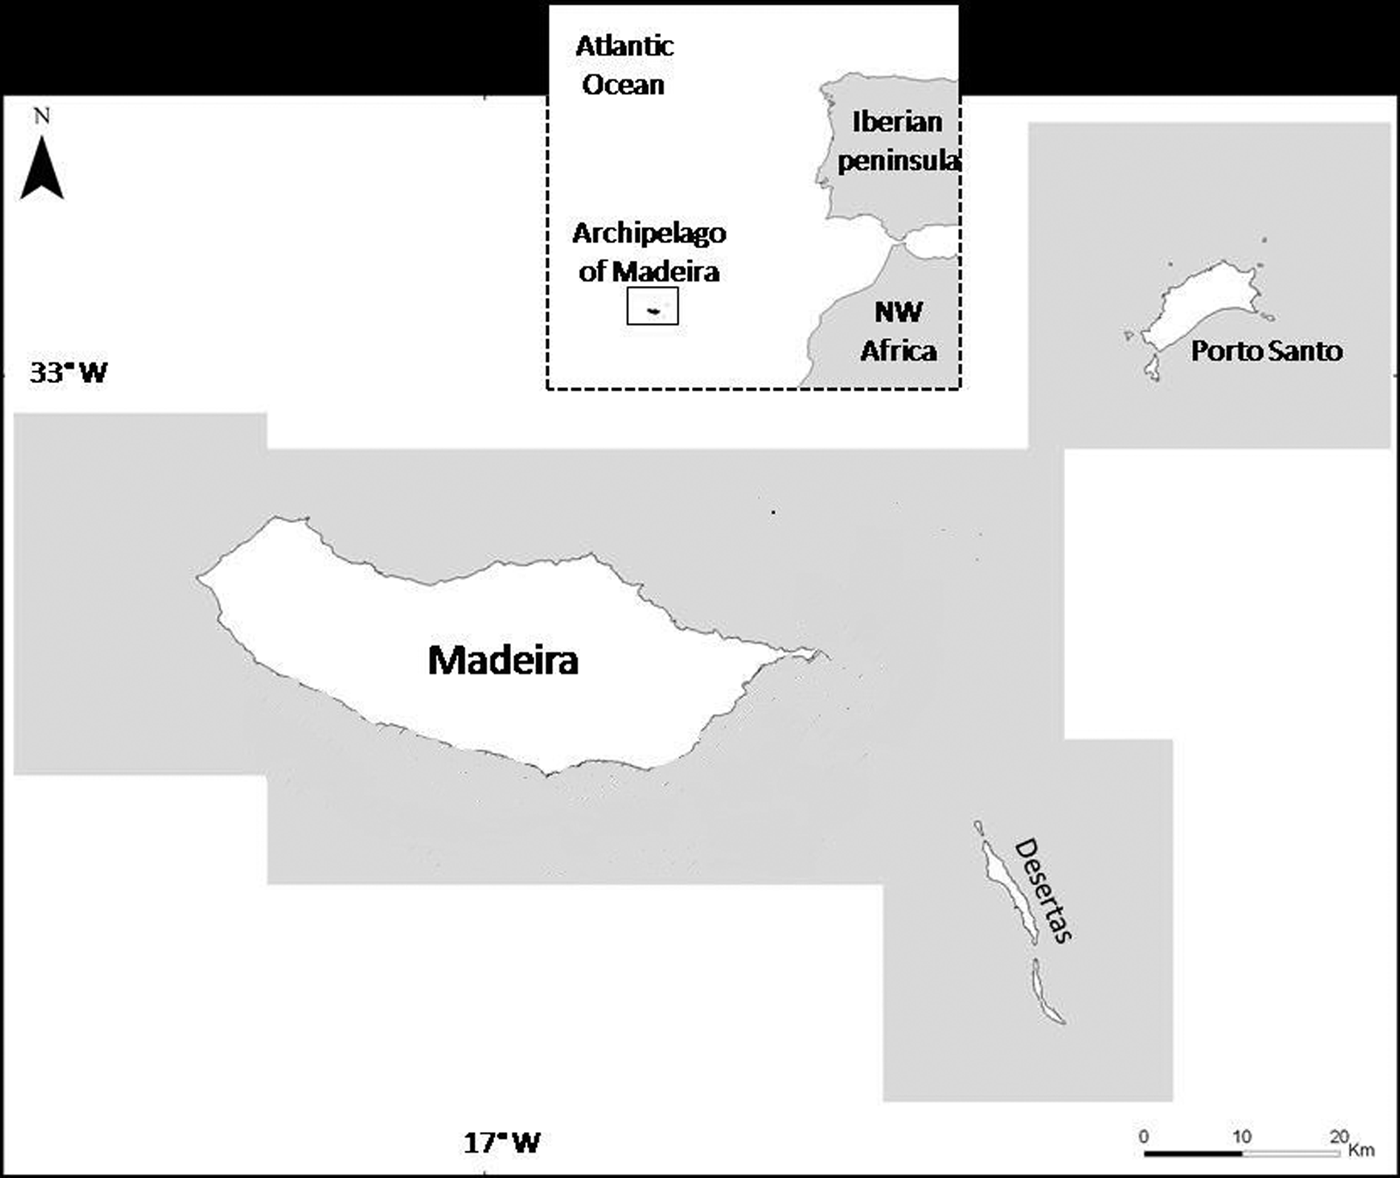
The Madeira archipelago is located in the North-east Atlantic (32°N 17°W) at ~670 km west of Morocco. It is formed of two main volcanic islands, Madeira and Porto Santo, separated by a stretch of ~50 km. It comprises also two sub-archipelagos: the Desertas Islands, located ~20 km south-east, and the Selvagens Islands located 300 km south of Madeira Island. Madeira and Porto Santo are inhabited, whereas Desertas and Selvagens are uninhabited natural reserves (Caldeira & Sangrá, Reference Caldeira and Sangrá2012). These oceanic volcanic islands have a reduced continental shelf, which results in deep waters and submarine canyons just a few miles offshore (Geldmacher et al., Reference Geldmacher, Van Den Bogaard, Hoernle and Schmincke2000), reaching depths of 3000 m. Data were recorded from boat surveys around the islands of Madeira, Desertas and Porto Santo. The study area covered 4818 km2 up to 20 km offshore (Figure 1).
Map showing Madeira archipelago and its islands, located in the North-east Atlantic (inset), and the main study area with the survey area in grey. Selvagens Islands not shown. (Adapted from Alves et al., Reference Alves, Querouil, Dinis, Nicolau, Ribeiro, Freitas, Kaufmann and Fortuna2013.)

Data collection
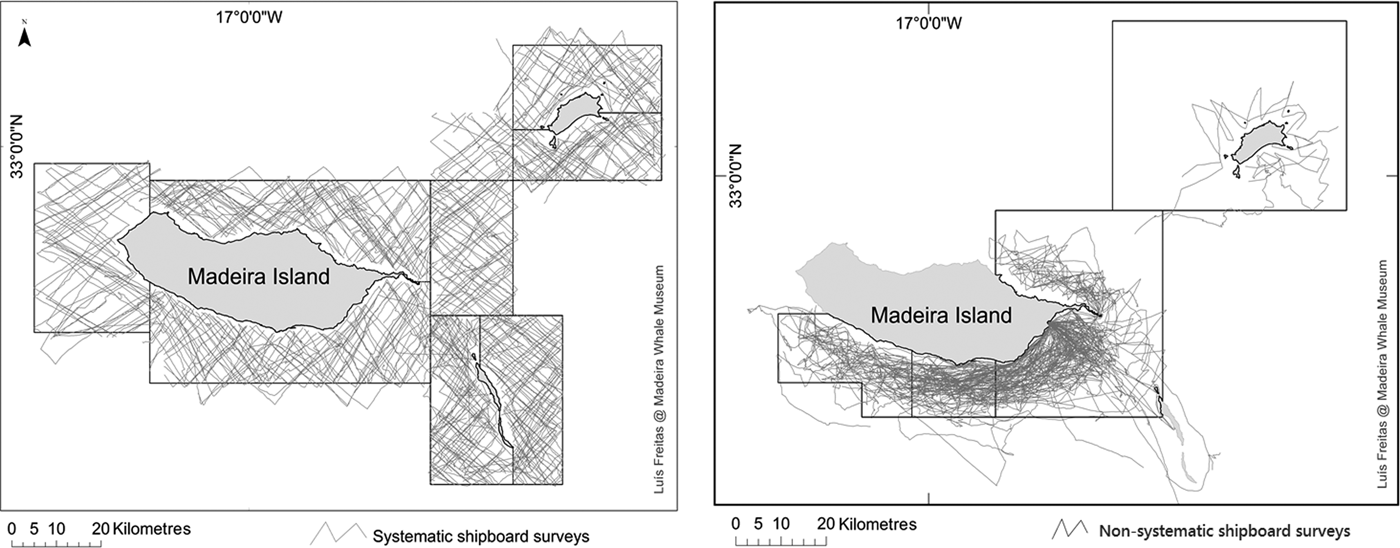
Photographs were taken on year-round systematic and non-systematic research boat surveys, as well as from whale-watching boats. One hundred and seventeen systematic surveys were carried out following predetermined line-transects. Surveys were carried out between 2001–2002 and 2004, and from 2007 to 2012. Additionally, one hundred and eighty-four non-systematic surveys were carried out between 2004 and 2012 (Figure 2). Sighting data (GPS position, initial time, best group size estimation and group composition), weather and effort information were recorded. Effort was conducted during daylight hours at Beaufort Seastate ≤3. During systematic surveys, sometimes the time available constrained the data collection of individual photographs of the entire group; as such the photographic coverage and identification of all the individuals present in the group was not always assured (for details on these surveys see Alves et al., Reference Alves, Querouil, Dinis, Nicolau, Ribeiro, Freitas, Kaufmann and Fortuna2013). In this study, the term ‘group’ was used as the sampling unit and defined as all dolphins sighted within a 100 m radius from each other (Wells et al., Reference Wells, Scott, Irvine and Genoways1987). Dolphins were classified into three categories – adults, subadults and calves according to their size, colour and behaviour. The adult class corresponded to large and robust animals. Calves were identified due to their small body size and permanent association with an adult (Mann et al., Reference Mann, Connor, Barre and Heithaus2000). The individuals with body size smaller than the adults and that were independent from an adult animal were considered subadults (Wells et al., Reference Wells, Scott, Irvine and Genoways1987). Photographs were taken using digital cameras (Nikon D2H and D700) equipped with Nikkor zoom lenses ranging between 70–400 mm in both systematic and random surveys.
Maps of survey effort within the study area from 2001–2012: systematic surveys (left); non-systematic surveys (right).

Digital photographs from different whale watching boats were also analysed. These images were obtained from 2003 to 2012 in the south coast of Madeira Island. These opportunistic platforms operate year-round, with 1–3 daily trips, with no specific target species. The photographs were taken whenever bottlenose dolphins were sighted by trained observers onboard, as well by experienced skippers.
Photo-identification
A photo-id catalogue was compiled. A dataset of capture histories was created using individual information taken from the photographs (following Würsig & Jefferson, Reference Würsig, Jefferson, Hammond, Mizroch and Donovan1990). An individual identification within an encounter was defined as a ‘capture’.
Photographs were graded as ‘good’, ‘fair’ or ‘bad’, according to their level of focus, contrast, exposure, the angle and size of the dorsal fin in the frame. Additionally, the distinctiveness of each photograph was graded as ‘very distinct’, ‘distinct’, slightly distinct’ or ‘unmarked’. All photo processing was done using Darwin 2.0 © (Eckerd College Dolphin Research Group), including cropping the dorsal fin area and adjusting light and contrast. Then a contour was drawn to the trailing edge, which is identifiable from both sides (Auger-Méthé & Whitehead, Reference Auger-Méthé and Whitehead2007), and the program compared that fin to all others stored in the database searching for a match. Only the contour was used to compare the fins; secondary features such as fin shape or scars were only used to confirm a match by naked eye. Whenever a match was found, confirmation by the researcher was made by eye, and the same identification number from the individual stored in the database was assigned. If the program did not find a match, the researcher would make another attempt of comparison by eye, with all the individuals of the catalogue, using the number of nicks on the dorsal fin. If a match still was not found, a new identification number was attributed to the individual and it was added to the catalogue. At the end all matches were confirmed by a second experienced researcher. Only good quality photographs and very distinct or distinct individuals were used in this study, in order to enhance the reliability of matches. Calves were excluded from the photo-id analysis. The proportion of well-marked individuals within groups was estimated by using good quality images showing 3–7 individuals (N = 60) in each image, and dividing the well-marked individuals by the total number of photographed individuals in the same image.
Association patterns
Data for association analysis was organized to suit the needs of the software SOCPROG 2.4 (Whitehead, Reference Whitehead2009). Sampling period was defined as a day in order to reduce the bias (Whitehead, Reference Whitehead2008) and associations defined as individuals grouped within an encounter with a group of bottlenose dolphins (sighting) (Whitehead & Dufault, Reference Whitehead and Dufault1999).
CLUSTER ANALYSIS
Association indices like the simple ratio index (SR) (Ginsberg & Young, 1992) and the half-weight index (HWI) (Cairns & Schwäger, 1987) estimate the proportion of time that pairs of individuals are associated (Whitehead, Reference Whitehead2008). The index most commonly used in the analysis of social structure in cetacean populations is the HWI (Wells et al., Reference Wells, Scott, Irvine and Genoways1987; Smolker et al., Reference Smolker, Richards, Connor and Pepper1992; Slooten et al., Reference Slooten, Dawson and Whitehead1993; Bedjer et al., Reference Bedjer, Fletcher and Bräger1998; Maze-Foley & Würsig, Reference Maze-Foley and Würsig2002). This is mainly because in photo-id it is not always possible to photograph and identify all individuals within a group, making the HWI least biased when pairs are more likely to be seen separate than together (Cairns & Schwäger, 1987). Despite this, Ginsberg & Young (1992) argued that the general use of the SR is recommended and Whitehead (Reference Whitehead2008) refers that, if association indices are compared among dyads or within populations it is more likely that the bias will be similar for all dyads, making it of least concern. The cophenetic correlation coefficient (CCC) was used to determine which type of cluster analysis was more suitable to the data. The CCC is the correlation between the actual indices of association and the levels of clustering shown in the diagram and it indicates the effectiveness of the analysis in order to separate potential dendrograms from those that are truly representative of complex social structure. A hierarchical cluster analysis was used to illustrate the relationships between dolphins. For this, only dolphins seen in associations and that had been recorded at least three times between 2001 and 2012 were used. This set of data was selected as appropriate to ensure a more accurate representation, given the range of the existing dataset. The average-linkage method using SR association indices was elected as the most appropriate when compared to single-, complete- and Ward's- linkage methods (not shown). Given that the SR provided the best CCC value, above the value that is considered to be a good fit (≥0.8) (Bridge, Reference Bridge and Fry1993), this index was chosen over the HWI.
Permutation tests were performed to assess if the dolphins showed any preferred/avoided associations, the null hypothesis being that individuals associate randomly. For the null hypothesis to be rejected, the distribution of association indices from the real data should be different from the distribution of association indices from a number of permuted datasets (Whitehead, Reference Whitehead2008). Observed SD and CV of the pairwise association indices that were significantly higher than those from permuted datasets were taken as evidence that individuals preferred or avoided companions (Whitehead, Reference Whitehead1999).
The number of permutations implemented was increased until the P value obtained from the Monte Carlo simulation stabilized and the confidence intervals decreased (Manly, Reference Manly1995; Bedjer et al., Reference Bedjer, Fletcher and Bräger1998; Whitehead, Reference Whitehead1999). Two options for permuting data in this kind of analysis were used in this study, to test for both long- and short-term associations: ‘Permuting groups within samples’ and ‘Permuting associations within samples’. The former investigates both short-term (within a sampling period) and long-term (between sampling periods) associations, while the latter investigates only for long-term associations (Whitehead, Reference Whitehead2008, Reference Whitehead2009). The same author suggested that ‘Permuting associations within samples’ is the more useful method because it has fewer assumptions and it controls for gregariousness although not for factors affecting the presence of group members (e.g. demographic effects like birth, mortality or migration).
In order to identify significant divisions within the population, modularity (Newman, Reference Newman2004) was investigated. Modularity is the difference between the proportion of the total association and the expected proportion, within the clusters. It ranges between 0.0 (randomly formed clusters) and 1.0 (no associations between members of different clusters) (Whitehead, Reference Whitehead2008). Newman (Reference Newman2004) suggests that if modularity is greater than 0.3, then the division between the clusters is ‘good’. Modularity-G (Whitehead, Reference Whitehead2008, Reference Whitehead2009) was used as it controls for differences in gregariousness.
TEMPORAL ANALYSES: STANDARDIZED LAGGED ASSOCIATION RATE (SLAR)
We used the Standardized Lagged Association Rate (SLAR) to assess the probability that two individuals associated at a given time, will still be associated at a certain time lag in the future. SLARs are plotted continuously against time lag, with a moving average method. The number of potential associations can be changed, over which the lagged associated rate and its accompanying lag are calculated. Care must be taken to find an optimal moving average that does not compromise the data, because lag will be less precise as the lagged association curve smoothes.
Like other social measures, SLARs have little value without some measures of precision. In this study a temporal jacknife was used, in which different sets of sampling periods are omitted in turn (Whitehead, Reference Whitehead2007), and implemented by SOCPROG 2.4. Jackknifing is an acceptable measure of precision even though its estimates are conservative and the assumption of independence might not be met (Whitehead, Reference Whitehead1995, Reference Whitehead2007). The inclusion of a null model provides an important basis for comparison to determine whether preferred associations are present in the population. It helps to consider what the values would be if the dolphins associated randomly. The standardized null association rate is the inverse of the number of identified individuals minus one, and does not change over time lag (Whitehead, Reference Whitehead2008).
Exponential models available in SOCPROG 2.4 were fitted to the SLAR using maximum likelihood and binomial loss. All SLAR models were fitted to the curve and the best-fit model was chosen as that with the lowest Quasi Akaike Information Criteria (QAIC) value following Burnham & Anderson (Reference Burnham and Anderson2002).
Data from 2004 to 2012 were used to access the temporal pattern of the social structure and comprised all sighting histories independently of the number of times sighted. This is mainly because the SLAR is meant to describe temporal associations between the entire population, and not just those associations within the individuals encountered more often (Whitehead, Reference Whitehead2008). Additionally, given the small sample size, the proportion of the group photographed in each sampling period was not a restricting factor in order not to bias the SLAR analyses.
RESULTS
Photo-identification surveys
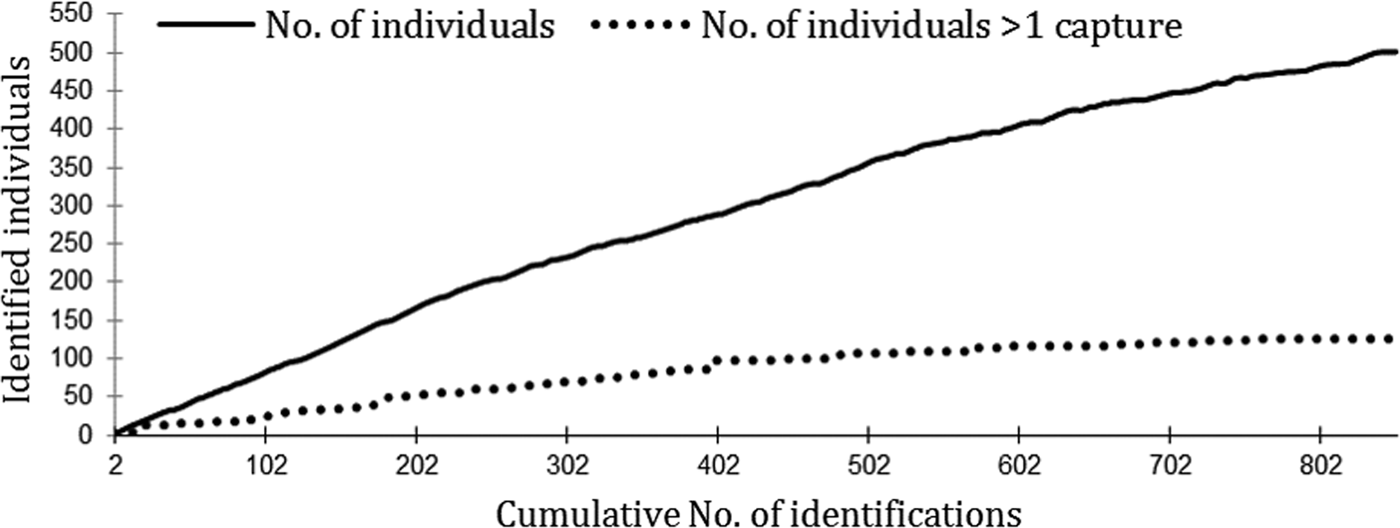
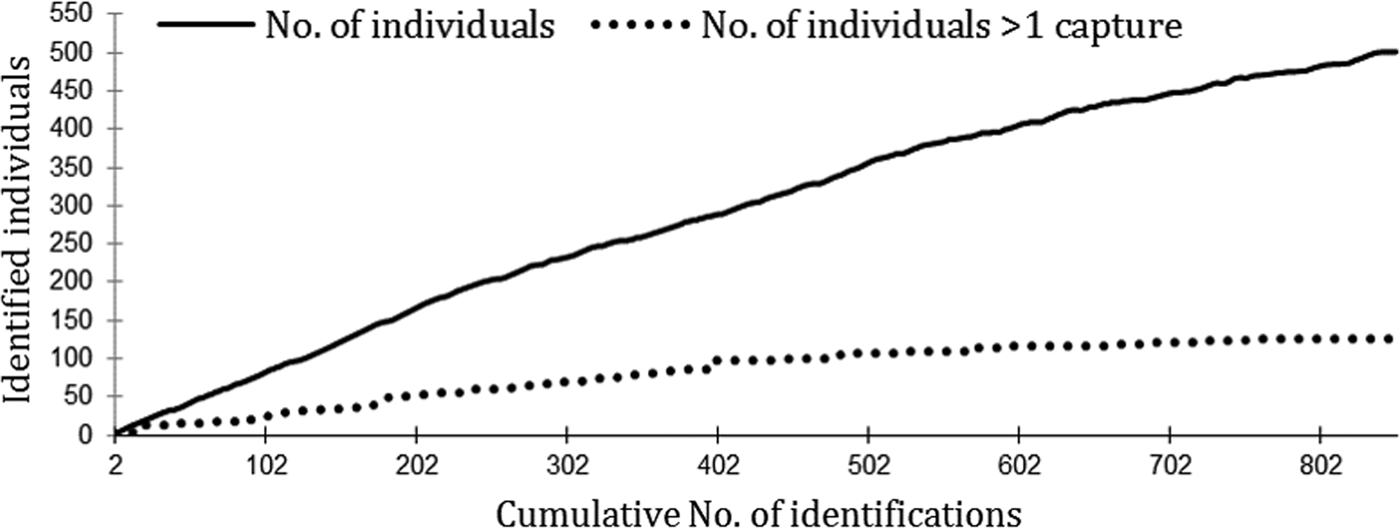
Between 2001 and 2012, there were 272 encounters occurring in 231 different sampling days; these included both dedicated effort and opportunistic whale-watching trips. Individual sighting histories varied greatly during the entire study period, ranging from individuals sighted only once to individuals seen up to 13 times (median = 2). A total of 501 individuals were identified and catalogued, based on the marks of their dorsal fin. The discovery curve for the overall number of individuals increased throughout the study period as new individuals kept being added to the catalogue. This result suggests an open population with regular recruitment of new animals to the study area. On the contrary, the discovery curve for re-sighted individuals seemed to stabilize, as less previously identified individuals were being added to the catalogue (Figure 3). After applying constraints for photographic quality and individual distinctiveness, the sample used in the analysis was restricted to 301 individuals. The proportion of well-marked individuals within the groups was estimated to be 68%.
Discovery curve of the total number of marked individual dolphins (solid line) and the total number of individuals captured >1 time (dotted line).
Association patterns
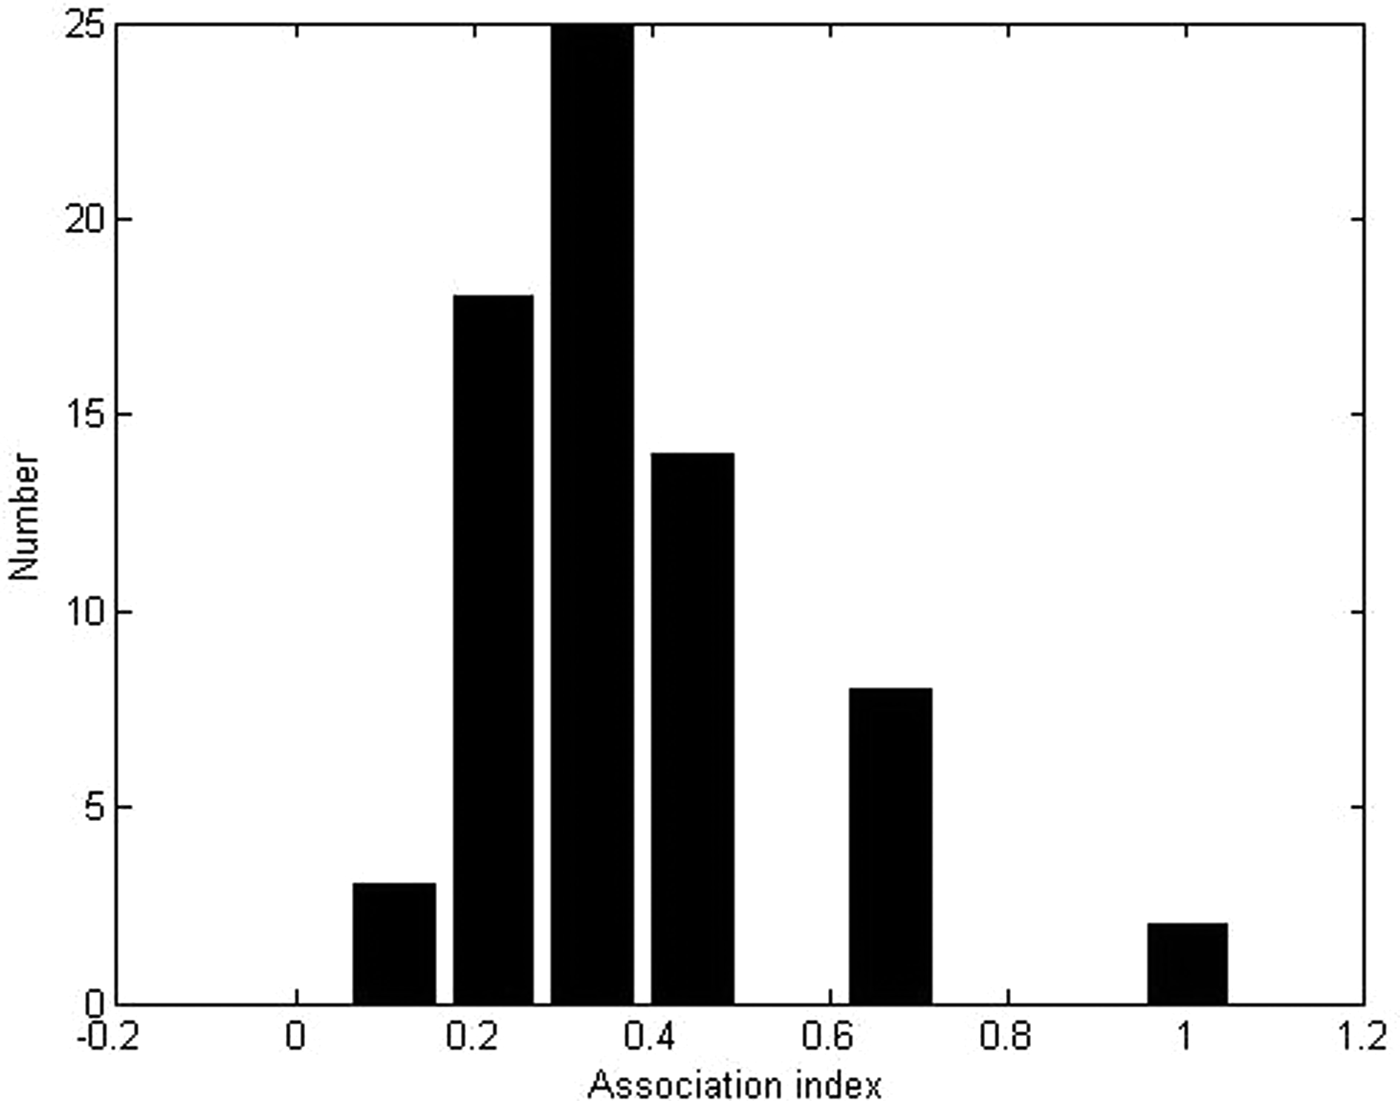
Seventy dolphins were captured on three or more occasions. The overall mean association index was 0.03 (range = 0.01–0.06; SD ± 0.01) suggesting that, in general, associations within the population were low. Also, the maximum association index for each individual had a low average of 0.38 (range = 0.17–1.00; SD ± 0.18). The maximum association index of 1.00 was recorded for just two individuals (Tt074 and Tt078) that showed a strong dyadic association (Figure 4).
Distribution of the maximum association index for distinctive individuals, captured ≥3 times in the study area.

Permutation tests for non-random associations indicated that in general, the dolphins recorded in this study did not associate preferentially with, nor avoided other individuals. Higher SD and CV values of the real data over the permuted data were non-significant, for both permuted tests (short-term and long term associations) (not shown). As such, the null hypothesis that individuals associate randomly was not rejected. The permutation test supported these findings, given that no dyads were seen to be significantly different from the permuted data.
CLUSTER ANALYSIS
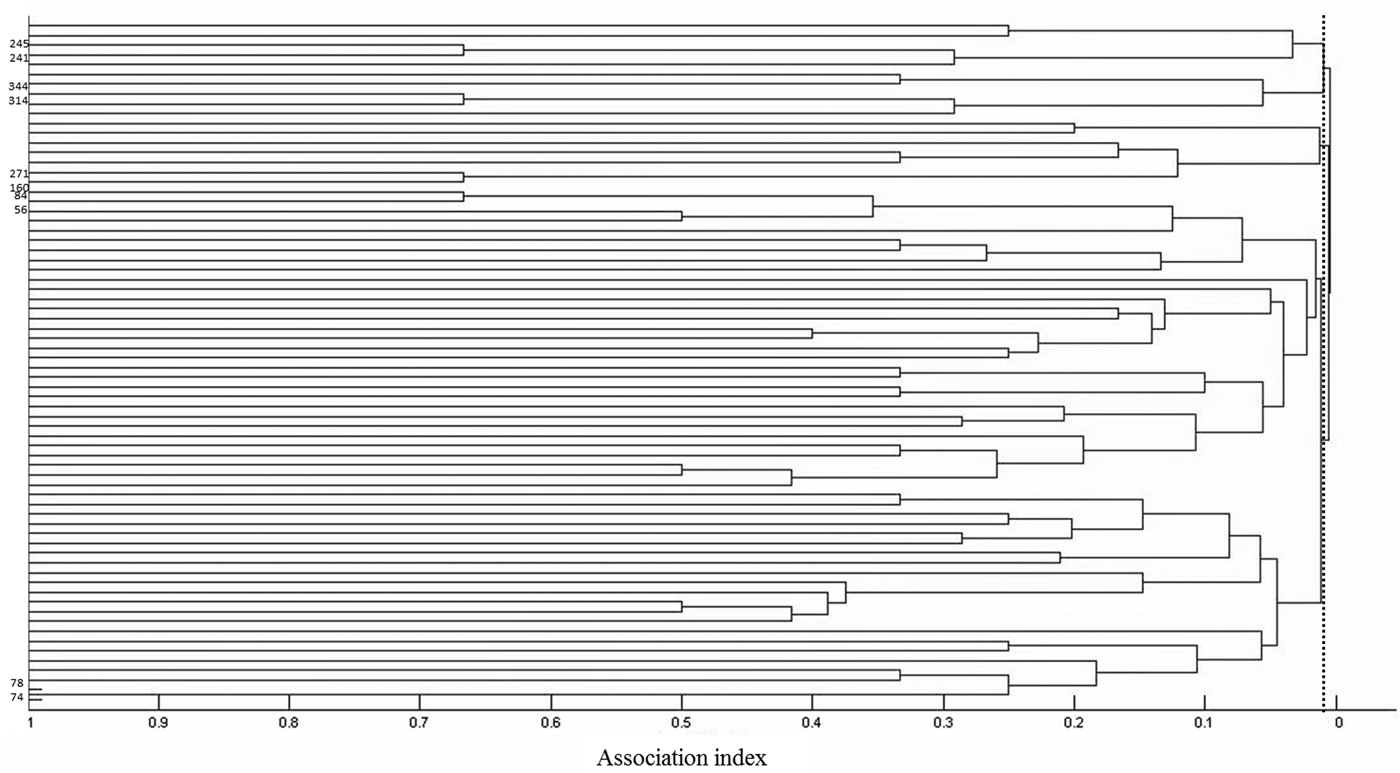
The dendrogram produced (Figure 5) was considered representative of the structure within the studied population (CCC = 0.806). All individuals were found to be associated at an association index of <0.05. Modularity-G (peak at 0.477) suggest that the best community division is at association index (AI) of 0.023. Applying the variable stopping rule at AI with maximum modularity value to the dendrogram, resulted in a rapid agglomeration of observed dyads, triads and their multiple networks, from which it becomes impossible to distinguish separate groups. There is no evidence that large groups or clusters forming a significant level of organization exist and much of the division within this population is based on different patterns of identification, rather than preferential companionships. However there was a dyad of dolphins that was always seen together (ID Tt074 and Tt078; AI = 1; N = 3 times) and some dyads of dolphins spend more time together than with other individuals. Those dyads refer to dolphins Tt241-Tt245; Tt314-Tt344; Tt160-Tt271 and Tt056-Tt084 with an AI of 0.67. This hierarchical cluster analysis indicates that the level of fidelity and companionship within this population is low.
Dendrogram of bottlenose dolphins in Madeira archipelago using hierarchical cluster analysis. The average linkage and the Simple Ratio Index for association for individuals seen ≥3 times from 2001–2012 is shown. The dotted line represents cluster division resulting from Modularity-G method. The dyads with AI ≥0.67 are represented by their ID numbers on the Y axis.

TEMPORAL ANALYSES: STANDARDIZED LAGGED ASSOCIATION RATE (SLAR)
A total of 291 individuals recorded during 108 encounters, corresponding to 101 days, from 2004 to 2012 were used to assess the temporal pattern of the social structure.
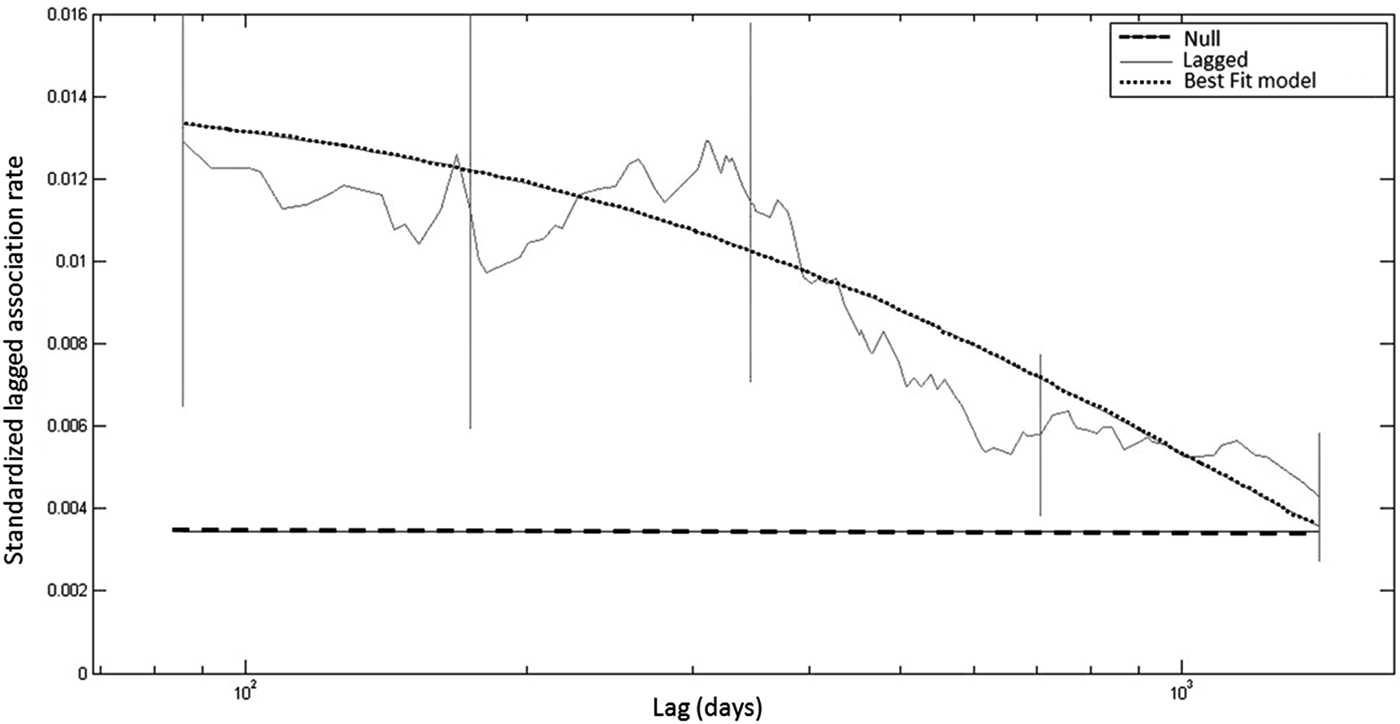
The model fit to the SLAR that best described this bottlenose dolphin population was ‘casual acquaintances’ (Whitehead, Reference Whitehead1995) (Table 1; Figure 6). An analysis of the rates of associations between individuals over time showed that the SLAR line starts to decrease at ~500 days and reaches the null rate confirming the presence of random associations given by the permutation tests made in the cluster analysis. The associations were estimated to last for 998 days (2.7 years) (Figure 6). The social-system model that best fits the SLAR curve indicates casual acquaintances in a large population, possibly including rapid disassociations. However, a second model also strongly supported the SLAR (ΔQAIC = 1.60) and it suggests two levels of acquaintances: a short, casual level of association and a longer-term, as described by Whitehead (Reference Whitehead2008). A visual inspection of the data used to generate the SLAR indicates that a small number of individuals seem to have longer associations. For example individuals Tt074 and Tt078 were seen together twice in the same year (2005) and once 5 years later (2010) (AI = 1). Eight individuals (Tt056; Tt084; Tt160; Tt241; Tt245; Tt271; Tt314 and Tt344) had an association index of 0.67, which indicates that for more than 30% of the time they were seen associated with the same individual. However, when using LARs or SLARs to address the temporal nature of relationships it is important to make sure the results are consistent with those obtained through other methods like cluster analysis (Whitehead, Reference Whitehead2008). Hence, in accordance with the results obtained by the cluster analysis that showed an overall low association index, the model that uses casual acquaintances to explain social structure in this population was chosen despite some slight variation in association patterns between the individuals used in this analysis.
SLAR for bottlenose dolphins captured between 2004–2012 using a moving average of 3000 associations. Estimated SE bars were produced by jackknifing on each sampling period. The best-fit model suggests casual acquaintances and was obtained using maximum likelihood methods. The null association rate represents the expected value of the SLAR if there was no preferred association and is included for reference.

Exponential models using maximum likelihood and binomial loss, used to describe the temporal pattern of associations of bottlenose dolphins in Madeira. The best model corresponds to that with lower ΔQAIC value (highlighted in bold).

DISCUSSION
Photo-identification
There is strong evidence that bottlenose dolphins occurring in the archipelago of Madeira belong to an open population with regular recruitment of new animals to the area. The discovery curve for new individuals does not seem to stabilize, and thus more new individuals are expected to be captured. The large size of the study area may have contributed to this high number of catalogued individuals. Extending the survey area to all three islands (Madeira, Desertas and Porto Santo) allowed a higher chance of capturing transients or dolphins from other communities, as mentioned by Silva et al. (Reference Silva, Prieto, Magalhães, Seabra, Santos and Hammond2008) referring to the archipelago of Azores. Nonetheless, the curve of the number of animals with more than one capture (recaptures) seems to be reaching a plateau in the last year of the study. This means that there might not be many more individuals with a strong site-fidelity available to be captured in the study area, as well as that their number is low compared with the number of dolphins in the catalogue. The variations in the time gap between many of the re-sightings of identified individuals in the study area suggested that the Madeira archipelago represents part of a larger home range within the North-east Atlantic. A genetic study by Louis et al. (Reference Louis, Viricel, Luca, Peltier, Alfonsi, Berrow, Brownlow, Covelo, Dabin, Deaville, de Stephanis, Gally, Gauffier, Penrose, Silva, Guinet and Simon-Bouhet2014), investigating habitat driven population structure of bottlenose dolphins within the North-east Atlantic, found that individuals sampled in Azores were part of the same population (i.e. shared the same genetic structure) as individuals identified in the European continental shelf, despite the large distance that separate those two places. The lack of genetic differentiation between bottlenose dolphins’ populations of Madeira and Azores (Quérouil et al., Reference Quérouil, Silva, Freitas, Prieto, Magalhães, Dinis, Alves, Matos, Mendonça, Hammond and Santos2007) supports a similar scenario occurring in the present study, with a small percentage of individuals showing some degree of residency and the majority of the individuals being transients or migrants that move in a much wider area than the study area.
Association patterns
The results from the dendrogram showed that the overall association index of the dolphins was low and that there was no clear structure in the social organization. The dolphin population presented a dynamic and fluctuating social structure. Given the pelagic nature of the marine environment of Madeira archipelago, this finding is not unexpected. Highs level of associations in bottlenose dolphin populations seems to be more common in more enclosed environments, such as estuaries, bays and fjords (Lusseau et al., Reference Lusseau, Schneider, Boisseau, Haase, Slooten and Dawson2003). The high association levels in more enclosed communities could be partially due to the topographic features that could pose difficulties for neighbouring communities to meet (Lusseau et al., Reference Lusseau, Schneider, Boisseau, Haase, Slooten and Dawson2003; Merriman, Reference Merriman2007). Nonetheless, this scenario does not apply to an open oceanic habitat. Despite the low AI found in this study, there were two dolphins that were never seen apart and several others that revealed a higher AI than the overall mean, suggesting longer-term relationships. Some stable associations among pairs or even trios of individuals have been documented in various populations of bottlenose dolphins, although there appears to be considerable variability among populations in the types and degree of such stables associations (Connor et al., Reference Connor, Wells, Mann, Read, Mann, Connor, Tyack and Whitehead2000).
Gender seems to be an important feature driving these associations, as sex-specific bonds are reported for this species in some long-term studies (Connor et al., Reference Connor, Wells, Mann, Read, Mann, Connor, Tyack and Whitehead2000). The same authors point out that determining the sex of bottlenose dolphins in the field is difficult given the lack of dimorphism in adults. Often sex determination is limited to individuals presumed to be females because of the consistent proximity of a small calf. That was the case in this study, only a few individuals were assumed to be females, although such estimations were not used here.
Prey type may also play an important role in shaping school size and in the decision making with regard to leaving or joining schools, as suggested by Lusseau et al. (Reference Lusseau, Williams, Wilson, Grellier, Barton, Hammond and Thompson2004). Bottlenose dolphins are often reported to circle around fish schools, with one or a few individuals at a time preying on the fishes (Connor et al., Reference Connor, Wells, Mann, Read, Mann, Connor, Tyack and Whitehead2000). The Madeira archipelago is an open water habitat allowing bottlenose dolphins to pursue schooling as well as pelagic solitary prey throughout the water column.
The results of the permutation test did not lead to the rejection of the null hypothesis, suggesting that random associations persist in the bottlenose dolphins population studied in Madeira. Similarly, the temporal analysis also indicated the presence of random associations over time. The decline of the SLAR curve after ~500 days (1.4 years) suggests disassociation over that time period which can be explained by demographic events such as mortality or emigration (Whitehead, Reference Whitehead2008). However, the associated SEs on the SLAR are quite large, so it should be noted that these are general trends that cannot predict the association pattern of all individuals at all times.
A study carried out on bottlenose dolphins in the outer Moray Firth (Eisfield & Robinson, Reference Eisfield and Robinson2004) obtained similar results to those presented here. The authors found no clear architecture or division of groups except for dyads and triads with random associations. Identical results were found in the Shannon Estuary, Ireland, where social structure in a smaller population of dolphins was found to be highly fluid, within which individuals change their composition and associates regularly (Foley et al., Reference Foley, MacGrath, Berrow and Gerristsen2010). Similarly, focal follows studies in Shark Bay, Australia describe changes in group composition occurring on average three or four times per hour (Connor et al., Reference Connor, Wells, Mann, Read, Mann, Connor, Tyack and Whitehead2000). More uncommon perhaps in this species are the results of Lusseau et al. (Reference Lusseau, Schneider, Boisseau, Haase, Slooten and Dawson2003) (Doubtful Sound, New Zealand) and Augusto et al. (Reference Augusto, Rachinas-Lopes and dos Santos2012) (Sado Estuary, Portugal) that demonstrated a unique fission-fusion social structure, as long lasting associations were a strong feature of these communities.
To summarize, bottlenose dolphin social structure can vary drastically, from being mainly driven by constant companionship to featuring mostly acquaintances that last only a few days (Lusseau et al., Reference Lusseau, Wilson, Hammond, Grellier, Durban, Parsons, Barton and Thompson2006). It would be useful to examine if different segments of the populations show different patterns of interactions, like sex-related relationships. That would be interesting future research in this population present in Madeira.
It is important to highlight that the association indices reported here can be negatively biased, mostly due to the inherent difficulties of the methodology applied (Stevick et al., Reference Stevick, Palsbøll, Smith, Bravington and Hammond2001); those difficulties lie mainly in the inability to photograph each individual present during each encounter. In addition, as the study was restricted only to well-marked individuals. Potential associations between unmarked individuals (like calves and juveniles) and the rest of the population is not being accounted for. Mother/calf pairs of bottlenose dolphins living in a fission-fusion community are expected to present long-term associations as calves are known to stay with their mother for up to 8 years after birth (Greiller et al., Reference Greiller, Hammond, Wilson, Sanders-Reed and Thompson2003).
In conclusion, this population exhibits a fission-fusion society predominantly formed of short-term acquaintances with only a few long-lasting associations, apparently similar to more coastal communities of bottlenose dolphins like the ones in Sarasota Bay, Florida (Wells et al., Reference Wells, Scott, Irvine and Genoways1987) or in the Scottish east coast (Lusseau et al., Reference Lusseau, Wilson, Hammond, Grellier, Durban, Parsons, Barton and Thompson2006). Understanding the social relationships among individuals is important to define management guidelines for this population of bottlenose dolphins in Madeira.
ACKNOWLEDGEMENTS
We wish to thank João Viveiros, Miguel Silva, Hugo Vieira, Filipe Nóbrega, Ana Higueras, Nuno Marques, Marianne Böhm-Beck, Jonatan Svensson, Virginie Wyss, Daniel Martins and Mafalda Ferro for fieldwork assistance; Carlos Silva, Rita Ferreira, Luís Dias, Raquel Marques, Claudia Gomes and Rafael Gomes who contributed with photographs. We thank Manuel E. Dos Santos and one anonymous reviewer for helpful comments on the manuscript.
FINANCIAL SUPPORT
This work was carried out by the Madeira Whale Museum and funded by the Município de Machico, LIFE and FEDER/INTERREG III-B EU programs, during projects CETACEOS MADEIRA (LIFE99 NAT/P/006432), MACETUS (MAC/4.2/M10), EMECETUS (05/MAC/4.2/M10) and CETACEOS MADEIRA II (LIFE+ NAT/P/ 000646); and by the Portuguese Foundation for Science and Technology (FCT), project GOLFINICHO (POCI/BIA-BDE/61009/2004). Recent re-analysis, final write up and revision phases carried out by the first author had the support of a post-doc grant from ARDITI – Madeira’s Regional Agency for the Development of Research, Technology and Innovation, project M1420-09-5369-FSE-000001.