Introduction
Despite interdisciplinary efforts by those in public health and basic sciences, Chagas disease caused by the protozoan Trypanosoma cruzi (T. cruzi) continues to be a serious problem in Latin America (Cucunubá et al. Reference Cucunubá2016). One of the most complex aspects of this pathology is its diagnosis. This complexity is due largely to the dynamics of intermittent parasitaemia in the different phases of the disease (Hernandez and Ramirez, Reference Hernandez and Ramirez2013; Hernández et al. Reference Hernández2016a). Because parasitaemia is elevated during the acute phase, detection during this phase is based on the direct methods that allow observation of the parasite (Feilij et al. Reference Feilij, Muller and Gonzalez Cappa1983). In contrast, during the chronic phase, the parasitaemia drastically decreases, and therefore the diagnosis is based on the detection of antibodies by serological tests (Bern et al. Reference Bern, Longo and Bern2015). However, there has not been a single diagnostic test that allows the detection of the parasite in both phases: direct observational methods cannot detect the low and intermittent parasitaemias of the chronic phase, and serology is positive in patients in the acute phase only after a delay. A single test is required not only for diagnosis, but also for monitoring the effectiveness of the treatment. In the last decade, quantitative real-time PCR (qPCR) with Taqman probes (hydrolysis probes) has been shown to be the most relevant test that allows the detection and quantification of the parasite in all clinical phases of the disease and is also useful to monitor the effectiveness of the aetiological treatment (Duffy et al. Reference Duffy2009; Duffy et al. Reference Duffy2013; Moreira et al. Reference Moreira2013; Bianchi et al. Reference Bianchi2015; Morillo et al. Reference Morillo2015; Ramírez et al. Reference Ramírez2015; Hernández et al. Reference Hernández2016a, Reference Hernándezb).
The qPCR test has been validated for analytical use, and its diagnostic validation has recently been published. It is considered a test with high potential for the diagnosis of Chagas disease in the acute phase, given its reported high specificity and sensitivity of 88–100%. It may also be a complementary method for use during the chronic phase, with a sensitivity of 60–80% (Ramírez et al. Reference Ramírez2015; Hernández et al. Reference Hernández2016a). Sample preparation requirements of the qPCR, such as the addition of 6 M guanidine hydrochloride to the blood sample prior to processing, provide advantages such as release and preservation of the parasite DNA at room temperature, and increased sensitivity of the test compared with the use of untreated whole blood (Brasil et al. Reference Brasil2010). However, there are obstacles to the routine use of guanidine hydrochloride: commercial collection tubes with this added reagent are not available; its cost is high; and its preparation is limited to reference centres. Because of this, it is difficult to obtain in rural areas, limiting the use of molecular diagnosis in scenarios such as outbreaks of oral transmission where diagnosis is required urgently given its elevated lethality (Ramírez et al. Reference Ramírez2013; Hernández et al. Reference Hernández2016b). Then, an alternative test sample to whole blood treated with guanidine hydrochloride would be valuable.
Considering that serum samples are routinely used for multiple diagnostic tests and are therefore regularly available, there has been a need to study the use of this sample in molecular tests that allow the detection of T. cruzi DNA, which would be very useful in scenarios in which it is not possible to obtain blood samples in guanidine. However, to date, there is only one study that investigated the use of qPCR in serum compared with whole blood samples for the detection of T. cruzi. This study showed, in samples from Brazilian patients in the chronic phase of Chagas disease, that parasite DNA can be detected in serum samples. Nevertheless, the main limitations of this study were the low number of samples used and that all the patients tested were in the chronic phase of the disease (Melo et al. Reference Melo2015). Therefore, the objective of this study was for the first time to compare and evaluate the concordance of the detection and quantification of T. cruzi DNA by qPCR, in serum and in blood samples in 6 M guanidine hydrochloride [guanidine-EDTA blood (GEB)], in patients from all the known clinical phases of Chagas disease (acute, chronic undetermined and chronic determined).
Materials and methods
Participants
One hundred and sixty-nine patients with Chagas disease were included in this study. The inclusion criteria were as follows: (i) not having received treatment with benznidazole and/or nifurtimox; (ii) positive results in direct parasitological tests (micro-strout, strout, culture or smears) and/or two serological tests [immunofluorescence assay test (IFAT), enzyme-linked immunoabsorbant assay (ELISA), haemagglutination indirect assay (HIA)]; (iii) positive result for qPCR and parasitaemia quantification in blood; (iv) availability of serum and GEB samples taken at the same time; vs have signed the informed consent.
Ethics approval and consent to participate
The Technical Research Committee and Ethics Research Board at the National Health Institute in Bogotá, Colombia approved the study protocol CTIN-014-11. Participation was voluntary and patients were asked for informed written consent authorizing the collection of blood and serum samples and access to information in their clinical records.
Sample collection
Serum samples were collected by centrifugation for 10 min at 1500 g of whole blood in BD Vacutainer® Serum Separator Tubes II. The serum obtained was frozen (−20 °C) until processing. In addition, a 10 mL blood sample was collected from all patients. Blood samples were mixed with an equal volume of 6 M guanidine HCl–0.2 M EDTA solution, immediately after sample collection. The GEB mixture was then maintained at room temperature and later stored at 4 °C until DNA extraction.
Clinical classification
The patients were classified according to clinical phase: acute, chronic symptomatic and chronic asymptomatic. The patients suspected of acute phase disease showed fever for more than 7 days and/or liver or spleen enlargement and were confirmed by positivity in parasitological or in serological tests (Shikanai-Yasuda and Carvalho, Reference Shikanai-Yasuda and Carvalho2012; Hernández et al. Reference Hernández2016a, Reference Hernándezb). The patients in chronic phase of disease were confirmed by positivity in two serological tests and were classified as ‘determined’ when having symptoms related with Chagas disease and ‘undetermined’ when not having symptoms.
Laboratory tests
The diagnosis of patients included in this study was performed by parasitological and serological tests. The parasitological tests that were applied to samples from suspected cases of acute phase of Chagas disease were strout, micro-strout, blood thick smear or haemoculture according to the methodology described by Feilij et al. (Reference Feilij, Muller and Gonzalez Cappa1983); Hernández et al. (Reference Hernández2016a). The serological tests used in this study were ELISA, IFAT or HIA as described by López et al. (Reference López1999).
DNA extraction
Serum and GEB samples were processed using the High Pure PCR Template Preparation kit (Roche Diagnostics, Basel, Switzerland). Before the extraction, 5 µL of linearized internal amplification control (IAC) (40 pg µL−1) was added to 100 µL of binding solution and 300 µL of GEB or serum and the mix homogenized. The solution was further mixed with 40 µL of proteinase K (20 mg mL−1) by vortexing for 15 s, centrifuged and incubated at 70 °C for 10 min in a dry thermo-block. After centrifugation, 100 µL of isopropanol was added, the sample was vortexed for 15 s and centrifuged. Each sample was loaded into an extraction column placed into a 2 mL microtube. The content was centrifuged at 3500 g for 1 min. The extraction column was placed into a new collection tube. Inhibitor removing solution (500 µL) was added to each column and centrifuged as described before. The column was placed into a new tube. Washing solution (500 µL) was added to the column and centrifuged as described before. The column was placed into a new tube and the washing step was repeated. The column was placed into a 1.5 mL microtube and centrifuged at a maximum speed for 10 s. Pre-heated elution buffer (100 µL) was added to the column and centrifuged as previously described (50 µL of pre-heated elution buffer was used for serum samples). The eluate was stored at −20 °C. To build the standard curves for the quantification of parasitic load, DNA from 10-fold serial dilutions of blood and serum spiked with T. cruzi epimastigotes was obtained (Duffy et al. Reference Duffy2013; Melo et al. Reference Melo2015). To avoid contamination, a maximum of 12 samples at a time were extracted. Negative controls (GEB or serum from a seronegative patient and without risk factors) and a reagent control (water) were included.
Multiplex real-time PCR assay using TaqMan probes for quantification of T. cruzi satellite DNA (qPCR)
The qPCR reactions were carried out with 5 µL of resuspended DNA, using FastStart Universal Probe Master Mix (Roche Diagnostics) in a final volume of 20 µL, using PCR mix conditions described by Hernández et al. (Reference Hernández2016a). For the detection of T. cruzi, the primers Cruzi 1 (ASTCGGCTGATCGTTTTC) and Cruzi 2 (AATTCCTCCAAGCAGCGGATA) and the probe Cruzi 3 (FAM-CACACACTGGACACCAA-NFQ-MGB) were used. For IAC amplification, the primers IAC-Rv (CTCCCGCAACAAACCCTATAAAT) and IAC-Fw (ACCGTCATGGAACAGCACGTA) and the probe IAC (VIC-AGCATCTGTTCTTGAAGGT-NFQ-MGB) were used. Optimal cycling conditions were 10 min at 95 °C followed by 40 cycles of 95 °C for 15 s and 58 °C for 1 min (fluorescence detection). The amplifications were carried out in an ABI7500 Real-Time PCR instrument (Applied Biosystems, USA).
Standard curves were constructed with 1/10 serial dilutions of total DNA obtained from GEB, and serum samples spiked with 106 parasite equivalents mL−1 of blood to 10−1 parasites equivalents mL−1. TcI DTU strain (MHOM/CO/01/DA) was used for the standard curve (Hernández et al. Reference Hernández2016a). The results were considered positive and quantification was performed when the amplification exceeded the threshold of fluorescence 0.01 and the dynamic range for quantification was 10−1–104 parasite equivalents mL−1. Negative results were confirmed when the cycle of threshold (Ct) for IAC was between 19 and 28. DNA from serologically negative blood was used as a negative control and DNA from an acute patient with a positive blood smear was used as a positive control. All samples were performed in duplicate.
Statistical analysis
Qualitative variables were expressed as proportions and quantitative variables in medians [percentile 25th–percentile 75th (p25–p75)]; the Mann–Whitney U test was used to compare quantitative variables, and the χ 2 test to compare qualitative variables; degree of correlation between numerical variables was established with Pearson´s coefficient (Minitab®, Version 18). As a measure of central tendency, a Kruskal–Wallis test was conducted (Minitab®, Version 18). Orange-Data Mining Fruitful and Fun® Version 3.5 free software was used to identify and graph similarities and possible clusters between the measurements made in GEB (qPCR_GEB: parasite load in GEB samples, qPCR_Ct_GEB: cycle of threshold of qPCR for T. cruzi in GEB samples, qPCR_IAC_GEB: cycle of threshold for IAC in GEB samples) and serum (qPCR_Serum: parasite load in serum samples, qPCR_Ct_Serum: cycle of threshold of qPCR for T. cruzi in serum samples and qPCR_IAC_Serum: cycle of threshold for IAC in GEB samples). A principal components analysis (PCA) was performed with Varimax rotation (Pearson, n-1) to evaluate if the previously identified conglomerates conformed to one or more factors; eigenvalues >1 were determined to extract factors, and factors that represented more than 80% of variance were evaluated to identify variables of which they were composed (JASP-Free Statistical Software®, Version 0.8.2.0). Finally, a Bland and Altman graph was used to determine the degree of agreement between GEB and serum measurements (XLSTAT-Miner 3D®, Version 2016.02.27444).
Results
Detection of T. cruzi by qPCR positive rate, parasite loads and Ct: comparison between GEB and serum samples from all patients
Of the 169 patients included in the study, 24 were in the acute phase and 145 in the chronic phase. The median age (percentiles 25–75) was 48 years (36.5–59), with no statistical difference when comparing men and women. Two positive serological tests were recorded for 98.2% (166/169) of the patients, and the three remaining patients were in the acute phase of the disease, and were diagnosed with positive parasitological tests. A positive qPCR result was observed in 80% of serum samples (135/169). Amplification of the IAC produced results within the range required to validate the results (20–28), although the median Ct in GEB was 20.00 and in serum 22.25, presenting a statistically significant difference (P < 0.001).
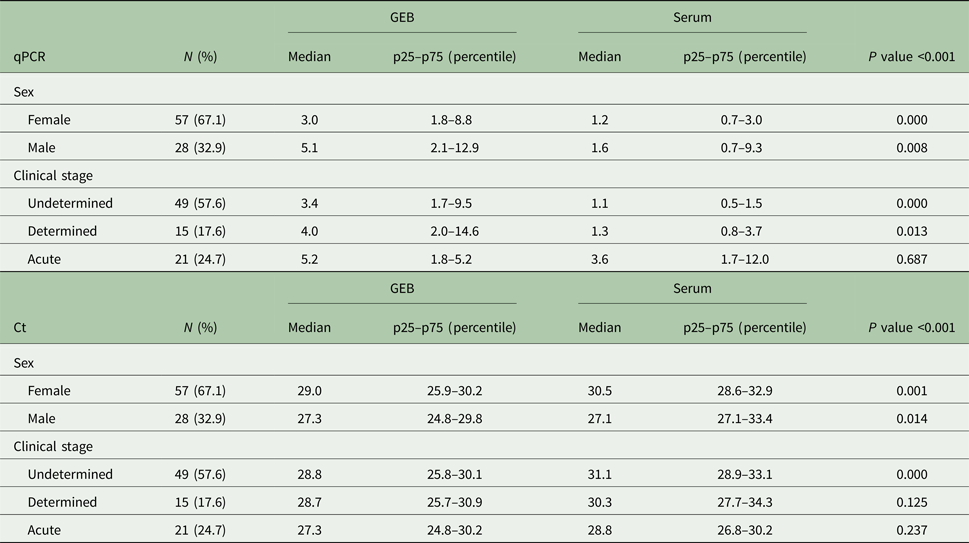
The mean Ct for T. cruzi in GEB samples was 28.2 (25.6–30.2), and in serum samples, it was 30.1 (28.1–32.9). A statistically significant difference was found between the two sample types (P < 0.001). Parasite loads in the positive serum samples were unable to be quantified in 37.0% (50/135) of samples because the parasitaemia was below the limit of quantification, that is 0.1 parasite equivalents mL−1, and Ct was higher than 35.0. In the 63.0% (85/135) of samples where quantification was possible, the median parasite load was 1.3 (0.7–3.6) parasite equivalents mL−1, whereas in the GEB samples, a median parasitaemia of 3.9 (1.8–10.2) parasite equivalents mL−1 was observed. This represented a statistically significant difference between the parasite loads according to the type of sample (P < 0.001). In addition, statistically significant differences were observed when comparing the medians of parasite and Ct loads in both male and female patients (Table 1).
General characteristics of the population tested. The medians of parasitaemia (equivalents mL−1) and cycle of threshold (Ct), in blood and serum were compared independently in the samples obtained from men or women and in each stage of the infection.

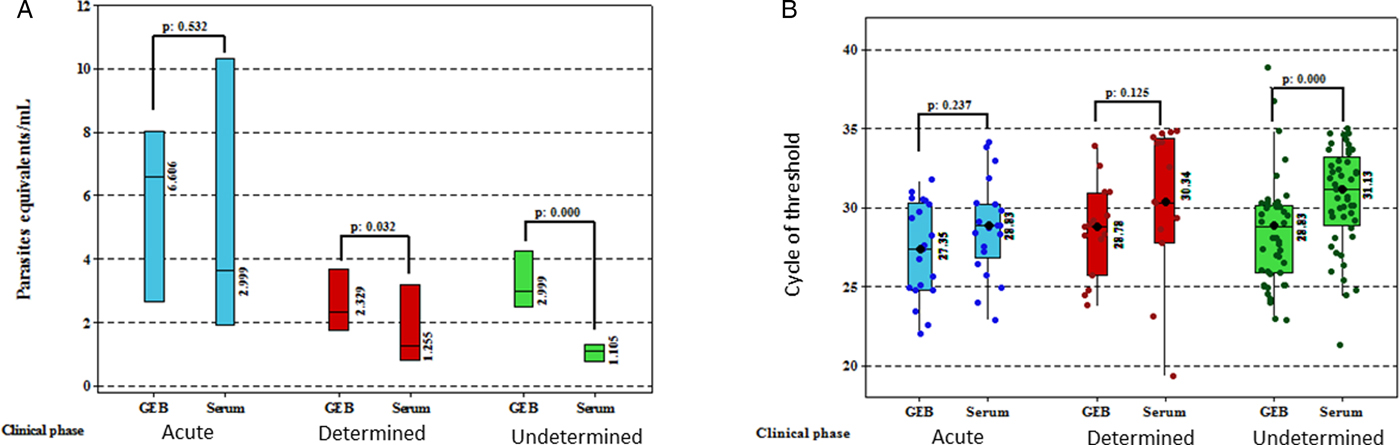
The medians (p25–p75) of parasitaemia in blood and serum were compared in the three stages of the infection (Mann–Whitney U test). In the acute phase, GEB and serum were 5.24 (1.84–10.52) and 3.67 (1.70–12.03) (P value: 0.687); in the determined, GEB and serum were 4.00 (2.0–14.6) and 1.25 (0.8–3.7) (P value: 0.013); in the undetermined, GEB and serum were 3.43 (1.74–9.54) and 1.10 (0.52–1.53) (P value: 0.000). No differences were identified in the medians of parasitaemias in GEB when comparing the three stages (Kruskal–Wallis, P value: 0.736), but when comparing the medians of serum parasitaemias, statistical differences were identified (Kruskal–Wallis, P value: 0.000), specifically when we compared parasitaemias of acute with undetermined phases (Dunn test, P value: 0.000) or determined phase (Dunn test, P value: 0.015).
Clustering and factor formation between GEB and serum measurements
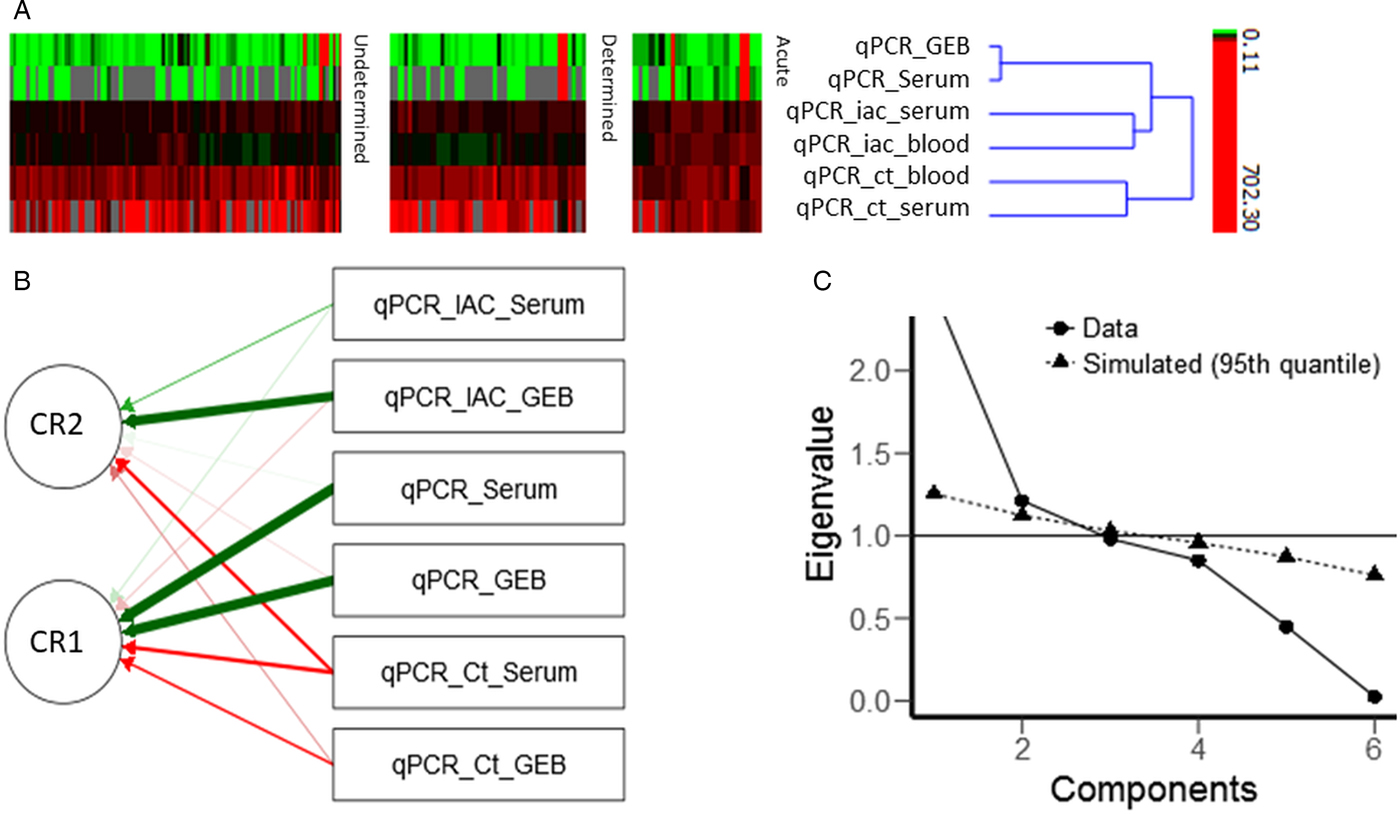
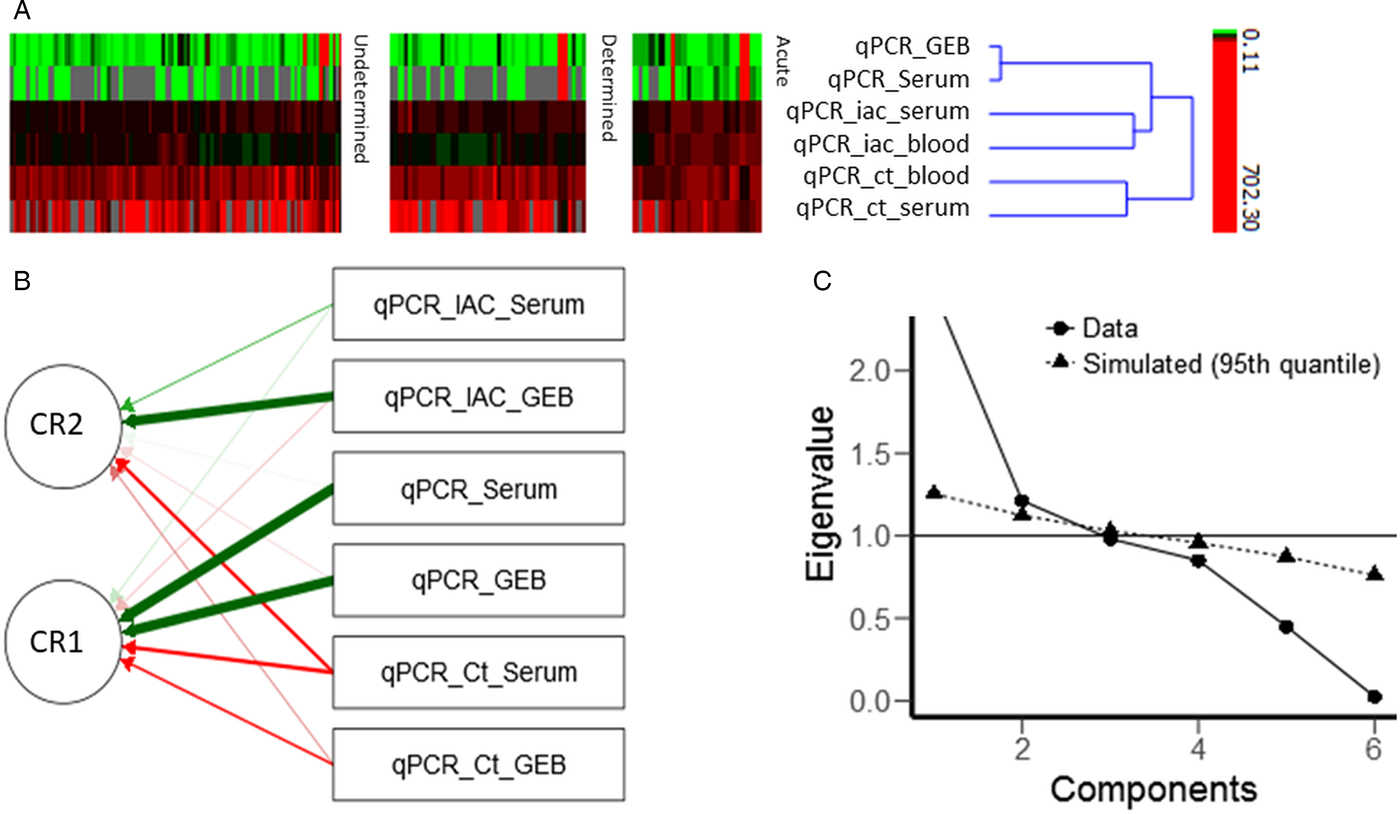
The cluster analysis included six measurements (variables) in three groups composed of: (1) qPCR parasite load in GEB and serum, (2) Ct in GEB and serum and (3) IAC in GEB and serum (Fig. 1A). The variables within the parasite load cluster, IAC cluster and Ct cluster presented similarities of 97.89, 62.6 and 61.9%, respectively (data not shown). PCA demonstrated unidimensionality and identified two factors that explained the variance in the data; qPCR_GEB, qPCR_Serum, qPCR_Ct_GEB and qPCR_Ct_Serum explained 98.4% of the variance with qPCR_GEB and qPCR_Serum contributing the highest load (Fig. 1B; Table S1). The factor conformation was statistically significant and a replicate performed under a simulation model showed similar results (Table S1, Fig. 1C).
Cluster and principal component analysis of GEB and serum variables. (A) Clusters between the measurements made in GEB (qPCR_GEB: parasite load in GEB samples, qPCR_Ct_GEB: cycle of threshold of qPCR for Trypanosoma cruzi in GEB samples, qPCR_IAC_GEB: cycle of threshold for IAC in GEB samples) and serum (qPCR_Serum: parasite load in serum samples, qPCR_Ct_Serum: cycle of threshold of qPCR for T. cruzi in serum samples and qPCR_IAC_Serum: cycle of threshold for IAC in GEB samples). (B) Principal components analysis (PCA), path diagram shows variables related with each component rotated (CR), green and red arrows represent positive and negative loads, respectively. (C) Screen plot shows unidimensionality and two factors above 1 in the eigenvalue scale, this number of components was replicated in the simulation trial.
Parasite load in GEB and serum samples, according to the clinical phase of Chagas disease
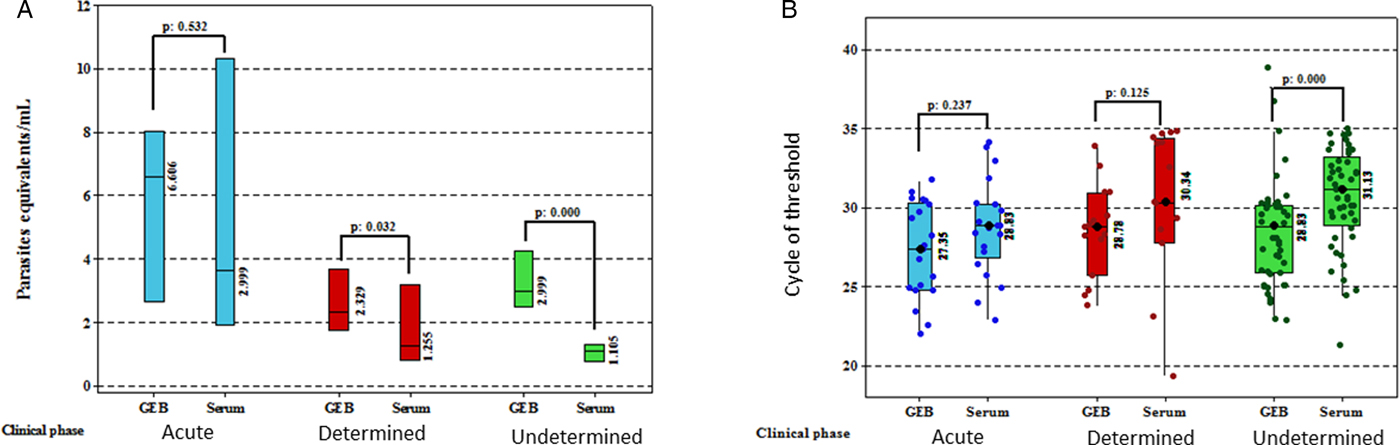
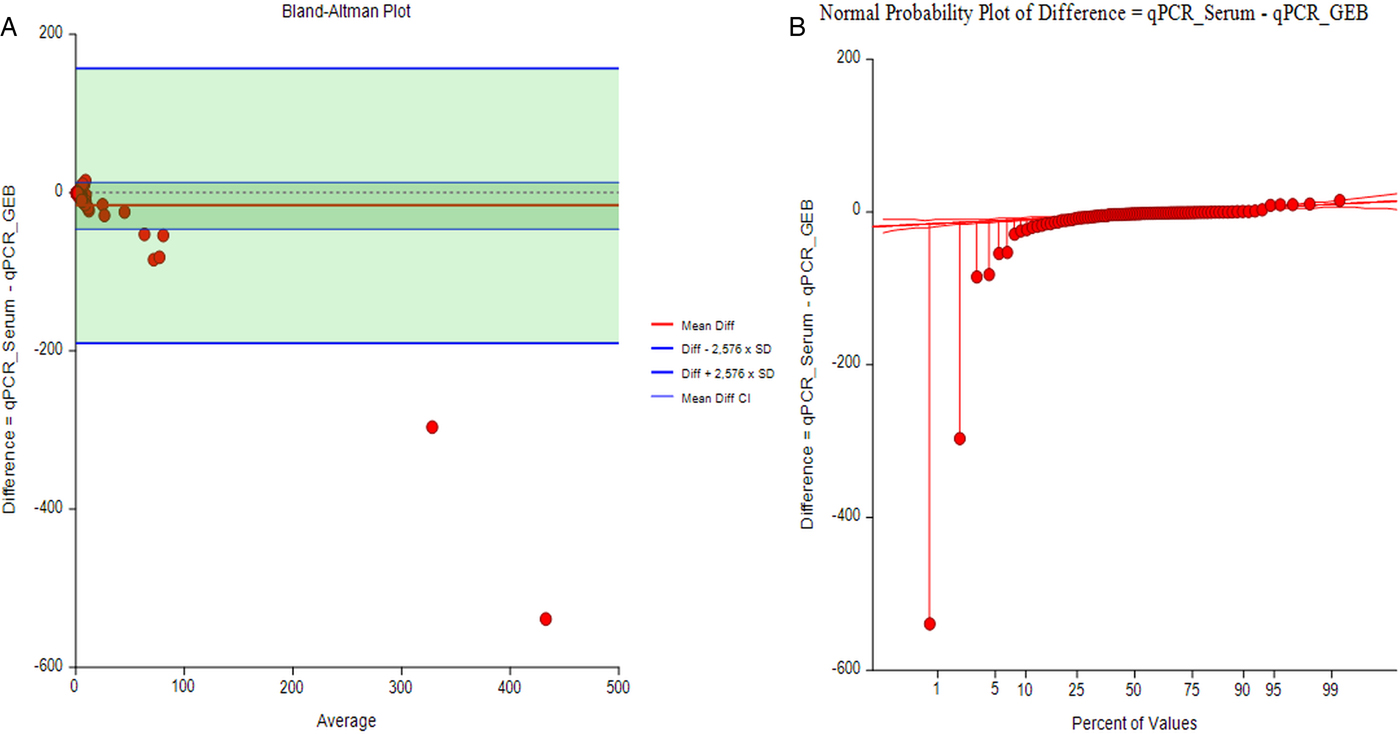
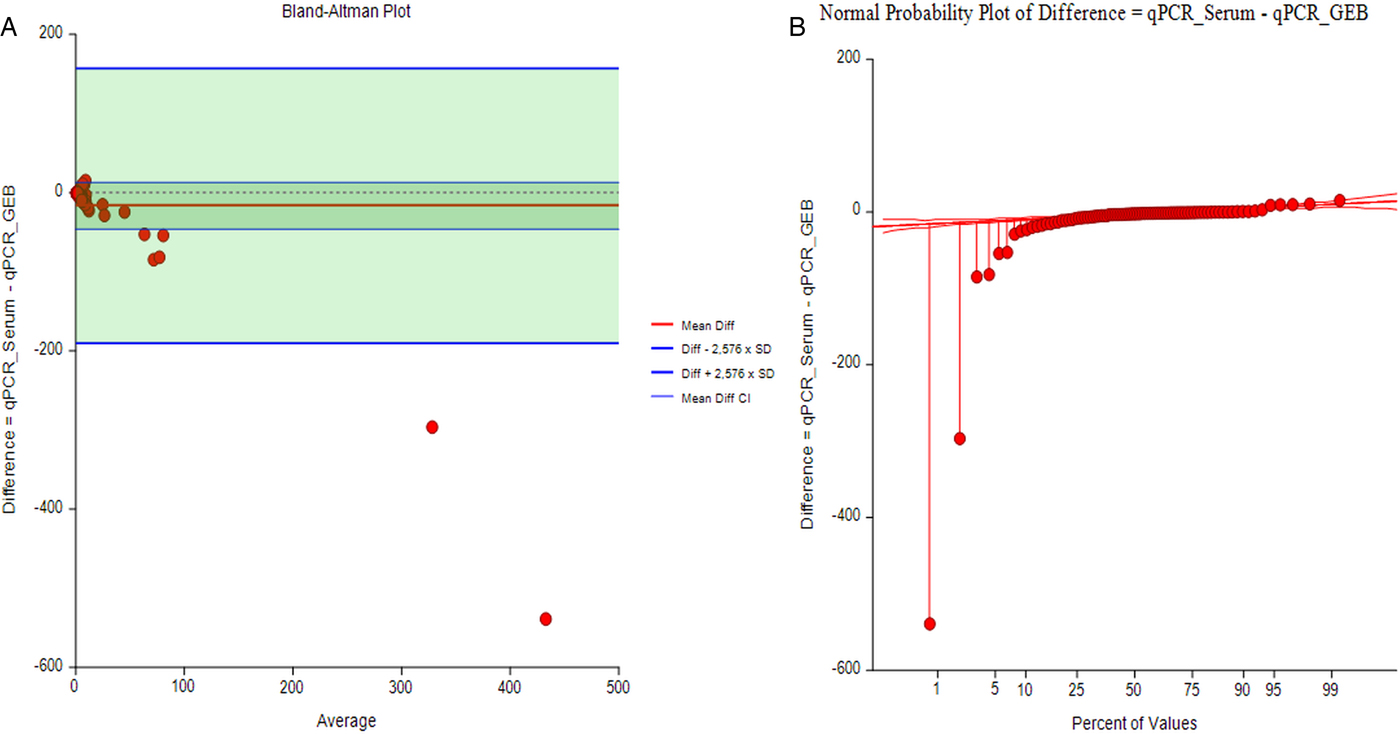
For patients in the acute phase, 92% (22/24) of serum samples were positive by qPCR, and for patients in the chronic phase, 78% (113/145). Subdividing the chronic phase cases further, 76% (78/103) of the undetermined chronic and 83% (35/42) of the determined chronic samples were positive by qPCR. In the serum samples obtained from patients in the acute phase, parasite load quantification was achieved in 95% of the positive samples (21/22), while in the chronic phase, it was achieved in 57% of the positive samples (64/113). In the 49 chronic phase samples that did not achieve the quantification, 29 were from patients in the undetermined chronic phase and 20 in the determined chronic phase. The differences in medians of parasite loads and Ct, according to the clinical phases of the disease, are presented in detail in Table 1 and Fig. 2. A good concordance was determined with the Bland and Altman test, with no statistical difference between GEB and serum (Fig. 3).
Comparison of parasite loads and cycles of threshold in serum and GEB samples. (A) Comparison between parasite load medians in serum and blood samples from patients in acute and chronic phases (determined and undetermined). The outliers were removed from the graph for convenience. (B) Comparison between cycle of threshold (Ct) in serum and GEB samples from patients in acute and chronic phases (determined and undetermined).
(A) Bland and Altman plot. Degree of agreement between GEB and serum measurements. Solid red line represents the mean of the difference between qPCR_GEB and qPCR_Serum and thin blue lines represent the 95% confidence interval of difference; solid blue lines represent the confidence interval of bias (13.0104; 95% CI −0.922 to 26.94; t-test P value: 0.0567); red dots above and below mean are outlier values, that do not cross the 95% CI of difference. (B) Normal probability plot of difference between qPCR_GEB and qPCR_Serum.
Discussion
This study determined the ability of the qPCR test to detect T. cruzi in serum samples from patients from all clinical phases of Chagas disease, who had positive results by qPCR in matched GEB samples. Detection of T. cruzi DNA was achieved in a high percentage of serum samples (80%; 135/169), indicating that serum samples have potential utility for the detection of parasitic DNA. There are only two studies in the literature comparing the detection of T. cruzi nuclear satellite DNA by PCR between blood and serum samples, one of them by conventional PCR in samples obtained from parasite-infected primates (Russomando et al. Reference Russomando1992), and another using qPCR in which the concordance of positive samples was 97% (38/39) (Melo et al. Reference Melo2015). The concordance of the positive results in the two studies is superior to that obtained in this study. This may be due first to the fact that the two studies made a comparison of whole blood and not blood treated with guanidine hydrochloride as in this study, generating differences in the detection of T. cruzi between the two types of sample, and second, to the low number of samples compared in these studies, which in the conventional PCR study is limited to three samples and in that of qPCR limited to 40 samples (Russomando et al. Reference Russomando1992; Melo et al. Reference Melo2015). Herein, more than 160 samples were measured increasing the robustness of our findings. Additionally, we present here for the first time results for the detection of T. cruzi by qPCR in patients clinically classified by Chagas disease phases.
Within the positive serum samples, 37% were unable to be quantified because they did not reach the threshold of quantification of the technique. Although the qPCR test in serum samples achieves a good detection of parasite DNA when compared with GEB samples, the quantification of parasite load in serum is lower compared with GEB. This can be seen in the differences found between the Ct values, the parasite loads and the Ct of the IAC that were statistically significant, with the Ct for T. cruzi and the Ct of the IAC being higher in the serum samples (Table 1). Similar results have been reported by Mello et al. who observed statistically significant differences between the internal control Ct (RNaseP), Ct for T. cruzi and the exogenous recovery control between serum samples, but unlike this study found no differences in terms of parasite load medians. However, this may be due to the limited number of samples in that study. The differences found in the parasite loads in this study between the two sample types therefore reflects the lower DNA recovery of the parasite in serum. This is in line with the observed decrease in Ct of the exogenous control recovered from serum observed by Melo et al. (Reference Melo2015).
However, it should be noted that the cluster and component analyses grouped the parasite loads obtained from GEB and serum (Fig. 1), followed by the Ct from the T. cruzi qPCR and then the Ct from the IAC qPCR, suggesting that the results of the independent variables involved in the multiplex qPCR technique for the two sample types are similar. In addition, to further reinforce the potential of serum use in the qPCR technique, the Bland and Altman analysis showed a high correlation between the parasite loads obtained in the two types of samples (Fig. 3). It is, therefore, evident that serum samples can be used as a source for the detection and quantification of T. cruzi DNA.
When analysing the results from samples from patients in the different clinical phases of Chagas disease, it was found that serum samples obtained from patients in the acute phase showed the highest percentage (92%) of detection. This is the first study comparing the detection of T. cruzi in GEB and serum samples in acute phase patients. The high concordance of the results from GEB and serum samples provide similar sensitivity to that reported for qPCR in GEB from acute phase patients (88–100%) (Hernández et al. Reference Hernández2016a). This suggests that serum samples are suitable for the detection of T. cruzi DNA by qPCR in the acute phase. This is considered of particular importance in studies of acute case outbreaks in which guanidine hydrochloride is sometimes not available for the collection of the sample. A serum sample, then, is a very favourable option, especially in cases in which the observation of the parasite has not been obtained by direct methods and the serology is not yet positive (Hernández et al. Reference Hernández2016b). In the chronic patients, there was less concordance in the detection of T. cruzi between serum and GEB samples compared with the acute phase. This may be due to the intermittent parasitaemias characteristic of the chronic phase. However, as the detection of parasite DNA is similar between the two types of samples (78%), the serum results will be useful when positive results are obtained, but the negative results will not allow the presence of the parasite to be ruled out. Once again, the detection of T. cruzi by qPCR in serum samples shows a similar sensitivity to that previously described for qPCR in GEB samples (60–80%) (Moreira et al. Reference Moreira2013; Ramírez et al. Reference Ramírez2015; Hernández et al. Reference Hernández2016a, Reference Hernándezb). Regarding the determined and undetermined states of the chronic phase, it is noteworthy that the qPCR achieved greater detection in patients in the determined phase than in the undetermined phase.
Interestingly, when the parasite loads were evaluated in the different clinical phases of the disease, it was observed that in the samples obtained from patients in the acute phase, there were no statistically significant differences for parasite loads, nor for T. cruzi Ct. Additionally no limit of quantification was observed for the serum samples, contrary to what was observed for the undetermined and determined chronic phases (Fig. 1). These findings are probably due to the high parasitaemias of the acute phase (Ramírez et al. Reference Ramírez2013; Hernández et al. Reference Hernández2016b; Filigheddu et al. Reference Filigheddu, Górgolas and Ramos2017). Clinical manifestations of acute Chagas disease can be confused with other pathologies such as malaria, typhoid fever, infectious mononucleosis, toxoplasmosis, secondary or tertiary syphilis, rickettsiosis, brucellosis, lymphomas and visceral leishmaniasis. This normally results in a delay in diagnosis, which can either lead to the autonomous resolution of the disease, or the worsening of symptoms, which can even lead to death (Cucunubá et al. Reference Cucunubá2016; Hernández et al. Reference Hernández2016b). Thus, the diagnosis of acute Chagas cases frequently does not occur in time, and in some cases when the disease is confirmed, parasitaemia has already been controlled by the immune system (Russomando et al. Reference Russomando1998; Ramírez et al. Reference Ramírez2013; Hernández et al. Reference Hernández2016b). Therefore, considering that acute Chagas disease symptomatology requires the performance of several paraclinical and differential diagnosis tests that are performed in serum, the retrospective analysis of serum samples taken during the first days of infection could provide the necessary information to confirm some cases and to provide the aetiologic treatment, thus avoiding the appearance of the chronic phase. For the case of the determined and undetermined chronic phase, statistically significant differences were observed between parasite loads and Ct only for undetermined patients; possibly this is related to the low parasitaemias detected during the chronic phase of the disease, reflected in the high Cts observed (Table 1 and Fig. 2) decreasing the precision of the quantification.
Herein, we conducted, to our knowledge, the first comparison of qPCR using GEB and serum samples from a large cohort of Chagas disease patients clinically classified in different phases of the disease. We observed that the results are similar between both sources of samples. These findings will contribute to obtaining a better picture of the parasite dynamics in patients across the American continent.
Supplementary material
The supplementary material for this article can be found at https://doi.org/10.1017/S0031182018000598
Acknowledgments
We thank Zulma Cucunubá Peréz from the Department of Infectious Disease Epidemiology, Imperial College, London for supervising the project and her pivotal role in the generation of the initial idea of this manuscript. We thank Colleen Elso, PhD, from Edanz Group (www.edanzediting.com/ac) for editing a draft of this manuscript.
Financial support
This work was supported by Departamento Administrativo de Ciencia, Tecnología e Innovación ‘COLCIENCIAS’ for funding the project ‘Fortalecimiento de la capacidad diagnóstica, de investigación y de vigilancia de enfermedades transmisibles emergentes y reemergentes en Colombia’ grant number 757–13, also ‘Unión Temporal Programa Nacional de Investigación para la prevención, control y tratamiento integral de la enfermedad de Chagas en Colombia’, grant number 380-2011, code 5014-537-30398 and Dirección de Investigación e Innovación from Universidad del Rosario.
Conflicts of interest
None.
Ethical standards
Not applicable.