Defined-benefit (DB) pensions are central components of public-employees’ compensation packages. Public plans expanded as governments needed to solve a personnel problem following the establishment of Civil Service protections: employees remained in their jobs too long, often working until death. Pensions encouraged employees to exit their jobs by paying them to not work, provided they achieved certain levels of tenure.Footnote 1 In turn, pensions also helped incentivise new employees to enter public service, especially as more positions opened up. In so doing, pensions helped build the professionalised civil service across state governments that exists today (Lazear Reference Lazear1979; Ippolito Reference Ippolito1987; Clark et al. Reference Clark, Craig and Wilson2003).
Over time, though, these funds have grown incredibly large. Most plans now have riskless liabilities that are 100–500% as large as their states’ general revenues. Pensions also have grown in cost, and states increasingly fail to make their required employer contributions. Unfortunately, pensions present governments with a time-inconsistency problem: they pass a portion of costs into the future by design. Although governments need to pay these costs eventually, complicated actuarial rules keep visibility low and insulate politicians from blame (Moe Reference Moe1990; Arnold Reference Arnold1992; Anzia and Moe Reference Anzia and Moe2017). In comparison with expanding pension benefits, politicians must set aside the full cost of salary increases in the current fiscal period (Bartel and Lewin Reference Bartel and Lewin1981; Hunter and Rankin Reference Hunter and Rankin1988). Thus, pensions offer a partial resolution to constituents’ inconsistent demands for public goods and low taxes (Converse Reference Converse1964). Additionally, elected officials often favour spending on other more popular programmes (Johnson Reference Johnson1997; Wagner Reference Wagner2001; Hess and Squire Reference Hess and Squire2010).
Costly pensions have important consequences. Most directly, funds may run out of money to meet their promises to employees. For example, Prichard, Alabama’s DB plan was so impoverished in 2009 that the government stopped sending checks to its 150 retired workers, in defiance of state law, and in spite of the fact that these employees had contributed into their funds throughout their entire careers. Two years later, the employees still had not been paid, and 18 had passed away (Cooper and Walsh Reference Cooper and Walsh2011). Although this has not yet happened at the state level, there is no guarantee states will avoid this problem in the future.
More broadly, troubled funds add to states’ general budget deficits and damage credit ratings, making it harder for governments to borrow money or plan their budgets. Growing pension costs might crowd out spending on other public goods and services demanded by taxpayers. Moreover, shakier pensions might undermine workers’ trust in their employers (see Hall and Soskice Reference Hall and Soskice2001), eroding plans’ intended recruitment and retention incentives and constraining the production of public goods and services (see Ippolito Reference Ippolito1997; Lee and Whitford Reference Lee and Whitford2008). Although I focus on state-employee plans in the United States (US) similar concerns regarding sustainability, employees’ welfare and the efficient provision of public goods certainly exist for government-employee pensions in other nations, as well.
The US national government has shown little willingness to help assuage state plans’ problems, instead opting for a federalist approach of nonregulation. In comparison, the national government regulates and insures private DB pensions under the 1974 Employee Retirement Income Security Act through the Pension Benefit Guarantee Corporation. Although the Government Accounting and Standard Board provides some guidelines that many plans follow, it ultimately is a nonprofit organisation lacking in enforcement power.Footnote 2 Thus, the national government allows state and local governments to design and manage plans as they see fit. This has facilitated extensive variation in management and plan outcomes.
Sustainable pension stewardship requires making tough decisions such as contributing enough money into funds, finding dependable investments and making policy changes in response to dynamic economic and personnel conditions. However, politicians tend to prefer avoiding blame for enacting new policies that could appear to reduce or retrench pension generosity (Weaver Reference Weaver1986; Pierson Reference Pierson1996). Hess and Squire (Reference Hess and Squire2010), for example, argue that teacher pensions facilitate the delivery of short-term payouts to employees at the expense of long-term fiscal management. Although elections could motivate politicians to deal with pensions, it is not theoretically obvious how they would matter. Wagner (Reference Wagner2001) argues that state legislators practice fiscal responsibility when their prospects for future control remain intact. In comparison, Immergut and Abou-Chadi (Reference Immergut and Abou-Chadi2014) find that politicians in pluralist nations with weak unions only pass reforms when they face competitive elections. Elections aside, governments also may just not care that much about pension health, and use unrealistic assumptions and underfund plans (Inman Reference Inman1981; Johnson Reference Johnson1997).
That said, elected officials are not the only actors who influence pensions. They delegate a fair amount of decision-making authority to boards of trustees. Boards oversee investment decisions, set discount rates and required employer contribution rates, produce plan reports and handle day-to-day management tasks. For example, CalPERS board’s tasks “include setting employer contribution rates, determining asset allocations, providing actuarial valuations, and more. The board DOES NOT have the ability to add, change, or delete benefits without concurrence from the state legislature” (2015). Thus, although boards do not unilaterally determine benefit levels, they have the potential to play important roles in shaping and implementing policies.
Not a great deal is known about boards. It is an open question how and to what extent they actually matter. Potentially, boards represent opportunities to develop competent and sustainable pension management. Their trustees may wield a great deal of autonomy in managing pensions, especially as they cultivate expertise and connections with various stakeholders (see Carpenter Reference Carpenter2001). If so, efforts to rectify pensions’ problems should be focused primarily on boards.
Alternatively, boards may have very limited direct influence over pensions. Although politicians cede power when they grant authority to boards, they still enjoy the traditional advantages of delegation. That is, they may appear to make credible commitments to pensions and employees, while also diffusing blame for any problems (see Weaver Reference Weaver1986). Politicians can always reign in boards when they feel the need to do so, after all (McCubbins and Schwartz Reference McCubbins and Schwartz1984; Epstein and O’Halloran Reference Epstein and O’Halloran1999). Any serious fixes to pensions, in this case, will have to come directly from elected officials.
Finally, boards may be effective at influencing some aspects of pension policy, but not others. After all, they are quasi-autonomous institutions that work in tandem with elected officials. They also face political, policy and economic constraints. For example, elected officials may be uninterested in raising taxes to cover pensions’ costs. Prior policies that tend to remain in place over time also may limit boards’ options, as could piling pension costs. Finally, economic conditions should constrain boards, especially given plans’ reliance on investments. Although these forces may limit boards, they also limit politicians’ powers. If so, pension reform may require a more holistic approach, involving both elected officials, boards and plan members themselves.
To better assess these possibilities, I focus on three types of board members. The first is the level of politicisation among trustees. Such members are politicians, their appointees or ex-officio state representatives. For example, then-Governor Mitt Romney sat on the Massachusetts Retirement Commission Board in 2005. Second, I examine the proportion of active employees on boards. These are plan members who have not yet begun collecting benefits. Third, I consider the fraction of retired employees who currently collect benefits on boards.Footnote 3
I collected information on board composition from over 1,000 state-plan CAFRs between 2001 and 2011. The data span 103 total plans in all 50 states. I control for political, plan-policy and economic characteristics, and consider several models including fixed effects to account for unobserved geographic and temporal variation that could influence the outcome variables. I also complement this with an instrumental variables (IV) approach, leveraging the fact that plan active membership significantly affects board composition, while not appearing to directly influence plan policies or funded ratios. In addition, I report models without and with the plan controls, in case boards and political actors select particular plan policies that remain in place over long periods of time, making them inherently endogenous.
First, I analyse how various political and policy forces drive variation in boards. Although boards do not change markedly year-to-year, they do nevertheless experience some variation.Footnote 4 A key result is that plan active-employee size significantly influences board membership. In the IV approach, these regressions form the first stage. Then, I examine how board membership influences several pension outcomes. These are the second-stage equations in the IV approach. I first focus on discount rates, which are a specific plan policy that boards influence. After that, I examine three broader and related outcomes: the funded ratio, assets and liabilities.Footnote 5
The results show that although political, policy and economic forces do shape trustee composition, boards also exert their own influence. Perhaps surprisingly, there is not a great amount of evidence that the politicisation variable predicts pension outcomes. However, active board members influence the selection of lower discount rates, and are associated with better funded ratios, as well as greater assets and fewer liabilities. Retired trustees, in comparison, are associated with higher discount rates. None of the board variables, though, seem to make discount rates reflect actual investment returns.Footnote 6 Thus, although boards do matter for pension policy, they also face significant constraints, and are not capable of fixing plans’ problems on their own.
Pensions and the role of boards of trustees
Although there is not a great deal of literature on the factors influencing pension board composition, there is a substantial amount of research on staffing choices in bureaucratic agencies, as well as the consequences of those decisions. Surely, boards may be subject to political pressures, even if the exact forces or their consequences may not be obvious. Polarisation, for example, might be associated with greater politicisation, reflecting a sort of spoils politics (see Moe Reference Moe1989; Devins and Lewis Reference Devins and Lewis2008; Anzia and Moe Reference Anzia and Moe2017). Political gridlock also might harm the ability of elected officials to staff boards. Other factors also could matter, such as unionisation, plan occupation-type and legislative professionalism. I cover these in greater detail in the following section.
Politicisation also is a useful starting point for thinking about boards’ impact on governance outcomes (see Snyder and Weingast Reference Snyder and Weingast2000). Political appointees tend to retain allegiances to the institutions that place them in their jobs (Moe Reference Moe1982; Wilson Reference Wilson1989). In turn, they may feel more pressure to keep taxes low and underfund pensions (Johnson Reference Johnson1997). In addition, political employees turn over more frequently, which can harm institutional knowledge (see Heclo Reference Heclo1977; Ban and Ingraham Reference Ban and Ingraham1990). In comparison, longer-term employees can develop strong relationships with stakeholders (Heclo Reference Heclo1975). At the national level, Lewis (Reference Lewis2007) and Gilmour and Lewis (Reference Gilmour and Lewis2006) show declines in governance outcomes associated with increased managerial politicisation.
In prior research on pensions, Cayer (Reference Cayer1998) notes that insulating boards from political control can help prevent raids on funds. Hess (Reference Hess2005) argues that nonpolitically appointed board members are more accountable to plans’ beneficiaries and operate outside of political influence. Their presence prevents legislators from using funds as “safety valves” to pay for other programmes. Further, political board members often have other job duties that occupy their time. In Maryland, employee-elected members attended 90–100% of all meetings. In comparison, ex-officio members attended about 60% of the time.
Board type may also influence investment decisionmaking. For example, Hess (Reference Hess2005) discusses how a general-employee fund in Maryland invested in a management company with strong ties to the governor, even though the firm continually under-performed. Alabama’s CAFR goes so far as to explicitly state that the plan does well when the state’s economy performs well, presumably thanks to localised investments. Relatedly, funds can target investments to influence corporate behaviour, which happened when CalPERS divested from tobacco, as shown by Barber (Reference Barber2009).Footnote 7
Alternatively, politicisation may not matter that much, or even improve governance. Moe (Reference Moe1985) argues that political appointees can make bureaucratic organisations more responsive, encourage the flow of ideas and keep government in touch with interest groups and voters. Nonpolitical board appointees also might ask for more generous pensions, or prefer the use of actuarial methods that disguise costs.
That said, it may be the case that the specific appointment mechanism is less critical than the trustee’s plan-member status. For example, the Montana Public Employee Retirement Association’s website states that the governor appoints all members of the “independent” board, which is staffed entirely with plan members. Once on the board, those trustees may behave quite similarly to their nonpolitically appointed counterparts in other states. In prior research, Schneider and Damanpour (Reference Schneider and Damanpour2002) and Hsin and Mitchell (Reference Hsin and Mitchell1997) find that employee trustees are associated with lower funded levels, whereas Munnell et al. (Reference Munnell, Haverstick and Aubry2008) find that they have no significant overall effect.
I build on this work by examining the fraction of active and retired members on boards each year. One possibility is that both of these types of members pursue similar strategies, which are at odds with those of politically appointed officials. Alternatively, it may be the case that active and retired trustees have distinct incentives that may or may not align with those of politicised trustees.
Active employees may desire more generous pensions, assuming they wish to maximise their own personal wealth. However, as is the case with CalPERS, boards generally lack the power to influence generosity without consent from state legislatures. Further, active trustees have a stake in plans’ long-term fiscal health, so that they will be able to actually receive their promised benefits in the future. Pension income also tends to grow as employees remain in their jobs, bolstering active trustees’ long-term incentives. In addition, active trustees might make “better” board members for many of the same reasons why politicised employees could make worse ones. Active trustees have more years of work ahead of them, on average, and are therefore less likely to turn over. As such, they may well be associated with lower discount rates and better funded ratios.
In comparison, retired trustees do not face quite the same long-term incentives. They are most directly concerned with receiving their promised pension payments in the current period. Although they wish to avoid a situation like the one in Prichard, they could be more willing to accept unrealistic actuarial assumptions or underfunding, so long as they receive their benefits and feel reasonably confident that their plans are not going to tank anytime soon. These employees also are more likely to turn over than their active-employee counterparts, as they are older. Further, there are simply fewer retired than active employees on most boards: active employees compose 43.7% of membership, on average, whereas retired employees make up just 13.5%. Assuming that boards use majority-voting rules retired trustees may have less influence.
Pension governance variables
To better understand how boards matter for governance, I first regress the membership variables on an array of political, economic and actuarial factors. I utilise panel data from 103 DB plans between 2001 and 2011.Footnote 8 Following that, I examine plan discount rates, funded ratios, assets and liabilities as dependent variables.
Board variables
The data on boards come from pensions’ annual reports, which capture differences between plans and states, as well as changes that occur over time.Footnote 9 I have board data for all plan-year observations. In constructing the politicisation variable, I include elected officials, representatives appointed by elected officials and ex-officio members. I make a simplifying assumption by combining these, as most ex-officio employees are politicians. Roughly 62.7% of trustees are politicised.Footnote 10 The active and retired variables are collected in a similar manner.Footnote 11
Often, studies of agencies or boards are limited to cross-sectional variation. Although many plans maintain consistent boards over time, substantial variation does exist. In all, 34 states in my data have more than one plan. Among those, 21 (61.8%) have differences in the politicisation variable, and 25 (73.5%) vary in both the active and retired variables. Additionally, substantial minorities of the plans vary in board membership at one or more points between 2001 and 2011. There are 39 (37.9%) plans that experience change in the political variable over time, and 47 (45.6%) that vary in the active and retired variables. Greater variation among the retired and active variables could indicate that state actors have more leeway in placing active and retired employees on boards, as well as the fact that active members sometimes retire, but remain on boards.
I also use these as independent variables to examine pension governance outcomes. In doing so, I consider two separate models. The first includes all three board variables, whereas the second only includes the active and retired measures. This is because many plans politically appoint active and retired members, implying that the sum of the three variables may be greater than one. Although it is useful to consider all the variables jointly, there is also value in examining a model that avoids double-counting members.Footnote 12
The discount rate
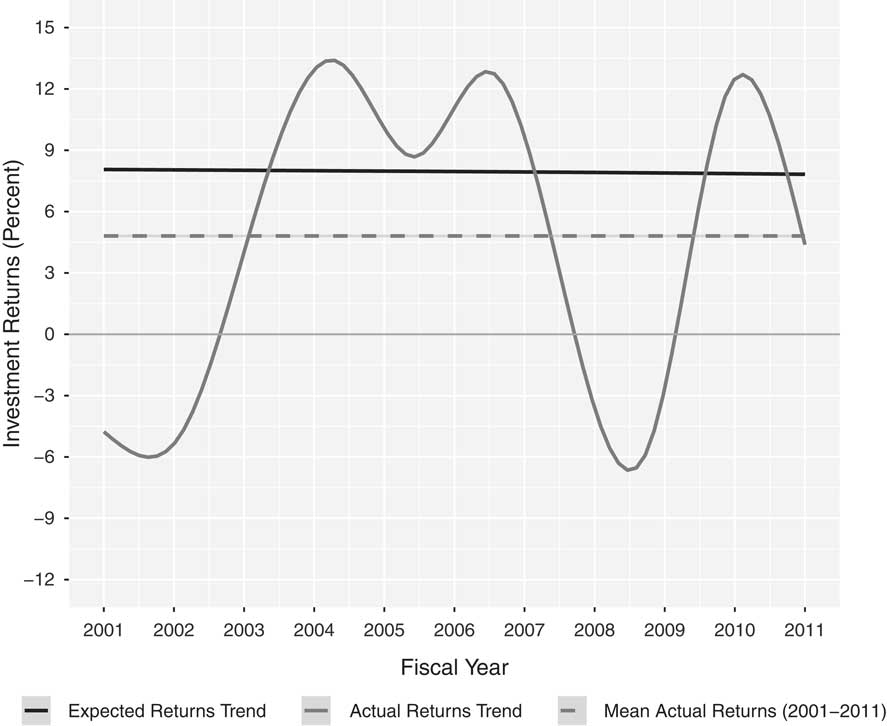
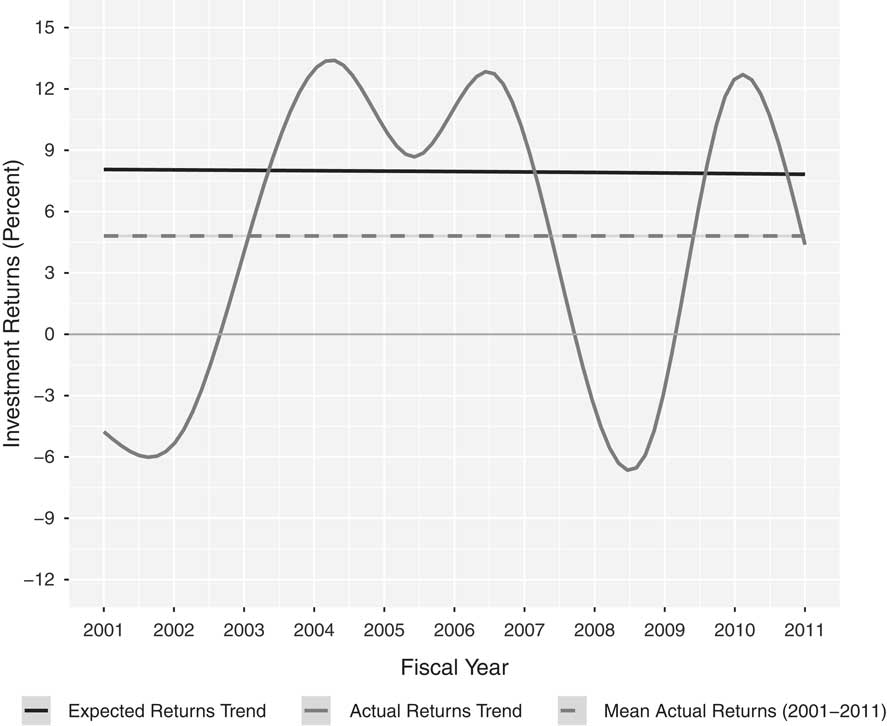
Second, I examine boards’ relationships with plan discount rates or expected investment returns. As pensions’ costs have risen, they have grown increasingly reliant on investments.Footnote 13 As seen in Figure 1, those returns fluctuate a great deal. Moreover, discount rates are consistently higher than actual returns, on average.
Average expected versus actual investment returns over time. Note: This graph plots smoothed annual trends in expected and actual investment returns for all plans. As can be seen, even though the actual returns fluctuate a great deal, the average expected return (or discount rate) remains quite flat over time. Moreover, the actual one-year investment returns have a geometric mean of about 4.8% between 2001 and 2011, even as plans assume that it will be just below 8% (based on data from Public Plans Database).
The discount rate is based on how assets are expected to perform in the future, and is used to calculate plan liabilities. Many economists argue that this is not sensible, given the fundamentally distinct nature of liabilities and assets. Higher discount rates tend to understate liabilities (Novy-Marx and Rauh 2009, Reference Novy-Marx and Ruah2011).Footnote 14 Peng (Reference Peng2004) also warns that plans underestimate risk and over-burden future tax payers. Potentially, boards could play a role in selecting more or less realistic discount rates.
The funded ratio, assets and liabilities
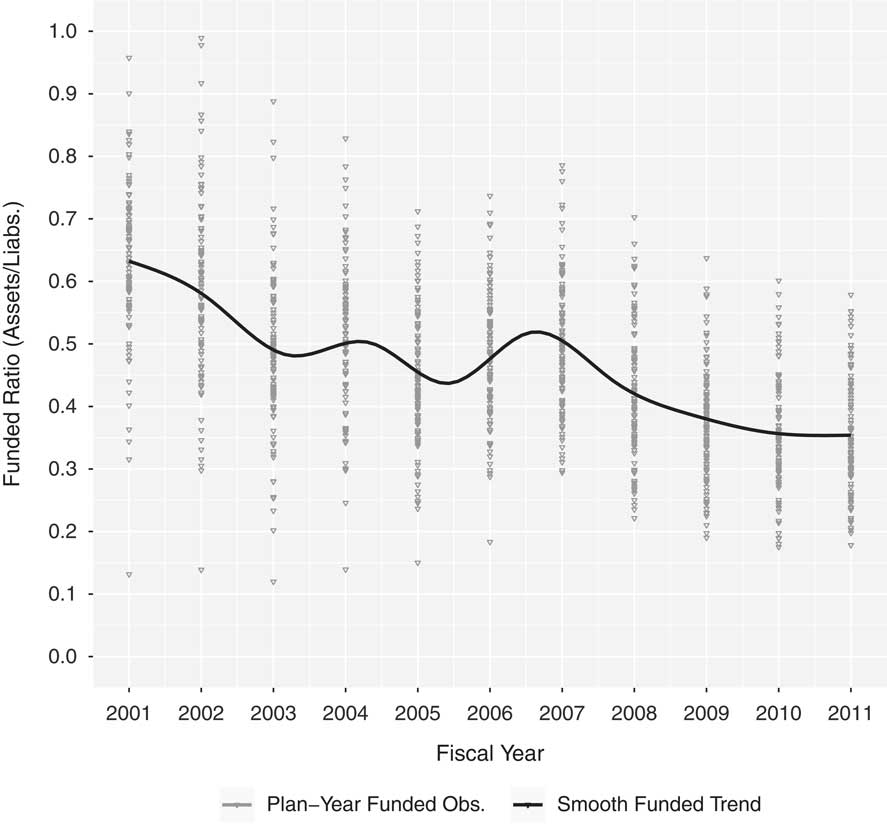
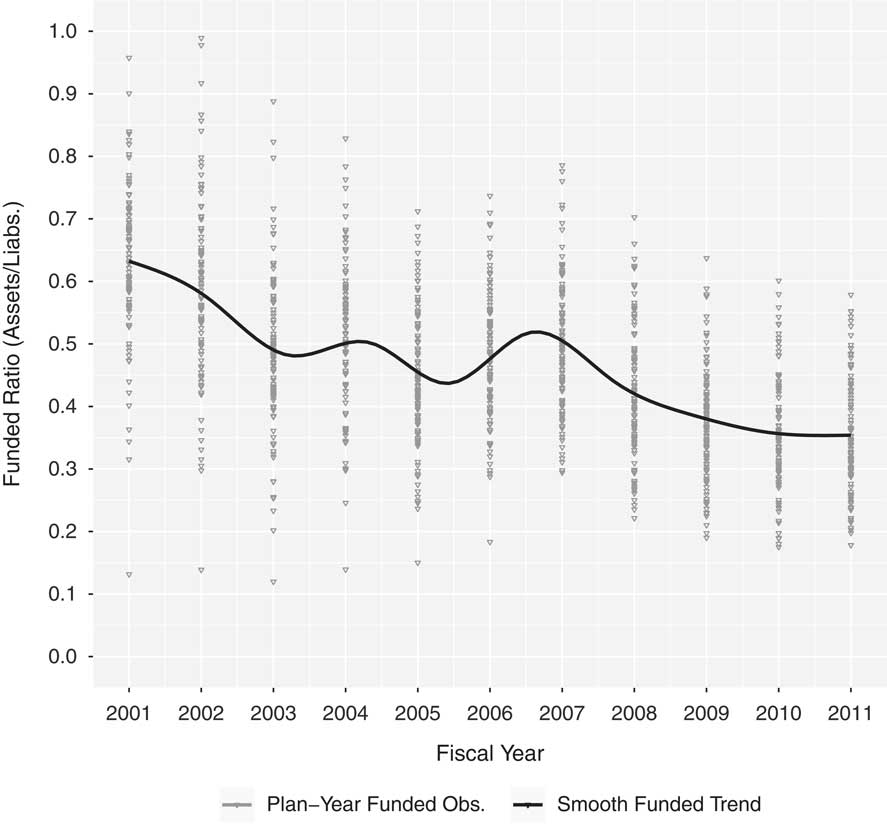
Third, I estimate the relationship between boards and the funded ratio and logged versions of its two components: liabilities and assets. Funds that have more assets relative to their liabilities essentially have enough money on hand to pay employees and meet old debts on schedule. As seen in Figure 2, average funded ratios have declined over time. A fair amount of extant research has examined plans’ funded ratios (see Schneider and Damanpour Reference Schneider and Damanpour2002; Eaton and Nofsinger Reference Eaton and Nofsinger2004; Munnell et al. Reference Munnell, Aubry and Quinby2011; Butt Reference Butt2012).
Plan riskless funded ratios over time. Note: This graph plots plans’ annual funded ratios for each year in the data, as well as a smoothed Loess curve to demonstrate how average plan funded ratios have changed over time. The graph indicates that on average, plans’ mean funded ratios have decreased from just under 0.65 in 2001 to about 0.35 in 2011 (based on data from Public Plans Database).
Assets come from combinations of employee and employer contributions, as well as investment returns. Liabilities combine payments owed to current retirees, debts and interest. Plans estimate both components at the same time, though, and likely bias liabilities downwards to improve funded status (see Novy-Marx and Rauh 2009, Reference Novy-Marx and Ruah2011). To assess this, I use riskless liabilities and funded levels, which I calculated using a lower standardised discount rate for each fiscal year.Footnote 15
Notably, liabilities and assets are distinct from each other. Potentially, some of the independent variables might exercise influence primarily through one of the components. Similarly, some variables may not influence the funded ratio, but push both components in the same direction. At the same time, assets and liabilities are unlikely to be independent of each other, given the funded ratio’s salience, and the fact that the same individuals estimate both. This motivates the decision to control for lagged versions of both in the log assets and liabilities models.
Political and economic variables
I now turn toward political factors that could influence funds. With the possible exception of unionisation, none of these affect private pensions.Footnote 16 First, legislative conditions might affect pensions. Four useful variables are : divided government, polarisation, legislative partisanship and legislative professionalism. For my purposes, I take these as exogenous, and do not attempt to do justice to their varying causes. Information on divided government and legislative partisanship comes from the National Conference of State Legislatures. Divided legislatures might be less able to pass reforms (see Mayhew Reference Mayhew1991; Fiorina Reference Fiorina1992; Sundquist Reference Sundquist1992). Polarisation, or the degree to which the parties can agree on policy, also might shape states’ fiscal situations (Shor and McCarty Reference Shor and McCarty2011).Footnote 17
Gridlock from the combination of the two also might influence plan governance (Jones Reference Jones2001; Binder Reference Binder2003). Separately, party elites could pursue different strategies with regard to pensions. I include a variable for the percentage of the lower chamber held by Republicans.Footnote 18 I also control for the professionalism of the state legislature (see Carey et al. Reference Carey, Niemi and Powell2000), which considers whether serving as a state legislator is a full-time job, and also comes with a staff and support.Footnote 19
Unions present a separate potential source of influence. Potentially, they may seek to shape board composition. Further, they might increase liabilities by demanding more benefits and pushing for less realistic actuarial assumptions. That said, they also could push for policies generating greater assets, such as sound investment strategies or higher taxes.Footnote 20 I control for the percent of state employees covered by unions.Footnote 21 Additionally, I include dummy controls for plans that cover public-safety and teacher employees, which might differ owing to factors such as union strength, personnel needs or partisan preferences.
I also examine whether state plans are complemented with Social security (SS).Footnote 22 Although court decisions and congressional reforms have extended coverage over time, about 6.4 million state employees still were not eligible to receive SS in 2011 (Clark et al. Reference Clark, Craig and Ahmed2009). Separately, I account for states’ economic characteristics by controlling for the ratio of debt to gross state product and per capita income.Footnote 23
Pension plan variables
Aside from politics and economics, plan policies might affect future governance. Here, I control for several key assumptions, including the discount rate, whether the plan uses market valuation and more. These variables all come from the Public Plans Database. However, I also estimate models excluding these variables, given the possibility that governments choose assumptions to exaggerate plan health and delay costs. In the models that do include these, I lag them by a year to mitigate potential posttreatment concerns. This dual approach helps account for the complicated and potentially endogenous relationship between boards and plan governance.
I include the discount rate as an independent variable in these models. Additionally, I also include a dummy variable that takes a value of 1 when a plan uses market valuation of liabilities (MVL), and 0 when it uses actuarial accrued liability (AAL) in calculating expected returns. MVL equates the discount rate with the current market rate of a group of high-quality fixed income investments, making it more responsive to economic fluctuations.Footnote 24 In comparison, AAL’s longer smoothing periods spread costs into the future.Footnote 25 Most public plans use AAL, and would experience declines in their funded ratios if they switched (Gold and Latter Reference Gold and Latter2009; Novy-Marx and Rauh 2009).Footnote 26
In addition, I include investment returns and allocation variables. Specifically, I control for the level of investment in equities, real estate, alternatives and bonds.Footnote 27 Equities refer to shares of stock, which are one of the most common pension investments. Real-estate investments include traditional properties, and even items such as golf courses in some cases. Alternatives refer to investments that are not in stocks, bonds or real estate. They include hedge funds, venture capital and carbon credits. They also may involve purchasing goods that are expected to increase in value over time, such as metals, alcohol, coins, antiques and so on. Alternatives often come with higher side fees than investments in equities or real estate, and also less liquidity. Finally, plans can purchase bonds, which provide them with interest in return for lending money to governments or businesses. So far, no study has clearly shown that any of these different investments are more or less likely to pay off.Footnote 28
Actuarial plan type is an additional control, and refers to the method by which plans estimate their liabilities. Although my data contain four of the six possible methods, I just include dummy variables for entry age normal (EAN) or projected unit credit (PUC) plans, as most plans use those. EAN plans allocate the present value of lifetime retirement benefits equally each year employees work, adding to liabilities as employees remain in their jobs. In comparison, PUC estimates benefits as a function of the present value of additional lifetime benefits employees expect by retirement.Footnote 29
Next, employer contributions provide a broad measure of generosity. Employees also contribute to funds, which they see as deductions from their pay. I examine both as percentages of real payroll. The proportion of assets generated by contributions is actually quite small. Employer contributions are 2.5% of the total plan assets in my data, whereas employee contributions are just 1.5%. Plans requiring larger contributions might be more generous or attempting to make up for lower funded ratios in prior years. Additional variables include the age of the plan and the plan’s logged number of active employees.
Empirical analysis
Much of the extant work on pensions relies on case studies or regressions with a few simple models. However, case studies are limited in their ability to generalise or understand the broad characteristics that affect governance. Although the latter class of research can do better in this regard, much of it is plagued by omitted variables bias, controlling for posttreatment variables, reverse causation and endogeneity between politics and plan policies. Of course, there is unfortunately no ability to randomise plans to cleanly estimate treatment effects under ideal conditions. Pensions present researchers with a number of thorny empirical challenges.
Here, I take several approaches to seriously grapple with these issues while gaining additional insight into the drivers and consequences of board composition and governance. Although each of these approaches has upsides and downsides, using them in concert helps provide a broader sense of factors influencing pension policy, and improves on prior work that either claims or strongly implies causality (see Schneider and Damanpour Reference Schneider and Damanpour2002; Clark et al. Reference Clark, Craig and Wilson2003; Hess Reference Hess2005; Munnell et al. Reference Munnell, Haverstick and Aubry2008).
I begin by examining the factors that influence pension boards. I do this while controlling for lagged versions of the variables discussed above, while also including year and plan fixed effects. The use of lagged variables accounts allows me to examine whether and how boards change in the following year in response to political or policy forces. Further, year fixed effects help control for the fact that broad forces in the economy or politics might influence numerous plans at once. Finally, using plan fixed effects focusses solely on variation within boards over time.Footnote 30 Fixed effects accounts for the correlation between the unobserved characteristics that could influence the dependent variables and the observed covariates.Footnote 31 Further, I include lagged versions of the board variables to focus on the factors contributing to change in boards since the prior year.Footnote 32
I present alternate models that exclude and include the pension controls, as it is possible that the political variables influence the selection of the actuarial techniques, making the latter endogenous or posttreatment (Matkin et al. Reference Matkin, Chen and Khalid2016). For example, Hsin and Mitchell (Reference Hsin and Mitchell1997) point out that poorly funded plans often choose actuarial assumptions that justify small contributions. Nevertheless, it is still useful to understand these relationships, so as to gain insight into how assumptions shape plans. In the model that includes the plan variables, they are all lagged by a year to mitigate potential posttreatment concerns. In assessing the pension governance or policy outcomes, I similarly include lagged versions of the outcome variables, as well as models including and excluding the plan variables. Further, I include year and state fixed effects.Footnote 33 States tend to differ from each other in important and unobserved ways. For example, it would be impossible to control for all the ways in which California’s pensions are different from Rhode Island’s pensions. State fixed effects focus solely on variation within states and over time.
Aside from that, it is important to acknowledge that many of the independent and dependent variables are correlated across time. In all models, I also adjust for some of the potential endogeneity by using Eicker-Huber-White “robust” standard errors. I use two-way clustering of standard errors at the state and plan levels. Clustering at the state level helps account for the fact that plans are not independent of each other within states. The same individuals simultaneously determine pension policies for several plans within most states, making it essential to cluster at that level. Clustering at the plan level, in comparison, helps account for the fact that many plan policies do not change a great deal over time. Failing to adjust for this autocorrelation could result in underestimating the size of the standard errors (Wooldridge Reference Wooldridge2010; Cameron and Miller Reference Cameron and Miller2015).
In the following board regression model, i is the given plan, t is the year, β 1–β 5 are vectors of the point estimates and ϵ it is the random error. The models include year and plan fixed effects, which are dummy variables for each year and plan in the data. Note that in one specification of the model, I exclude the pension variables. In the IV approach, this is first-stage regression.
 $$\matrix{ {Board_{{it}} \, {\equals}\, \beta _{0} {\plus}\beta _{1} LogActives_{{i(t{\minus}1)}} {\plus}\beta _{2} Politics_{{i(t{\minus}1)}} {\plus}\beta _{3} Econ_{{i(t{\minus}1)}} } \hfill \cr \qquad \ \ \quad {\plus}{\beta _{4} Pension_{{i(t{\minus}1)}} {\plus}\beta _{5} Board_{{i(t{\minus}1)}} {\plus}YearFE{\plus}PlanFE{\plus}{\epsilon}_{{it}} } \hfill \cr } $$
I then turn to estimating discount rates, funded ratios, log assets and liabilities. I do this first by taking a similar approach as above, again including lagged versions of the dependent variables as a control to focus on analysing the change from the prior year, and using state and year fixed effects. As above, I consider models that both include and leave out the pension characteristics.
 $$\matrix{ {Y_{{it}} \, {\equals}\, \theta _{0} {\plus}\theta _{1} Board_{{it}} {\plus}\theta _{2} Politics_{{it}} {\plus}\theta _{3} Econ_{{i(t{\minus}1)}} {\plus}\theta _{4} Pension_{{i(t{\minus}1)}} } \hfill \cr \quad \quad {\plus} {Y_{{i(t{\minus}1)}} {\plus}\theta _{5} LogActives_{{i(t{\minus}1)}} {\plus}YearFE{\plus}StateFE{\plus}\zeta _{{it}} } \hfill \cr } $$
In addition, I report results from a complementary IV approach, which uses the predicted values from the first-stage models that exclude the actuarial controls.Footnote 34 This approach exploits the fact that the fraction of active employees has little direct significant impact on pension policies (shown in the results in Tables 2–5 here, as well as in the results in the Online Appendix), but does influence board composition. I use that influence in a multi-stage process to examine whether active employee size can influence plan governance through their influence on boards. One clear advantage to this approach is that it more clearly establishes the direction of the relationship between boards and governance. In addition, the predicted values from the first stage have greater variance than the board variables, somewhat mitigating autocorrelation.
Equation 3 is very similar to 2, except I now exclude the log active membership variable and use the predicted board variables from the first stage.
 $$\matrix{ {Y_{{it}} \, {\equals}\, \gamma _{0} {\plus}\gamma _{1} Bo\hat{a}rd_{{it}} {\plus}\gamma _{2} Politics_{{it}} {\plus}\gamma _{3} Econ_{{i(t{\minus}1)}} {\plus}\gamma _{4} Pension_{{i(t{\minus}1)}} } \hfill \cr \quad \quad{\plus}{Y_{{i(t{\minus}1)}} {\plus}YearFE{\plus}StateFE{\plus}\xi _{{it}} } \hfill \cr } $$
I first examine discount rates to focus on a plan policy over which boards have direct influence.Footnote 35 I then turn to funded ratios, assets and liabilities, which are more general governance outcomes. I use logged measures of assets and liabilities to downweight outliers and impose normal distributions, better comporting with the assumptions of regression.Footnote 36 Additionally, I control for lagged assets and liabilities in both models, given the reality that plans report both at the same time, and likely have overall funded levels in mind when they do so. Taken together, these findings provide insight into how boards and the other variables influence variation in state-employee pensions.
Results and discussion
The results provide evidence that board membership shapes pension governance in numerous ways. At the same time, though, boards also are influenced by politics, and not situated to overcome pensions’ most challenging problems by themselves.
The factors associated with variation in board membership
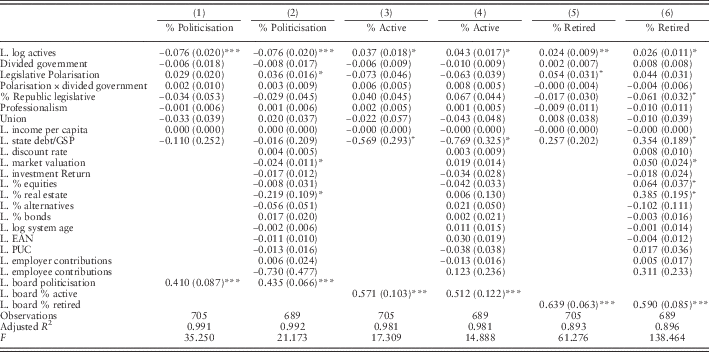
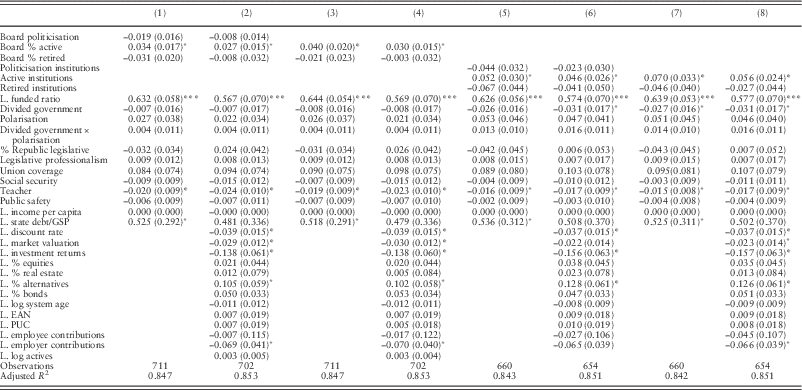
Little is known about state pension boards. In order to assess this, I examine changes within plans, which are due to variation over time. Table 1 presents the results of regressing the board variables on all of the independent variables, as well as one-year lagged versions of the board variables.Footnote 37 The results show that the number of active plan-employees influences board composition. This suggests that employee voice or representation on boards increases with growth in active membership. In comparison, politicians exercise greater control as membership shrinks.
Board membership regressions

Note: The above presents the results of regressing the board variables on the independent variables.
Two-way robust-cluster standard errors in parentheses. Models include plan and year fixed effects.
GSP=gross state product; EAN=entry age normal; PUC=projected unit credit.
+p<0.10, *p<0.05, **p<0.01, ***p<0.001.
In one of the specifications, the politicisation variable also increases in response to greater legislative polarisation.Footnote 38 As the parties grow further apart from each other, there may be more attempts to place sympathetic staff on pension boards. Otherwise, boards do not seem especially responsive to political forces.
These results also provide some sense of the degree to which board composition responds to prior-year policies. Discount rates do not influence any of the board variables. Board membership also does not appear to react to investment returns, which suggests that little reining in occurs along this dimension. In the Appendix, I also show that lagged funded ratios do not feed back into board membership. Active and retired membership are especially robust to prior policies. In comparison, politicisation increases in plans that are less invested in real estate and also use AAL over market valuation. Active and retired membership do seem sensitive to economic conditions, though.
These regressions form the first stage in the IV approach, which exploits the fact that the active employee variable has little direct impact on pension policies and funded ratios. The variable does have influence, however, when using it as a first-stage predictor, suggesting that the number of employees shapes plans governance through boards of trustees. This approach also has the benefit of somewhat mitigating autocorrelation.Footnote 39
The IV estimator is a ratio of log-lagged active employees’s effect on the second-stage outcome variables as a proportion of log-lagged active employees’s effect on board composition. If the latter relationship is small, then the instrument is weak, meaning that there is little exogenous variation. Weak instruments result in second-stage estimates that are too large and incorporate too little uncertainty. Stock and Yogo (Reference Stock and Yogo2005) present a standard test for weak instruments, which focusses on the upper bound of tolerable bias. They identify critical values for F-statistics at which the false positive rate is less than 10% when a significance level of α=0.05 is used to interpret coefficients under the null hypothesis of no effect. The critical value for this test is 16.38 with one instrument and one endogenous regressor. Thus, first-stage models with F>16.38 are sufficiently strong instruments for IV analysis. As seen in Table 1, the F-statistic surpasses this threshold in all but model (4). For the sake of consistency, I solely interpret the results from the predicted values from models (1), (3) and (5) in the second stage.
Discount rates and board membership
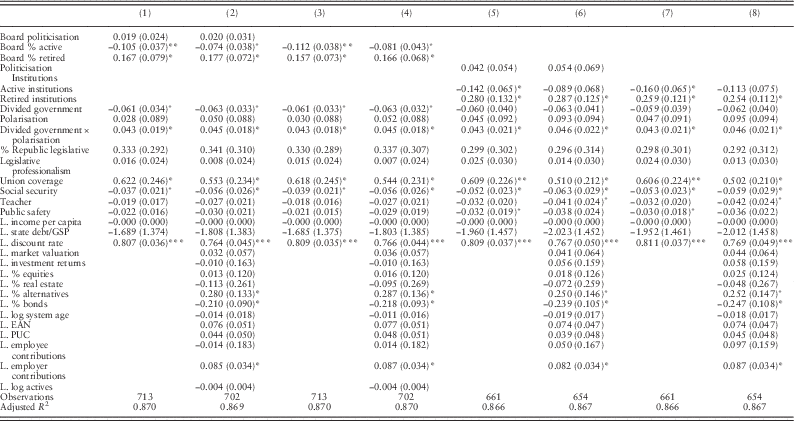
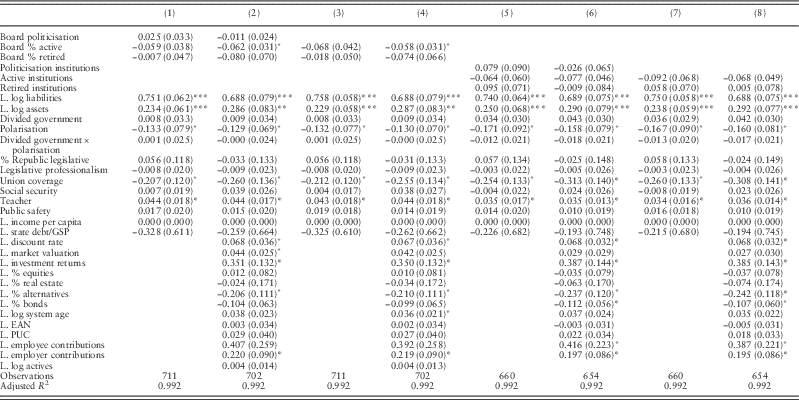
I next turn to analysing pension governance outcomes using both fixed effects and IV approaches. Pension boards and their policies are likely to have many direct and indirect effects. See the Appendix for additional analyses of how boards shape other policies, such as investment allocation and employer contributions.Footnote 40 However, it is useful to first focus on one of the most direct and salient policies that boards influence: the discount rate.Footnote 41 The results in Table 2 across both the ordinary least squares (OLS) and instrumented models show that active trustees are associated with lower discount rates, whereas retired trustees are associated with higher ones.Footnote 42 In comparison, although politicisation is associated with higher discount rates, it is not statistically significant. This suggests that boards with greater fractions of active employees could choose smaller discount rates, whereas boards with more retired employees may select larger ones.Footnote 43
Board membership and plan discount rates
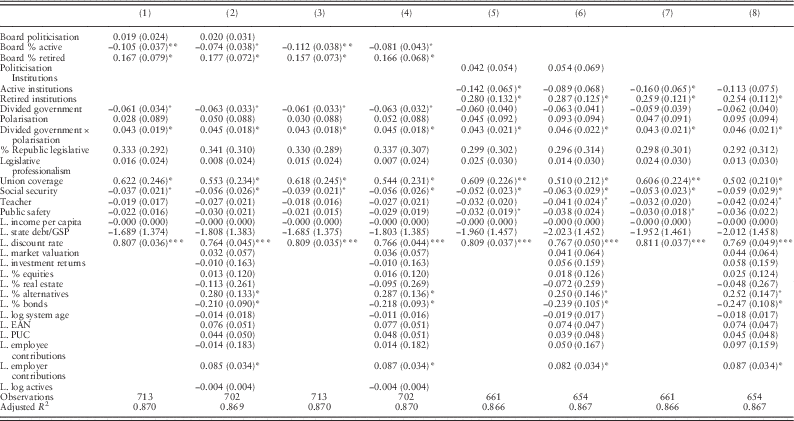
Note: The above is the result of regressing discount rates (expected investment returns) on the independent variables.
Two-way robust-cluster standard errors in parentheses. Models include state and year fixed effects.
GSP=gross state product; EAN=entry age normal; PUC=projected unit credit.
+p<0.10, *p<0.05, **p<0.01, ***p<0.001.
Among the other political variables, gridlock is associated with higher discount rates. It may well be the case that when gridlock occurs states have a harder time monitoring pensions. Boards in such states might then lean more heavily on investment returns in the following year.Footnote 44 Discount rates also seem to rise as union coverage grows within states. Thus, both legislative gridlock and unions may well play a role in pushing policies in unrealistic directions to cover pensions’ costs.
In terms of the plan variables, investment strategy choices seem to influence the selection of the discount rate in the following year, which is not surprising. Alternative investments are significantly associated with higher discount rates, whereas bonds are associated with smaller discount rates. Thus, it would appear that states expect these alternative investments to pay off. In addition, discount rates are positively associated with employer contributions, suggesting that governments that contribute more into pensions also expect greater, although unfortunately unrealistic, yields from their investments.
Perhaps most surprisingly, prior investment returns do not seem to affect the selection of the discount rate. Ostensibly, prior returns should influence the discount rate, by definition. The null relationship here suggests that discount rates have much more to do with plans’ current needs, rather than the realities of the market.
The funded ratio and its components
I then move onto a broader metric of pension governance: the funded ratio and its components. It is possible that boards will have a constrained impact on these variables, given various external political and economic forces. Nonetheless, boards may still play an important role in shaping these variables. As before, I examine these both with OLS regressions and the instrumented board variables, and report the results in Tables 3–5.Footnote 45
Board membership and plan funded ratios

Note: The above is the result of regressing riskless funded ratios on the independent variables.
Two-way robust-cluster standard errors in parentheses. Models include state and year fixed effects.
GSP=gross state product; EAN=entry age normal; PUC=projected unit credit.
+p<0.10, *p<0.05, **p<0.01, ***p<0.001.
Board membership and log riskless liabilities

Note: The above is the result of regressing riskless log riskless liabilities on the independent variables.
Two-way robust-cluster standard errors in parentheses. Models include state and year fixed effects.
GSP=gross state product; EAN=entry age normal; PUC=projected unit credit.
+p<0.10, *p<0.05, **p<0.01, ***p<0.001.
Board membership and log assets

Note: The above is the result of regressing log assets on the independent variables.
Two-way robust-cluster standard errors in parentheses. Models include state and year fixed effects.
GSP=gross state product; EAN=entry age normal; PUC=projected unit credit.
+p<0.10, *p<0.05, **p<0.01, ***p<0.001.
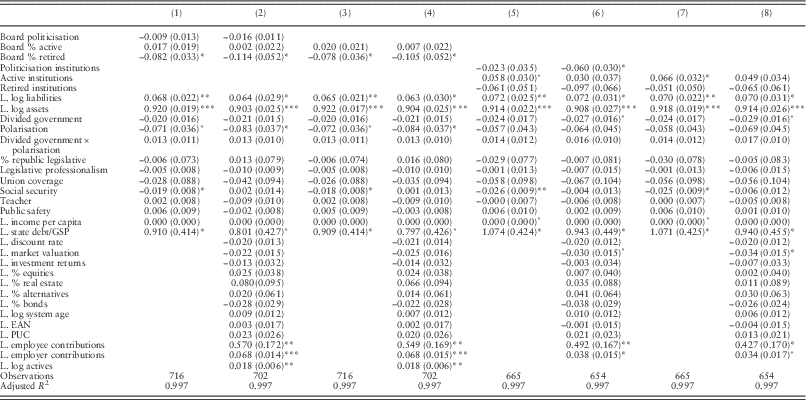
Although politicised boards are associated with lower funded ratios, the coefficients are not significant in any of the models. The only exception is that instrumented politicisation has a negative relationship with log assets.Footnote 46 In comparison, active trustees on boards are associated with larger funded levels, suggesting that greater employee voice could play an important role in pension management. Active members on boards are associated with a 0.027–0.07 increase in funded ratio, depending on the model. This means that if a board of ten people replaces a nonactive member with an active one, there will between a 0.3 and 0.7% increase in the plan’s funded ratio. Given that the average funded ratio in the data is 47%, this is relatively consequential. In examining assets, active members are associated with fewer liabilities in the noninstrumented specifications, and more assets in the instrumented models. Retired trustees, though, do not shape funded ratios or liabilities. However, they are associated with significantly fewer assets in the noninstrumented models. This could mean that they affect some plan characteristics, even if they do not affect the overall funded status.
The other political variables do not appear to play major roles. Polarisation is associated with fewer assets and liabilities, although only at the 10% level in most models. This could be owing to the more direct influence of boards, as well as the fact that pensions have historically been popular with both parties (Anzia and Moe Reference Anzia and Moe2017). Unionisation also is not significantly related to funded status, but is associated with fewer liabilities. This seems to counter the expectation that increased union coverage drives up liabilities across plans within states, at least.
In terms of occupations, plans covering teachers tend to have worse funded ratios within states. Specifically, they are associated with significantly more liabilities, but not more assets. In comparison, public safety plans’ effects are insignificant. It may well be the case that teachers’ unions have been more successful securing larger benefits for employees, leading to greater liabilities.
Many of the plan policies also appear to influence these variables. The lagged discount rate has a negative and significant relationship with funded ratios. This reflects the fact that higher discount rates are further removed from the riskless rates, meaning that plans arguably tend to understate liabilities. Thus, higher prior-year discount will be positively associated with riskless liabilities and, in turn, reduced funded ratios. More unnerving, though, is that higher discount rates are not associated with larger assets in the following year. This relationship exists irrespective of the board variable included in each model.
Market valuation is associated with lower funded levels, as well as with somewhat greater log assets and smaller log liabilities. Investment returns are associated with worse funded levels and greater liabilities. Funded ratios also improve with additional investments in alternatives, whereas liabilities shrink (at the 10% level). However, they compose a very small portion of plans’ overall investing, so it is difficult to state with certainty whether plans should engage in more of this behaviour.
Employer contributions are associated with significantly larger liabilities and assets, although more of the former than the latter, negatively contributing to funded ratios. Employee contributions, in comparison, are associated with more of both assets and liabilities, contributing to an overall null effect on the funded ratio. Although this may seem surprising, higher employer contributions usually reflect attempts to make up for historically lower funded ratios. Thus, it is clear that although boards influence some of these variables, numerous other policy, political and economic factors also exercise influence, constraining boards’ powers.
Discussion
Historically, elected officials have used pensions as tools to reward employees while keeping visibility and taxes low. However, doing so involves pushing costs into the future, creating a fiscal management problem that will have to be dealt with at some point. The descriptive statistics and regression results highlight several fundamental challenges faced by pensions. Funded levels have decreased with time, and not just in response to the 2008 economic downturn. States frequently fail to make their full contributions into funds, whereas employee contributions rarely budge. Public discount rates also are systematically higher than plans’ actual returns. When controlling for other factors, investment returns have a null relationship with discount rates. Discount rates similarly have an insignificant relationship with assets, highlighting a disconnect between plans’ assumptions and the amount of money they have on hand.
Market valuation tends to reduce funded ratios, and as a consequence very few plans opt to use it. Although there may be good reasons to stick with the self-reported ratios currently popular with plans, the concerns raised by Novy-Marx and Rauh (2009) and others make it more likely that plans would provide more thorough pictures by reporting riskless measures, as well. Currently, though, plans do not seem in any rush to do so. Finally, as plans turn to investments to cover costs, there is little evidence that any sort of strategy will pay off with certainty, which is simply a reality of the market.
These facts highlight just some of pensions’ challenges. Given this, I wonder how board governance both responds and contributes to this situation. Not a great deal of work has pointed to variation in management boards. Although boards do not experience drastic changes over time, they do occasionally shift in ways that reflect features of plans, politics and their local economies. I find that all three board variables change in response to the number of active employees covered by plans. Although there is no evidence that legislative gridlock affects board membership ratios, there is some evidence that polarisation is associated with greater political control. As polarisation grows in various state legislatures, it will be useful to examine its continued effects on boards and plan governance. Although it is tempting to blame fiscal problems on polarisation, polarised but united governments might potentially be in the best positions to muster the political will to tackle pensions’ longer-term costs.
I also show that boards shape discount rates and funded levels. I do so both with a more straightforward OLS approach and using lagged log board composition as an IV for board composition. Both sets of results show that boards with greater portions of active employees contribute to lower discount rates, whereas more retired trustees contribute to higher ones. The Appendix also shows additional ways in which boards influence pension policy. Active board members also have a significant relationship with board funded levels and their components, whereas retired boards have fewer assets.Footnote 47
The results show that although boards matter, they also do not act in a vacuum. The same forces that shape pension policies sometimes also shape boards. Institutional stickiness also tends to keep plan features consistent over time, which can serve as a source of autonomy, but also limit boards’ abilities to make more changes to remedy the problems listed above. While my inferences rely on observational data, and are unlikely to be as good as those made under random assignment, my approach expands on earlier literature in important ways, and provides new insight into pension governance.
Conclusion
As pensions’ costs grow over the next several decades, governments will need to figure out ways to manage funds in a more sustainable manner, while using more realistic actuarial assumptions and contributing greater money into plans. As it stands, growing costs add to states’ general deficits, harm credit ratings, constrain the ability to borrow money or fund other programmes and potentially discourage employee recruitment and retention. Thus, there is a key tension between fiscal sustainability and pensions’ personnel purposes. Even as I focus on the US, these tensions exist in public-sector pensions internationally, as well. While the national government could step in to regulate state-plan policy, it has not chosen to do so. Plans vary extensively across and within states, as well as over time.
Using original data collected from most major state pension plans from 2001 to 2011, I ask what factors drive variation in pension management boards and governance outcomes. My approach pays close attention to key features of plans’ political and institutional landscapes. Much of the existing literature on pensions focuses on actuarial characteristics or labour market incentives, but pays little attention to the politics (Lazear Reference Lazear1979; Ippolito Reference Ippolito1987; Hsin and Mitchell Reference Hsin and Mitchell1997; Munnell and Sunden Reference Munnell and Sunden2001; Novy-Marx and Rauh 2009). At the same time, political science tends to focus more broadly on the politicisation of bureaucratic employees (Heclo Reference Heclo1975; Gilmour and Lewis Reference Gilmour and Lewis2006; Lewis Reference Lewis2007), but ignore pensions as critical administrative and policy tools within state and local governments.
I consider board membership with three constructs: the percent of the board that is politicised, and the active and retired status of board members. Interestingly, the size of active employee membership within plans significantly predicts all three variables, suggesting that employees exercise more influence over policy as their numbers grow. Additionally, there is some evidence that polarisation contributes to greater politicisation of pension boards, which could reflect parties’ attempts to gain more control over the levers of government. State economies also seem to impact board composition. Otherwise, boards seem mostly insulated from political forces. Although politicians do control board composition, there is little evidence that they “reign in” membership in response to specific plan outcomes, such as low funded ratios or poor investment returns.
Following that, I show that boards matter for pension governance, although in specific ways. Boards with more active employees utilise smaller discount rates, whereas those with more retired employees use larger ones. Funded ratios also improve, on average, as boards have more active employees. There is some evidence that such boards are associated with greater assets and fewer liabilities, as well. Retirees on boards also contribute to reduced assets.Footnote 48 Thus, boards do offer states an opportunity to shape pension governance.
At the same time, though, boards also fail to matter in numerous ways. Politicisation seems to have little impact on discount rates or funded ratios. No type of board does better at improving the matching between investment returns and discount rates, either. Both in the US and abroad, it is unlikely that bureaucratic decisionmaking absent significant political reform will be sufficient to keep pensions running smoothly. Governments should see boards for what they are: quasi-autonomous management institutions that implement some legislative policies, and set others. They are constrained by many forces, and not likely to rock the boat.
Anzia and Moe (Reference Anzia and Moe2017) present a useful complement to my research, focussing on how partisan politics have led to variation in pension legislation. They find no major partisan differences before the 2008 economic crisis. I also find no partisan effect on funded ratios. However, they maintain that the 2008 crisis helped politicise the issue, leading to some sorting in which Republicans made more cuts than Democrats. In comparison, analysts at Morningstar and Moody’s recently have argued that there is no clear red-blue pattern addressing pensions’ problems (Balz Reference Balz2013). The issue is far from settled, but it certainly seems possible that parties could polarise over pensions in future years.Footnote 49
Future work should pay greater attention to boards’ roles in the pension policy process. Scholars should more closely look at how boards make their decisions, affect policies and navigate their particular political environments. It also would be useful to measure board tenure and turnover, so as to analyse their effects on pension governance. Aside from that, we could better understand the connections between board composition and state-government personnel: are workers more likely to remain in their jobs when there are more active employees on pension boards? Such work also could analyse pensions through surveys of current and potential bureaucrats. Last, it would be useful to better understand how these forces play out in public-sector pensions in other countries, which would offer additional sources of institutional variation. As time passes, we will gain a better understanding into the nonstatic nature and consequences of pension governance.
As governments consider reforming pensions, they should think carefully about management boards, which play key roles in shaping plan policy. Many of these actors remain on boards for years, and make decisions that are somewhat behind the scenes. Given the size of pensions’ liabilities and assets, and the degree to which pensions rely on investments, these board members exert real influence. At the same time, boards are constrained by political, policy and economic factors. They are not up to the task of fixing pensions’ policy problems alone. Dealing with pensions’ most fundamental challenges will require broader political will that goes beyond the scope of boards’ powers.
Acknowledgements
The author thanks Sean Gailmard, Sarah Anzia, Paul Pierson, Margaret Weir, Anthony Bertelli, John Henderson, Robert Van Houweling, Phillip Rocco, Christpher Goodman, Doug Ahler, Jason Anastasopoulos and Stephen Goggin for comments and advice on this article. Additionally, the author thanks the Center for Retirement Research at Boston College for providing data on states’ plans and actuarial information. All errors are my own.
Supplementary material
To view supplementary material for this article, please visit https://doi.org/10.1017/S0143814X17000241