In the last three decades, the development of more effective transducers and innovations in Doppler modalities have allowed the gradual incorporation of intracardiac echocardiography during different types of percutaneous intervention.Reference Seward, Khandheria, McGregor, Locke and Tajik1–Reference Schwartz, Gillam and Weintraub5 Thus far, many studies have illustrated how continued improvements in the quality and user interface of intracardiac echocardiography have rendered it a commonplace guidance modality in procedures involving the atrial septum, the left atrial appendage, and the mitral valve.Reference Cao, Zabal, Koenig, Sandhu and Hijazi6–Reference Alkhouli, Hijazi, Holmes, Rihal and Wiegers9
Over the last 10–15 years, a few single-centre series have assessed the utility of intracardiac echocardiography in percutaneous pulmonary valve implantation. The majority of patients in these studies received the Melody valve (Medtronic, Inc., Minneapolis MN, USA), and the proportion of cases during which intracardiac echocardiography was used was low during their learning curves. The two largest of these studies had a combined patient number of 85 with an average rate of use of intracardiac echocardiography of only 11 cases per year, with more than 75% of these cases using the Melody valve.Reference Chessa, Butera and Carminati10–Reference Whiteside, Pasquali, Yu, Bocks, Zampi and Armstrong12
To date, the use of intracardiac echocardiography during percutaneous pulmonary valve implantation has been reserved as a substitute for trans-esophageal echocardiography (TEE) or to enhance fluoroscopic imaging during the evaluation of the newly implanted valve.
However, it is interesting how even when a good correlation has been reported between intracardiac echocardiography Doppler-derived gradients and other haemodynamic parameters, no study has evaluated the feasibility of using intracardiac echocardiography as a baseline haemodynamic surrogate to predict and track post-procedural routine transthoracic echocardiographic assessments.
We asked whether intracardiac echocardiography, which utilises the same technology as traditional echocardiographic evaluation, could be considered the functional assessment’s primary modality on percutaneous pulmonary valve implantation.
We hypothesised that gradients derived from intracardiac echocardiography Doppler would present a good correlation with transthoracic echocardiographic gradients, not only the day after the procedure but also with later echo evaluations offering a better start point for follow-up than invasive assessed gradient after percutaneous pulmonary valve implantation. We also hypothesised that intracardiac echocardiography gradients could be manipulated in a predictive model to define an expected Doppler-derived haemodynamic pathway for further evaluations of valve function and physiological response after percutaneous pulmonary valve implantation.
Material and methods
Study design
This is a retrospective single-centre study based on the chart review of patients who underwent percutaneous pulmonary valve implantation between September 2018 and December 2019. All such patients in whom an intracardiac echocardiogram was performed were included. Demographic data such as sex, age, weight, body mass index, primary cardiac diagnosis, right ventricle outflow tract subset and dysfunction, and procedural data such as type and diameter of the implanted valve were also collected.
As part of a post hoc data validation, the subsequent 25 consecutive patients who underwent percutaneous pulmonary valve implantation with intracardiac echocardiography assessment between January and July 2020 were then analysed to test our predictive equation. Data collection and analysis were conducted under the permission of the Colorado Multi Institutional Review Board (IRB).
Cardiac catheterisation
A standard right heart catheterisation with angiography was performed with fluid-filled catheters appropriate for patients’ size. Pressure gradients were obtained by pullback from the main pulmonary artery to the right ventricle. Peak-to-peak systolic pressure gradient was measured from superimposed pressure tracings of identical cycle lengths of the right ventricle and pulmonary artery. All procedures were performed under general anesthesia, following a similar protocol for all the patients during the study period.
Echocardiography
Intracardiac echocardiography was performed within 20 minutes of deployment of the valve, during the same procedure under general anesthesia and using an AcuNav catheter (Acuson IPX8, AcuNav 8F, Siemens Medical Health), evaluating the placement of the valve, the presence of complications such as tricuspid valve damage, presence of paravalvular leakage, pulmonary valve regurgitation along with recording the continuous and pulsed wave Doppler velocity profiles through the valve, with the intracardiac echocardiography catheter positioned in the right ventricle outflow tract with an angle of incidence of <10% to the flow through the valve. Continuous-wave velocities were used to estimate peak and mean gradients. Intracardiac echocardiography was performed by interventionists who have received specific training in this modality.
Intracardiac echocardiography was introduced into our standard protocol after considering the limitations described for transesophageal echocardiography and angiography in evaluating a newly implanted pulmonary valve. These include the relatively anterior position of the right ventricle outflow tract in the mediastinum and artifactual limitations caused by the presence of stent material.Reference Basman, Parmar and Kronzon13
The post-procedure transthoracic echocardiographics were performed following established protocols for evaluation, using Vivid E95 (GE Ultrasound, Milwaukee, WI, USA) interrogating Doppler transvalvular gradients in the parasternal short-axis view (Table 2). All transthoracic echocardiographic evaluations were reviewed and signed by an attending non-invasive cardiologist.
Images were saved in Digital Imaging and Communications in Medicine (DICOM) format to Syngo ® Siemens system (Siemens Healthcare, Erlangen, Germany). The parameters assessed in intracardiac echocardiography and transthoracic echocardiographic echocardiograms were the Doppler-derived pulmonary valve mean gradient and peak gradient using the modified Bernoulli equation from the post-valve deployment.
Baseline and procedural characteristics

Values are mean ± SD, median (IQR), or n (%).
BMI = body mass index; RV = right ventricle; TGA = transposition of the great arteries; TOF = tetralogy of Fallot.
Haemodynamics after PPVI

Values are in mmHg; mean ± SD [median (range)].
cPG = RV-PA catheter systolic gradient; iMG = intracardiac echocardiography mean gradient; iPG = intracardiac echocardiography peak gradient; tMG = transthoracic echocardiography mean gradient; tPG = transthoracic echocardiography peak gradient; t2MG = 1-month transthoracic echocardiography mean gradient; t2PG = 1-month transthoracic echocardiography peak gradient.
Statistical analysis
Statistical analysis was performed using SPSS version 22 (SSPS, Chicago, Illinois). Categorical data were summarised by frequency and percentage. Continuous data were classified based on their distribution, using mean and standard deviation for parametric data and median and interquartile range for non-parametric.
The relationship between intraprocedural gradients (intracardiac echocardiography and RV-PA) and post-procedure gradients (next-day and 1-month transthoracic echocardiographic) were evaluated with simple linear regression models, and those that presented moderate to strong correlations were introduced in a multilinear model. A predictive equation based on the strongest multilinear model was made. For all our analyses, a two-sided p-value <0.05 was considered significant.
The equation was tested in our population, and we estimated the difference between the post-procedure transthoracic echocardiographic and the predicted value and classified the results in the following categories: ±5 mmHg, or >5 mmHg.
Results
Patients and procedure
Baseline, procedure, and outcome characteristics are summarised in Table 1. During this period, patients were predominantly male (66.7%), with a median age of 19 years (range 4–47) and median body mass index of 20.4 kg/m2 (range 12.5–40.5). The most common cardiac diagnosis was tetralogy of Fallot (52.9%), with a mixture of significant stenosis and insufficiency as the most common pre-procedural physiology in our population (51%).
The pre-procedural right ventricle outflow tract subsets for percutaneous pulmonary valve implantation were similarly distributed in our population, with native outflow tract (defined as an outflow tract without prior placement of a bioprosthetic valve or a circumferential tube forming any part of the right ventricle outflow tract or the main pulmonary artery) described in 31.4%, conduits (e.g., Goretex/dacron tubes, xenografts, and homografts) in 37.2%, and previous bioprosthetic valve (valve in valve) in 31.4% of the patients.
The Edwards’ Sapiens 3® was deployed in 91.7% of our cases, with the rest of the valves being Medtronic Melody valves. Applying the modified Bernoulli equation, no increase in subvalvular velocity was observed prior to or after valve deployment in our population. A rate of 3.9% of intraprocedural complications was reported for our population during the study period, none of which were related to intracardiac echocardiography imaging. No reinterventions related to valve malfunctions or immediate complications were reported.
Haemodynamics from percutaneous pulmonary valve implantation
Values for catheter gradient, Doppler-derived gradients evaluated by intracardiac echocardiography, and transthoracic echocardiographic post-procedure for our population are shown in Table 2.
When gradients were compared, there was a notable discrepancy between intraprocedural haemodynamic gradients (peak-to-peak systolic pressure gradient and intracardiac echocardiography gradients) despite both modalities sharing similar conditions during their recording process. The largest difference was seen between the peak-to-peak gradient and the instantaneous intracardiac echocardiography peak gradient [3.4 ± 5.3 mmHg (median 3.5 mmHg, range from −12.1 to 13.6)] and the smallest was between the peak-to-peak gradient and the intracardiac echocardiography mean gradient [−0.3 ± 4.4 mmHg (median 1.1 mmHg, range from −14.7 to 6.1)].
Similarly, we found a significant level of difference among invasively evaluated gradients with post-procedure transthoracic echocardiographic-derived gradients. The largest disparity here was seen between the peak-to-peak pressure gradient and transthoracic peak instantaneous gradient [16.2 ± 8.6 mmHg (median 16.5 mmHg, range 0–36)], while the smallest difference was between the peak-to-peak gradient and the transthoracic echocardiographic mean gradient [6.8 ± 5.5 mmHg (median 6.8 mmHg, range from −6 to 19.5)] The intracardiac echocardiography-derived mean gradient also compared very favourably with the transthoracic echocardiographic mean gradient [7.1 ± 4.2 mmHg (median 6.4, range 0.6–18.2)]. The same trend was observed when invasive gradients were compared with 1-month transthoracic echocardiographic gradients. All these differences are showed in Table 3.
Observed differences between gradients after PPVI

Values are in mmHg; mean ± SD [median (range)].
cPG = RV-PA catheter systolic gradient; iMG = intracardiac echocardiography mean gradient; iPG = intracardiac echocardiography peak gradient; tMG = transthoracic echocardiography mean gradient; tPG = transthoracic echocardiography peak gradient; t2MG = 1-month transthoracic echocardiography mean gradient; t2PG = 1-month transthoracic echocardiography peak gradient.
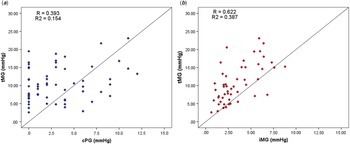
However, despite one of the smallest disparities seen between peak-to-peak systolic pressure gradient and transthoracic mean gradient, these parameters correlated poorly (R = 0.348, R2 = 0.121, p = 0.013), contrary to what was observed between the intracardiac echocardiography mean gradient and transthoracic echocardiographic mean gradient, which had a high correlation (R = 0.622, R2 = 0.387, p = <0.001). These models are shown in Fig 1.
Linear regression models between intraprocedural invasively assessed gradients and post-procedure non-invasively assessed gradients. ( a ) Shows the correlation between cPG with tMG. ( b ) Shows the correlation between iMG with tMG. The trend line (solid line) is also shown in the graphic. cPG = right ventricle to pulmonary artery systolic peak gradient, iMG = intracardiac echocardiographic mean gradient, tMG = transthoracic echocardiography mean gradient.

Multilinear regression model and predictive equation
Given the observations noted above, we used the intracardiac echocardiography mean gradient as the primary variable for a multilinear model to create an equation capable of predicting the transthoracic echocardiographic mean gradient, determining the feasibility of using intracardiac echocardiography to propose an expected Doppler-derived haemodynamic pathway after percutaneous pulmonary valve implantation. This model was adjusted using the variables device size (diameter) and body mass index.
As shown in Table 4, all these variables were statically significant (p-value <0.01) and did not present co-linearity (variance inflation factor between 1.0 and 1.5). This model is summarised in Table 5.
Correlation between gradients

Values are products of linear correlation models.
* p-Values <0.05, cPG = RV-PA catheter systolic gradient; iMG = intracardiac echocardiography mean gradient; iPG = intracardiac echocardiography peak gradient; tMG = transthoracic echocardiography mean gradient; tPG = transthoracic echocardiography peak gradient; t2MG = 1-month transthoracic echocardiography mean gradient; t2PG = 1-month transthoracic echocardiography peak gradient.
Multilinear regression model and predictive equation

Values are products of a multilinear regression model.
* p-Values <0.05, B = exponent; BMI = body mass index; iMG = intracardiac echocardiography mean gradient; NE = no standardised; VIF = variance inflation factor.
The predictive equation was tested in our data. The predicted values presented an average difference from the observed value of −0.5 ± 3.5 mmHg (median −0.6 mmHg, range from −7.5 to 7.9). In 84.4% of cases, the predicted values differed within a ± 5 mmHg range from the observed values. Likewise, when predicting the mean gradient 1 month after the intervention, the discrepancy with the observed value was 0.7 ± 3.5 mmHg (median 0.7 mmHg, range from −10 to 7), with 88% of predicted values differing less than ±5 mmHg from the observed value.
Similarly, when our equation was validated in 25 consecutive patients who had their procedures in the months after data collection (whose data were not included in the derivative calculations), the observed difference between the predicted and the observed value was 1.5 ± 3 mmHg (median 2 mmHg, range from −5.5 to 7.2), with only 12% of the values differing by >5 mmHg from the real value.
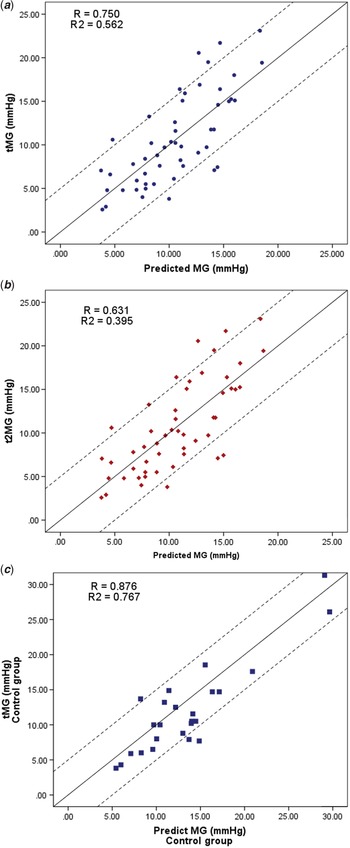
Linear models were conducted to evaluate the performance of our equation, showing that predicted values correlate well with transthoracic mean gradient 1 day after (R = 0.751, R2 = 0.564, p = 0.001) and 1 month after (R = 0.631, R2 = 0.395, p = 0.001) in the initial sample. Identical results were seen in the validation group (R = 0.876, R2 = 0.767, p = 0.001). These performances are shown in Fig 2.
Linear regression models between predicted gradients and actual non-invasively assessed gradients. ( a ) Shows the correlation between predicted mean gradient with tMG. ( b ) Shows the correlation between predicted mean gradient with t2MG. ( c .) Shows the correlation between predicted mean gradient with tMG in the control group. The trend line (solid line) and ±5 mmHg (dashed lines) are also shown in the graphic. tMG = next-day transthoracic echocardiography mean gradient, t2MG = 1-month transthoracic echocardiography mean gradient.

Discussion
Previous reports have highlighted the potential for practical anatomical and functional evaluation of newly implanted pulmonary valves with intracardiac echocardiography, describing a strong qualitative correlation with post-procedure transthoracic echocardiographic gradients. The temporal relationship between intracardiac echocardiography and the direct invasive measurement of a gradient by catheter pullback provides a reassuring gold standard comparator with a near-simultaneous intracardiac echocardiography assessment and suggests that intracardiac echocardiography evaluation immediately after valve deployment may offer a standardised starting point for Doppler-based follow-up evaluation.
We have proven that the current clinical standard practice of comparing the direct catheter-based pressure measurements after valve implantation with the post-procedure Doppler-derived gradients is inaccurate with weak correlation, confirming that we do not have a reliable parameter to predict and assess echo-derived haemodynamic evolution after this procedure.
Our hypotheses that intracardiac echocardiography Doppler-derived gradients offer an accurate estimate of early non-invasive evaluations and that they present a reliable baseline parameter to assess the evolution of valve function after percutaneous pulmonary valve implantation has been borne out.
Previous evidence has suggested that this would be the case. In 2008, a case report by Chessa et al. described intracardiac echocardiography used as an adjunctive imaging modality during percutaneous pulmonary valve evaluation, commenting on its efficacy for anatomical and functional assessment after valve deployment. No functional or Doppler data or correlations were included, and in this case, the intracardiac echocardiography catheter was placed via an arterial approach.Reference Chessa, Butera and Carminati10 Following this, Awad et al. reported their experience with intracardiac echocardiography during percutaneous pulmonary valve implantation, noting significant discrepancies between Doppler-derived transthoracic echocardiographic and intracardiac echocardiography gradients.Reference Awad, Masood and Gonzalez11
More recently, Whiteside et al. found a strong statistical association between intracardiac echocardiography gradients with post-procedural transthoracic echocardiographic gradients in a population using only the Medtronic Melody valve.Reference Whiteside, Pasquali, Yu, Bocks, Zampi and Armstrong12
In our data, the correlation between intracardiac echocardiography mean gradient and post-procedure transthoracic echocardiographic mean gradient was maintained until the 1-month post-procedure evaluation, and our equation allowed us to accurately predict this value in the majority of cases within a range of ±5 mmHg, suggesting a predictable course for Doppler-derived haemodynamic valve assessments during early follow-up. This allows us to predict a range of expected values for each patient, significant deviations from which should trigger heightened scrutiny and investigation of potential valve dysfunction.
Evidence to support our equation’s accuracy was obtained by cross-validating the formula in a validation set of 25 subjects who underwent percutaneous pulmonary valve implantation between January and July 2020. We found a strong correlation between the predicted and the real next-day transthoracic echocardiographic mean gradients, obtaining the same degree of positive results as observed with the original dataset. In this way, this validation of the model allowed us to minimise concerns about our results reproducibility and supports our initial findings that this equation can effectively estimate normal transthoracic echocardiographic gradients the following day, and 1 month following implantation, regardless of pre-procedure factors such as right ventricle outflow tract subset and valvular function. This type of validation has been widely used on cardiac models before.Reference Gomez and Doukky14,Reference Li, Levina and Zhu15
Previous descriptions have reported similar uses for Doppler-derived intracardiac echocardiography gradients in survival or complication rates for left-sided heart valve replacement, particularly in aortic valve replacement, showing that mean gradient is a good predictor of valve-related events.Reference Dandel and Hetzer16–Reference Murphy, Khan and Rassa19 We describe for the first time the expected evolution of Doppler-derived gradients for patients after percutaneous pulmonary valve implantation and propose that any deviation from the expected estimated pathway could be associated with a developing complication related to valve function, which may otherwise remain undetected until clinical symptoms appear.
Furthermore, our findings add new uses for intracardiac echocardiography in this setting and reinforce previous benefits of this modality. TEE in the assessment of percutaneous pulmonary valve implantation is often compromised by a combination of the distance of the right ventricle outflow tract from the oesophagus and the commonly found interposition of the stent and metallic valve support material, which produces significant echo artefact.Reference Basman, Parmar and Kronzon13,Reference Zoghbi, Chambers and Dumesnil20 Intracardiac echocardiography has further decreased our contrast and radiation usage as it takes the place of much of the utility of angiography after valve placement.Reference Zablah, Rodriguez, Leahy and Morgan21
Interestingly, our findings also showed how the use of Doppler-derived mean gradient represents a more reliable parameter than peak gradient for estimating real pressures, supporting previous descriptions that showed multiple benefits on the mathematical background of this parameter to correct some echocardiographic limitations. Whatsoever, physical concepts such as pressure recovery, as well as the intrinsic difference in measuring an instantaneous Doppler velocity, compared to a maximum peak-to-peak gradient by invasive catheterisation, necessitate differences in the contemplation of “gradient,” demonstrating how the correction of this feature is a controversial point, and more research focuses on its application is needed to create a robust conclusion.Reference Singh, Mowers, Marino, Balzer and Rao22–Reference Lima, Sahn and Valdes-Cruz24
In summary, we found a strong correlation between intracardiac echocardiography Doppler assessment immediately after percutaneous pulmonary valve implantation under general anesthesia and post-procedure conscious transthoracic echocardiographic measurements at the next day and 1 month. This quantitative association allowed us to create a predictive model distributed by body size and device size. This renders a simple equation defining a calculable range of normal expected Doppler values in patients early in their post-valve implantation course.
Limitations
This is a single-centre study. The procedures were performed by the same operators that have extensive experience with intracardiac echocardiography. This modality has multiple limitations and involves a learning curve to allow comfortable and confident usage in place of standard angiography.
Conclusion
There is a strong correlation between intracardiac echocardiography and post-procedure transthoracic echocardiographic. This allowed us to derive a predictive equation that defines the expected transthoracic echocardiographic Doppler-derived gradient following the procedure and at out-patient follow-up after percutaneous pulmonary valve implantation.
Financial support
This research received no specific grant from any funding agency, commercial or not-for-profit sectors
Conflicts of interest
None.
Ethics standards
Data collection and analysis were conducted under the permission of the Children’s Hospital of Colorado Institutional Review Board (Record IRB number 18-2138).