


Disability has been defined formally by the Australian Bureau of Statistics (2009, p. 27; 2019) as “a limitation, restriction or impairment, which has lasted, or is likely to last for at least six months and restricts everyday activities.” The purpose of this report is to map the impact of restrictions in the core activities of everyday life that make up a disability (i.e., self-care, communication, and mobility) on the two key areas of educational and vocational life. It is the fifth in a series of reports on the same topic, commencing in 1999 and examined further in 2014, 2015, and 2019 (Athanasou Reference Athanasou1999, Reference Athanasou2014, Reference Athanasou2015; Athanasou, Murphy, & Mpofu, Reference Athanasou, Murphy and Mpofu2019).
Most laypersons would recognize that the extent of disability is likely to have an influence on (a) how much a person learns or (b) how much they earn but they may (c) underestimate the extent of impact on the overall worklife and (d) develop stereotypes that limit the potential of persons with a disability in terms of workplace adaptations, affirmative action, or even discrimination. This report is based on a unique set of official data from the national household and establishment survey of disability by the Australian Bureau of Statistics (2019). The data are from households as well as persons in cared accommodation. The emphasis is educational–vocational and unless otherwise stated, the focus in this report is on those of working age, that is, 15–69 years.
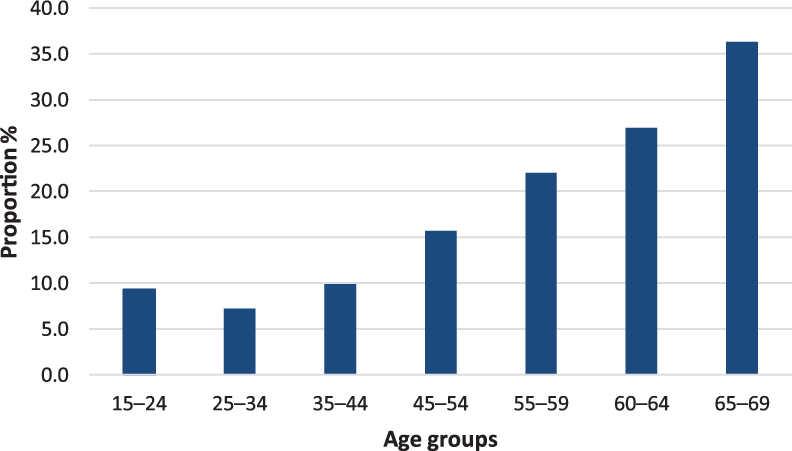
The number of persons with a disability in Australia in 2018 was 4.3 million and the overall proportion was around 17.7% of the population. The proportion varies from a low of 3.7% for the youngest age group (0–4 years) and increases directly with age, up to 84.6% for those over 90 years. Figure 1 indicates the proportions across the age groups 15–69 years.
Proportion in working age groups with a disability (Source: ABS, 2019, Table 1.3).

1. Disability Status
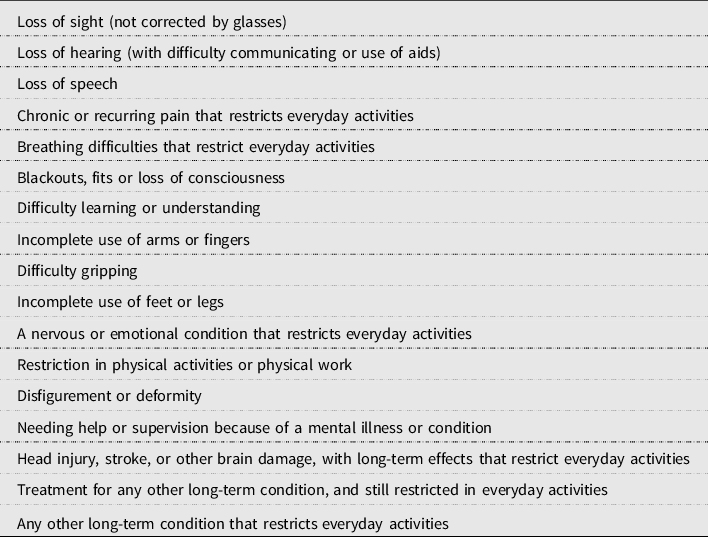
At the outset it may be helpful to recount for the reader the ways in which disability and restrictions are defined formally by the Australian Bureau of Statistics. These are linked with international classifications that focus on functioning rather than a specific disease or condition. First, a person has a disability if he/she has one of the conditions listed in Table 1 and which has lasted or is likely to last for six months or more.

In the official statistics, the limitations arising from a disability have been rated as profound, severe, moderate, or mild (see Table 2). This rating relates to a specific restriction across three core activities: (a) self-care (bathing or showering, dressing, eating, toileting, managing incontinency); (b) mobility (moving around at home and away from home, getting into or out of a bed or chair, and using public transport); and (c) communication (understanding and being understood by others – strangers, family, and friends) (Australian Bureau of Statistics, 2019).
Categorization of the extent of a disability

Source: Australian Bureau of Statistics (2019).
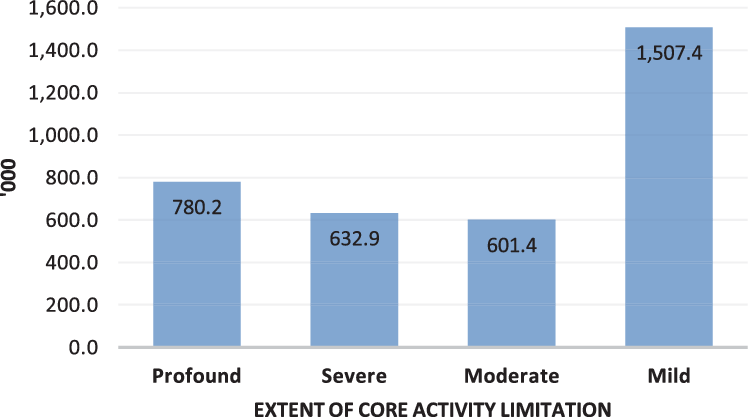
Just over 1 in 20 (5.7%) in the population had a disability with a profound or severe core activity limitation. This may also involve a schooling or employment restriction (1.97 million) or just under 8% of the entire population (7.98%). Among those with a disability, the largest number (43%) were in the mild core activity limitation group (see Fig. 2).
Numbers with a core activity limitation (Source: ABS, 2019, Table 3.1).

2. Schooling and Qualifications
One of the first community-wide disadvantages of disability appears typically in schooling. For instance, just over 16% or around 1 in 6 of those persons with a disability did not even complete Year 10 (i.e., a commonly accepted minimum standard for school leaving). As expected, the situation in schooling worsens and persons with a disability were much less likely to complete the highest level of secondary schooling. While 67.9% of those aged 15–64 years without a reported disability completed Year 12 only 43.6% of those with a disability completed the highest level of secondary schooling. The educational disadvantage continues at tertiary level where 32.8% of those without a disability obtained a bachelor degree or higher compared with 18.4% of those with a disability. The proportion without a post-school qualification is 41% for those with a disability compared with 34% for those with no disability.
3. Labor Force Participation
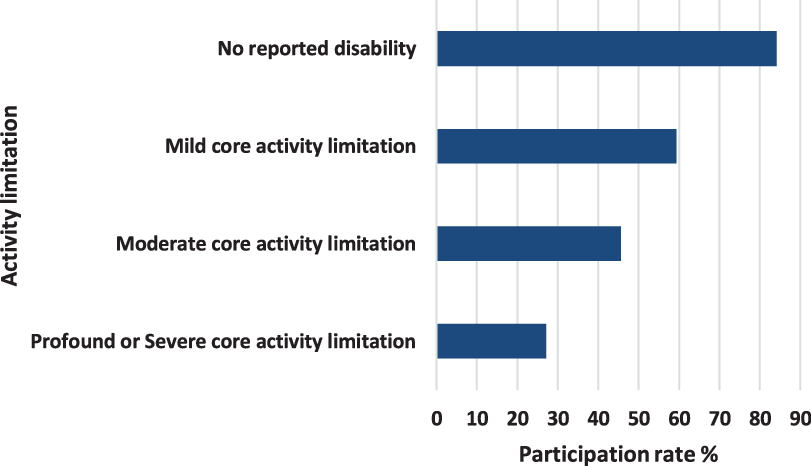
One of the many outcomes of disability appears in the field of employment. The participation rate in the labor force was lower for persons with a disability (53.4%) compared to those without a disability (84.1%). The impact is illustrated in Fig. 3.
Labor force participation rate and core activity limitations (Source: ABS, 2019, Table 8.1).

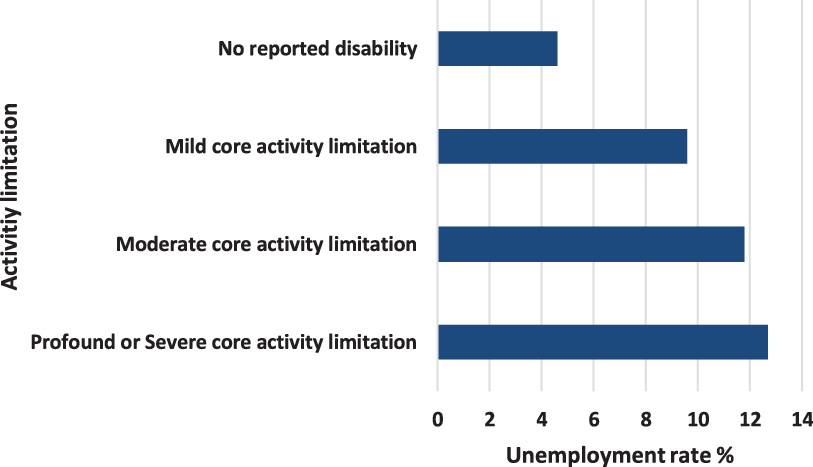
Even when people with a disability are ready to work, their labor force experience was accompanied by a higher rate of unemployment (10.3% for persons with disabilities compared with 4.6% for those without a disability – see Fig. 4). In addition, the rate of unemployment increased with the severity of disability and the rate of labor force participation decreased with the extent of disability. Persons with a profound or severe core activity limitation have an unemployment rate of 12.7% compared with 11.8% for those with a moderate restriction through to 9.6% for those with a mild core activity limitation and only 4.6% for those with no disability.
Unemployment rate and core activity limitations (Source: ABS, 2019, Table 8.1).

4. Types of Occupations
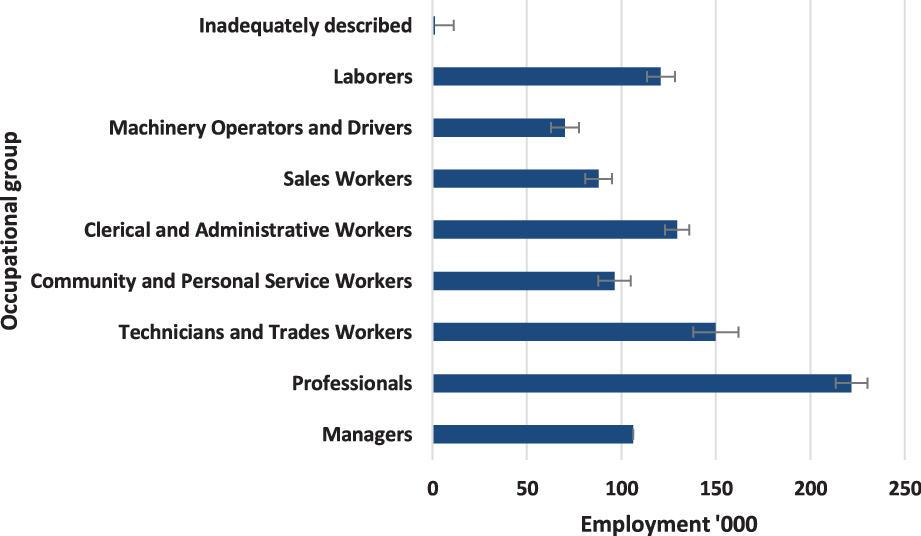
It is relevant for rehabilitation purposes to consider the types of work undertaken by those persons with disabilities. The types of work across the eight major occupational groups are shown in Fig. 5. Of the 984,200 persons with a disability, the pattern of employment across occupational groups shows a preponderance in the professional category. There are also large numbers in the technicians/trades as well as laborer groups.
Employment across all occupational groups for those with a disability – relative standard errors shown (Source: ABS, 2019, Table 9.1).

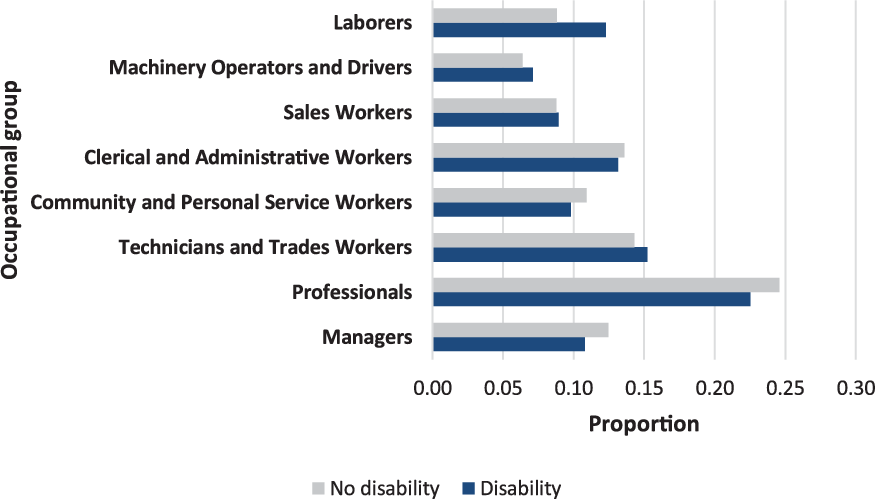
There might be a view that the pattern of employment across the different types of occupations might be different across all persons with and without a disability. Actually, the overall pattern for those with a disability (see Fig. 6) was similar to that for persons with no disability but because of the large numbers involved it was statistically significant (Chi-square (8) = 18.16, P = 0.02; Preacher, Reference Preacher2001).
Employment across all occupational groups for those with and without a disability (Source: ABS, 2019, Table 9.1).

5. Income
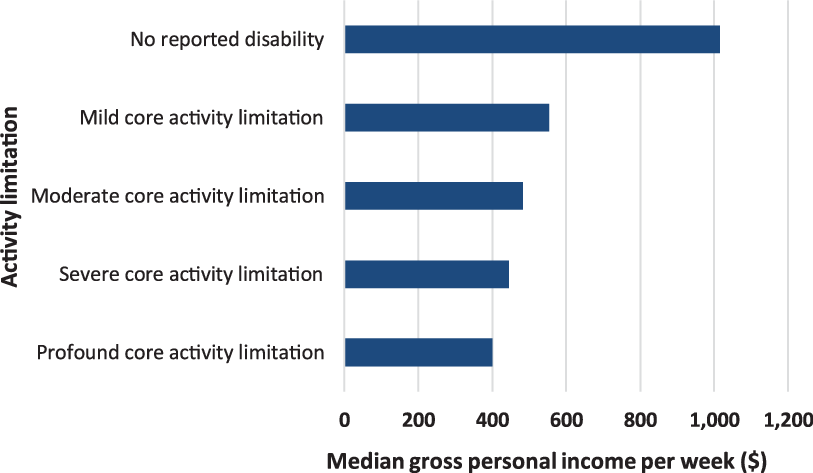
This section examines the impact of disability on income (includes government income). The median weekly income for persons without a disability was $1016 per week compared with $505 per week for those with a disability. Moreover, there was a direct decrease in income from those with the least limitation to those with the more severe core activity limitation. This is shown directly in Fig. 7.
Median gross income and core activity limitations (Source: ABS, 2019, Table 7.1).

6. Employment Restrictions, Support, and Discrimination
In addition to lower participation and higher unemployment as well as lower income, there were multiple sources of labor market limitations. These operated to limit the opportunity to work and may appear as (a) a restriction in the type of job (709,900 persons), (b) the number of hours (481,700 persons), or (c) difficulty changing jobs/getting a preferred job (587,400 persons). The proportions involved, however, vary depending on whether one was working full-time (447,400 persons) part-time (572,300 persons), whether one was unemployed (174,800 persons) or not in the labor force (587,200 persons). The proportion restricted in the type of job (see Table 3) was fairly even across groups. Restriction in the number of hours impacted on those working part-time but also impeded job-seeking for those who were unemployed and those not even in the labor force. Difficulty in changing jobs also appeared fairly uniform across groups. In terms of experiencing discrimination, this was reported by just over 300,000 out of 3.2 million (9.59%) (ABS, 2019, Table 20.1).
Restrictions in employment for persons with a disability

Note: All percentages rounded; Source: ABS (2019, Table 10.1).
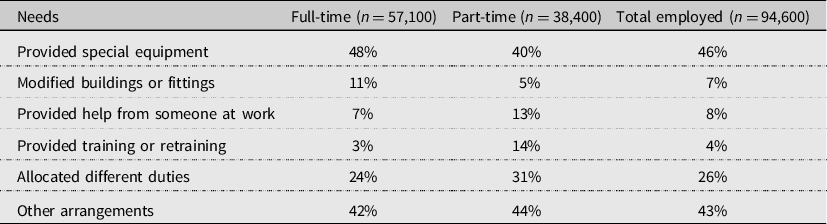
Around 18,900 out of a total of 39,900 employed persons with a disability aged 15–64 years were provided with ongoing supervision or assistance in the form of a disability support person. The areas in which other workplace arrangements were made are summarized in Table 4. Special equipment was provided in around 40–48% of cases; different duties were allocated in around a quarter of cases; but where the most improvement required is building modifications, providing support at work and providing training (see Table 4). Almost one-third avoid situations due to their disability (1,083,900 out of 3,271,900 – ABS, 2019, Table 22.1).
Need for special employer arrangements

Note: All percentages rounded; Source: ABS (2019, Table 10.1).
7. Worklife Expectancy
Much of the preceding disadvantage of disability in education and work can be portrayed by a single vocational outcome, namely worklife expectancy. Worklife expectancy is the estimated duration of someone’s working life.
In 1988, Gamboa attempted to determine the worklife expectancy of people with disabilities in the USA. This approach was developed principally for medico-legal purposes and in 1999, this was replicated for Australia (Athanasou, Reference Athanasou1999). By any standard, worklife expectancy is an important consideration as it combines educational and vocational factors into one practical metric.
With the release of the latest official statistics on disability and the labor force it is possible to update these worklife expectancies. The latest worklife estimates take into account the official categorization of disability, that is, profound/severe, moderate, mild, and no disability as well as age and gender. Whereas in the past the worklife expectancy had been calculated for each disability group to a retirement age of 65 years, this has now been extended to 69 years in line with societal changes and the available statistics in five-year age groups.
The basis for the calculation is to determine the joint probability of participation and employment at a particular age and to multiply this by the probability of life at that age. These were then summed for each age level to produce a worklife expectancy that is expressed in years for a person. A spreadsheet containing these calculations is available freely from the author upon request.
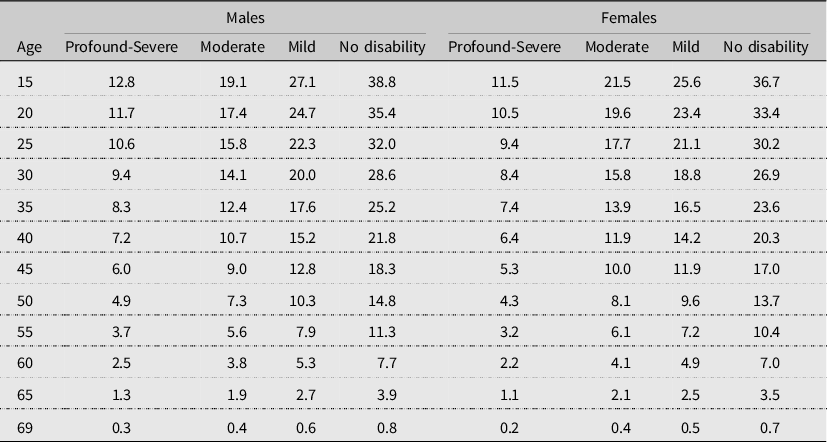
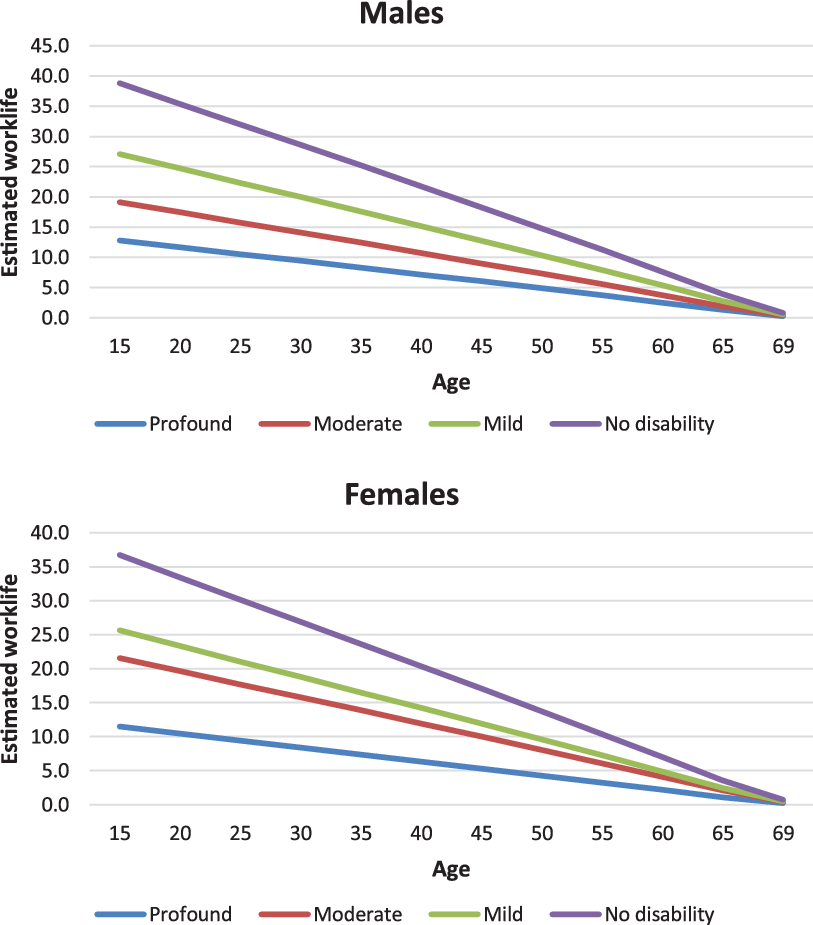
An abbreviated table at five-year age intervals for males and females is listed as Table 5 and illustrated in Fig. 8. In essence it shows how long one might be expected to work, given a level of disability. For instance, the tables showed that a 25-year-old female without a disability had a worklife expectancy to age 69 of 30.2 years, compared with only 9.4 years for a female of the same age with a profound-severe disability, 17.7 years with a moderate disability or 21.1 years for a mild disability.
Estimated worklife expectancy for different levels of disability at five-year age intervals

Estimated worklife expectancy for different levels of disability at five-year age intervals.

Some readers may have subtracted 25 years from 69 years and ended up with 44 years of remaining worklife for a female without a disability and may be wondering how the much lower figure of 30.2 years was calculated. First, some people die. Reference to life tables shows that from an original cohort of 100,000 newborn female babies, 90,524 will make it to age 69 years (Australian Bureau of Statistics, Life Tables Australia 2016–2019). A female aged 25 has a probability of 0.91 of surviving to age 69 and theoretically this gives around 41.96 uninterrupted years of working. Next others get sick or do not work. They are not in the labor force. So, this 41.96 years needs to be reduced by the probability of employment for females without a disability. This was set at 0.719 (it assumes a constant employment rate which is far from correct but at least it is a starting point). From where does the 0.719 come? It is the total number of females employed or seeking work out of the total female population. Unfortunately, this is an average and ideally one would really need the figure for each age group because labor force participation is definitely a function of age, let alone other factors such as education. Although one might vary this 0.719 to suit individual circumstances, it will have implications for working capacity over a lifetime.
The net effect of restricted educational and vocational potential is highlighted in reduced income and earning capacity over a lifetime. For those aged 15–64 years without a disability,Footnote 1 the median gross personal income per week was $1016 compared with $505 per week for those with a disability (ABS, 2019, Table 7.1). The median gross personal income per week is a direct function of the extent of disability limitation and Fig. 2 indicated this relationship. Overall, the increased disability resulted in lower median gross personal income per week. Almost assuredly this means that persons with a disability will suffer substantial if not massive economic disadvantage. This is highlighted by calculating lifetime earnings.
If the reader recalls the earlier example of our female aged 25 years without a disability, it is possible to estimate her available lifetime earnings and then this can be compared to a female of the same age with say, a mild disability. The only available income figures are for males and females combined and here are my calculations:
Female 25 years, no reported disability. Median gross income = $1016 multiplied by 30.2 years multiplied by 52 weeks = $1,595,526.
Female 25 years, mild disability. Median gross income = $555 multiplied by 21.1 years multiplied by 52 weeks = $608,946.
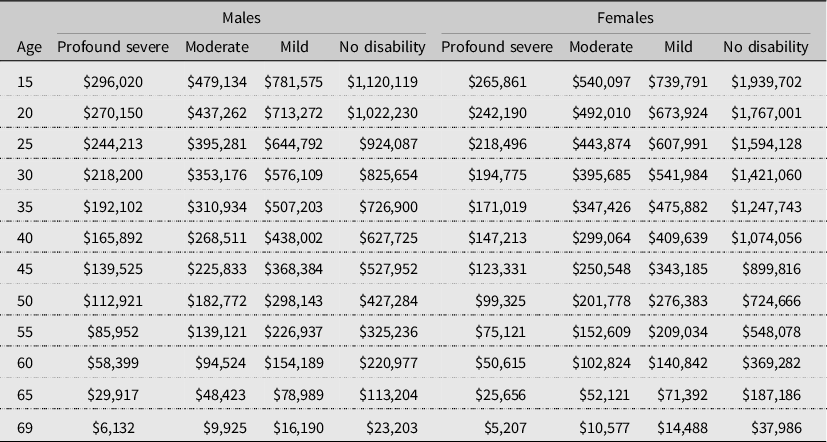
An overall summary of theoretical lifetime earning capacity for five-year interval age groups is provided in Table 6.
Estimated theoretical lifetime incomes for different levels of disability at five-year age intervals

Any comparisons need to take into account other factors (e.g., after tax income, other vicissitudes of life, longevity differences in the groups) but the general message is that the economic loss suffered through a disability is likely to be quite large. Of course, the disparities increase as the level of disability increases and the age of onset is younger. Needless to say, one should not extrapolate from general findings to a particular case, but this is a starting point to describe the overall background against which an individual might live, learn, work, and earn.
8. Concluding Comments
Disability in Australia is not only widespread but also deep in its educational and vocational consequences. This report focused on earning and learning; it described the schooling or employment restrictions of just over two million Australians aged 15–64 years. The officially reported aspects of mild to profound restrictions were compared to persons with no disability and the picture that has been painted is of uniform disadvantage.
Persons with a disability were less likely to complete the highest level of secondary schooling. They were less likely to obtain higher education qualifications. Their participation rate in the labor force (53.4%) was much lower than the 84.1% for those without a disability. Even when people are ready to work it was accompanied by a higher rate of unemployment (10.3% for persons with disabilities compared with 4.6% for those without a disability). Overall, for persons aged 15–64 years, income was reduced by half. The final section of the report highlighted the reduced worklife expectancy and the lifetime economic disadvantage of a restriction in communication, self-care or mobility.
These worklife expectancies encapsulate the real-life impact of disabilities on employment. The reader should note, however, that these are approximations and estimates. They made assumptions about participation rates at each age level. They should be interpreted with caution and they do not consider individual circumstances. Nevertheless, they provide a realistic backdrop for considering the likely extent of one’s future career, especially in relation to disabilities. Taking into account the level of participation, the extent of employment and one’s survival rate means that there is now a clearer perception of the overall vocational disadvantage suffered by people with disabilities in Australia. The disadvantage and its extent are quantified in part by these tables, and these may be of practical assistance in some forensic vocational contexts.
When the influence of all the factors is combined there is an overwhelming backdrop of disadvantage within which a person with a disability has to navigate their educational and vocational life. It is beyond the scope of this paper to suggest social or political remedies but at the professional level it highlights the need for vocational rehabilitation interventions to overcome personal and individual disadvantage. For instance, it is not clear that the vocational potential of persons with a disability is appreciated. They face workplace restrictions and discrimination. There is little in the way of affirmative action.
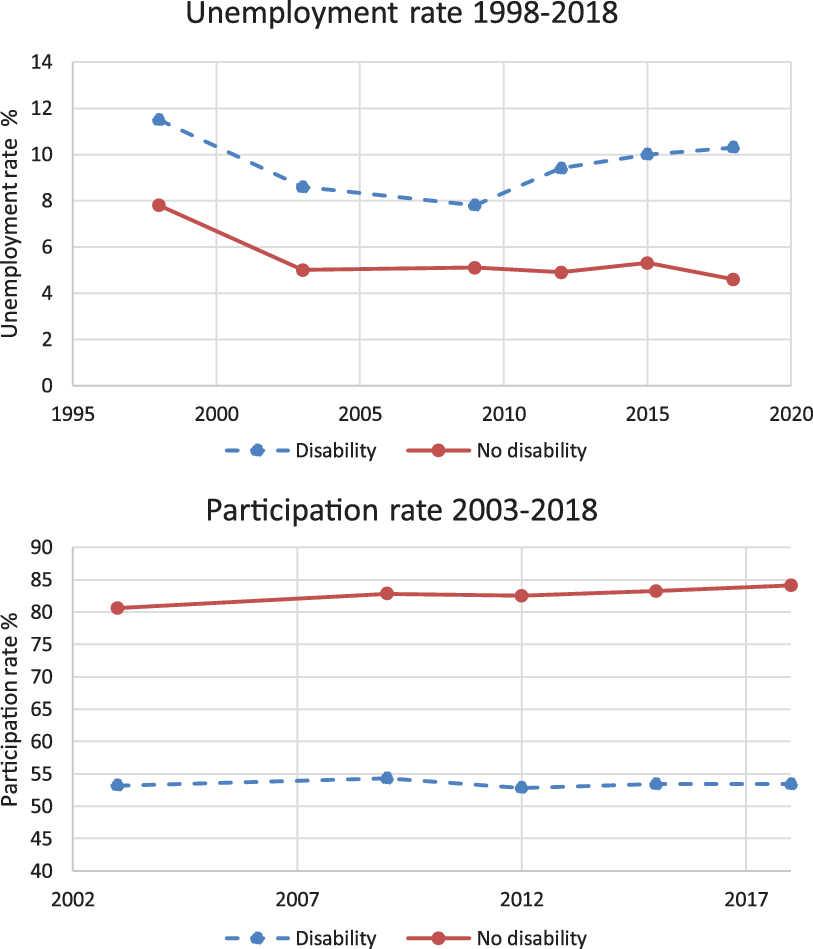
While such comments might seem hard or somewhat controversial, one only has to examine labor force participation rate and unemployment rates over a 20-year period to see that these have not kept pace with that of the wider community. The results are displayed Table 7 and illustrated graphically in Fig. 9. While general labor force participation has increased from 2003 to 2018, the labor force participation rate of persons with a disability has remained stubbornly constant. Since 2012 the unemployment rate for persons with a disability has increased markedly while that for persons without a disability has reduced. In simple terms, one might say that despite social and government policies to support persons with a disability, they seem to be at a greater disadvantage in recent years in the labor market.
Unemployment rates and labor force participation rates for person with and without disability 1988–2018

Unemployment rates and labor force participation rates for person with and without disability 1988–2018.

The most telling outcome of disadvantage was that of worklife expectancy. This has a flow-on effect to earnings. Overall, disability can be a lifetime sentence to financial poverty. Although it is beyond the remit of this paper to advocate policy solutions, a key issue for career-development professionals is how to overcome individual disadvantage. At the very least it is a social paradox that despite so many efforts, the unemployment for persons with a disability has increased in recent years and socially saddening that labor force participation rates have stagnated. The impact on worklife expectancy and lifetime earnings are a major source of personal disadvantage.
Conflict of interest
The research was not undertaken with any financial support or assistance. No conflict of interest is reported for this paper.