





1. Introduction
Pangolins are the only mammal with keratinous scales, which are unusually strong and used as a form of defence (Wang et al. Reference Wang, Yang, Sherman and Meyers2016). They are also one of the most illegally traded animals in the world (Challender Reference Challender2019), primarily because their scales are highly sought after in traditional Chinese and Vietnamese medicines (Xing et al. Reference Xing, Bonebrake, Cheng, Zhang, Ades, Shaw, Zhou, Challender, Nash and Waterman2019). Estimates that at least 895,000 animals were illegally traded between 2000 and 2019 (Challender et al. Reference Challender, Heinrich, Shepherd, Katsis, Challender, Nash and Waterman2019) are now thought to be a gross underestimate (Archer et al. Reference Archer, Turvey, Apale, Corona, Amada and Papworth2021; Emogor et al. Reference Emogor, Ingram, Coad, Worthington, Dunn, Imong and Balmford2021). Despite all species being listed in CITES Appendix I in 2017, the illegal trade continues to increase, and all species have declining populations (Challender et al. Reference Challender, Heinrich, Shepherd, Katsis, Challender, Nash and Waterman2019; UNODC 2020).
Prior to 2000, pangolins were rarely studied as they are mostly nocturnal, solitary and elusive animals (Challender et al. Reference Challender, Heinrich, Shepherd, Katsis, Challender, Nash and Waterman2019). They are also notoriously difficult to rear in captivity (Hua et al. Reference Hua, Gong, Wang, Li, Ge, Li and Huo2015; Zhang et al. Reference Zhang, Wu, Zou, Wang, Li and Shao2016). As a result, uncertainties surround the lifespan, demography and feeding habits of individual animals, hindering our understanding of how resilient populations are to poaching and environmental damage, and thus conservation efforts (Peitersen and Challender 2020).
Pangolin occur in tropical and subtropical Asia and sub-Saharan Africa and inhabit a wide range of ecosystems. For example, the Chinese (Manis pentadactyla), Sunda (Manis javanica) and Philippine (Manis culionensis) pangolins are found a range of forests (e.g. tropical, mixed coniferous and bamboo) as well as grasslands and agricultural landscapes (Chong et al. 2020; Schoppe et al. 2020; Wu et al. 2020). Pangolins feed almost exclusively on ants and termites (Lee et al. Reference Lee, Cheung, Fellowes and Guénard2017). Whilst some animals will eat a wide variety of species, others select specific prey. For example, in Sudan Temminck’s pangolin (Smutsia temminckii) fed on only 2 of 22 ant species (Sweeney 1956), whilst in Taiwan more than 70% of ant species extant in the region were found in faecal samples of the Chinese pangolin (Chao et al 2020). As such, pangolins are thought to play an important role within their ecosystems, and potentially in horticulture and agriculture, although this remains an under-studied area (Chao et al. 2020).
Recently, changes in diet and mobility throughout the life of a pangolin have been studied through elemental (Brandis et al. Reference Brandis, Meagher, Schoppe, Zawada, Widmann, Widmann, Dolorosa and Francis2023) and stable isotope (Pietersen et al. Reference Pietersen, Symes, Woodborne, McKechnie and Jansen2016) analysis of scales. However, we have relatively little information on how pangolin scales grow, so these studies currently lack a defined chronology and it is not possible to say whether the data obtained represents the diet consumed over a few weeks, a few years or the entire lifespan of an individual.
Early studies suggested that pangolin scales were likely to grow in a similar way to human fingernails because of their compositional and structural similarities (Spearman Reference Spearman1967). However, there is some disagreement in the literature over whether the scales grow continuously throughout life with the growing edge being abraded, or whether they stop growing as the animal reaches full size. It is also unclear whether scales that are lost can regrow (Maurice et al. Reference Maurice, Lionel Ebong, Fuashi, Godwill and Zeh2019; Pietersen et al. Reference Pietersen, Symes, Woodborne, McKechnie and Jansen2016).
Radiocarbon dating, commonly applied in archaeology and the geosciences, is starting to be used to answer ecological and forensic questions (Larsen et al. 2018). The method can be used in the recent past (<60 years) because above ground nuclear testing in the mid-20th century caused a rapid increase in the 14C:12C ratio in the atmosphere leading to what is known as the radiocarbon “bomb pulse” (Heaton et al. Reference Heaton, Bard, Ramsey, Butzin, Köhler, Muscheler, Reimer and Wacker2021). This ratio peaked in atmosphere between 1963 and 1964 and subsequently decreased as carbon was distributed through the earth’s carbon reservoirs.
Radiocarbon dating of the scales could allow us to assess
-
1. Demography. If the apex of the scale represents a date close to birth, it may be possible to use radiocarbon to assess the age of an animal contributing to demographic studies, in a similar way to radiocarbon dating of lungfish scales (Fallon et al. Reference Fallon, McDougall, Espinoza, Roberts, Brooks, Kind, Kennard, Bond, Marshall, Schmidt and Hughes2019).
-
2. Illegal trade mechanisms. If the distal attachment point represents the youngest continuously growing part of the scale, it may be possible to use radiocarbon to assess when an animal died, and therefore to identify e.g. the stockpiling of scales, in a similar way to ivory (Cerling et al. Reference Cerling, Barnette, Chesson, Douglas-Hamilton, Gobush, Uno, Wasser and Xu2016; Wild et al. Reference Wild, Kutschera, Meran and Steier2019) or hawkbill turtles (Van Houtan et al. Reference Van Houtan, Andrews, Jones, Murakawa and Hagemann2016).
-
3. Diet. Pangolins are thought to eat a mixture of ants and termites which can be difficult to separate with stable carbon and nitrogen isotopes (Hyodo Reference Hyodo2015; Hyodo et al. Reference Hyodo, Takematsu, Matsumoto, Inui and Itioka2011, Reference Hyodo, Matsumoto, Takematsu and Itioka2015; Pietersen et al. Reference Pietersen, Symes, Woodborne, McKechnie and Jansen2016). If a pangolin eats a large amount of wood-eating termites, we would expect them to ingest old carbon. Whilst this would hinder the ability of radiocarbon to be used as a dating method, it may allow radiocarbon to be used as a dietary isotope.
This study aims to evaluate which question(s) radiocarbon dating of pangolin scales could address, noting that the uncertainty of calibrated ages of samples dating between 1970 and 2010 is typically 1–3 years.
Stable isotope analyses have been undertaken alongside radiocarbon dating to aid interpretation, building on publications such as Pietersen et al. (Reference Pietersen, Symes, Woodborne, McKechnie and Jansen2016) and Brandis et al. (Reference Brandis, Meagher, Schoppe, Zawada, Widmann, Widmann, Dolorosa and Francis2023). δ13C is used to begin to assess whether radiocarbon may be affected by old carbon introduced to the food chain by termites eating old, decaying wood. δ13C largely reflects differences at the base of the food chain and is able to distinguish between food chains that are based on plants using the C3 and C4 food chains (Van der Merwe Reference van der Merwe1982). Within this study, δ13C will enable pangolins feeding in grasslands (including C4 plants) to be distinguished from those feeding in forests (mostly C3 plants) where termites are more likely to eat old wood. δ15N is routinely analysed alongside δ13C. Reasons for variation are complex but include trophic level effects and factors affecting the cycling of nitrogen in soil such as aridity (Schoeninger and DeNiro Reference Schoeninger and DeNiro1984; Stevens et al. Reference Stevens, Pederzani, Britton and Wexler2025). It is presented here as a second dietary isotope to continue to explore dietary variation following Pietersen et al. (Reference Pietersen, Symes, Woodborne, McKechnie and Jansen2016) and Brandis et al. (Reference Brandis, Meagher, Schoppe, Zawada, Widmann, Widmann, Dolorosa and Francis2023). δ18O reflects drinking water (Pederzani and Britton Reference Pederzani and Britton2019). If seasonal changes in δ18O occur, it may provide a complementary method to radiocarbon to establish how quickly a scale grows.
Materials and methods
To test which information is being recorded in the radiocarbon record in pangolin scales, the ideal sample would include scales from wild animals with known date of birth and death. Unfortunately, we were unable to find animals meeting these criteria as tagging efforts have only recently begun (Morin et al. Reference Morin, Challender, Ichu, Ingram, Nash, Panaino, Panjang, Sun, Willcoxs, Challender, Nash and Waterman2019; Willcox et al. Reference Willcox, Nash, Trageser, Kim, Hywood, Connelly, Ichu Ichu, Kambale Nyumu, Mousset Moumbolou, Ingram and Challender2019). Instead, two groups of pangolin scales were used, one from a museum and one from scale clippings of wild pangolins. Although all museum samples have an accession number before which the animal must have died and entire scales can be sampled, some samples lack information about date of birth, and date and location of death is not always clearly noted. Additionally, the scales have been curated for several decades, increasing the possibility for the addition of carbon contamination. Scale clippings avoid many of these problems, with collection date and location securely known. However, they do not allow us to analyze the entire scale, and birth date remains unknown. Despite these limitations, the study provides a first glimpse of what radiocarbon dating can reveal about pangolins, and insectivores more broadly, setting the basis for future work.
The first group consists of whole scales from four adult animals from the Australian Museum (Table 1, Supp. Figure 2). Two Chinese pangolin (M46704 and 46705) were accessioned in the museum in January 1978. Both animals are from China, but no detailed information about the place or date of capture is recorded. One specimen of Sunda pangolin (M11898) was wild caught in October 1980 in West Kalimantan. Although all three specimens were preserved in ethanol, this is unlikely to affect the measured radiocarbon age (Strzepek et al. Reference Strzepek, Thresher, Revill, Smith, Komugabe and Fallon2014). To assess consistency in ages, three scales were sampled from M46704 (labelled a–c). A final scale from a Sunda pangolin (M3731) was accessioned in the museum in 1926, and again has no information regarding date or place of capture. This scale was taken from a pelt and had not been preserved in ethanol. However, it is pre-bomb and of less use in this study.

Table 1. Long description
The table presents detailed information about analyzed scales from various pangolin species. It includes columns for sample name, species, collection location, collection type and date, and analyses performed. The table has 8 rows and 5 columns. The first row lists sample names such as M46704 scale a, scale b, and scale c, and M46705, all from the Australian Museum specimens. The species column identifies M. pentadactyla and M. javanica. Collection locations include China, West Kalimantan, and unknown. Collection type and date vary, with some specimens accessioned in January 1978 and others in 1926 or wild caught in October 1980. The analyses performed column lists various tests including 14C, δ13C, δ15N, and δ18O. The table also includes information about scale clippings from Manis culionensis captured in 2018 in Palawan, Philippines. Each row provides specific details about the samples, their origins, and the types of analyses conducted.
The second group of scales from Philippine pangolin was collected by the Katala Foundation in collaboration with the Taronga Conservation Society from the island of Palawan, Philippines between 18th November 2018 and 13th December 2018 (Supp. Figure 3), and have previously been studied by Brandis et al. (Reference Brandis, Meagher, Schoppe, Zawada, Widmann, Widmann, Dolorosa and Francis2023). This group consists of scale clippings from eight live wild caught animals, before release. A clipping of 1–2 cm2 was taken from the proximal apex. Scales were collected from two locations (scales 1–6 from one, and 7–8 from another) on Palawan which cannot be disclosed because of the threat from poaching. The samples were originally collected for a separate study (Brandis et al. Reference Brandis, Meagher, Schoppe, Zawada, Widmann, Widmann, Dolorosa and Francis2023) and remaining material has been analyzed here. The pangolin samples used in this study were collected under permits GP 2018-05-R2 and GP 1760081762462, granted by the Palawan Council for Sustainable Development Staff (PCSDS) to Katala Foundation Inc. c/o Dr Sabine Schoppe. Sampling by the Taronga Conservation Society was completed under CITES permit WT2019-000849, UNSW Animal Care and Ethics Committee number 18/127B.
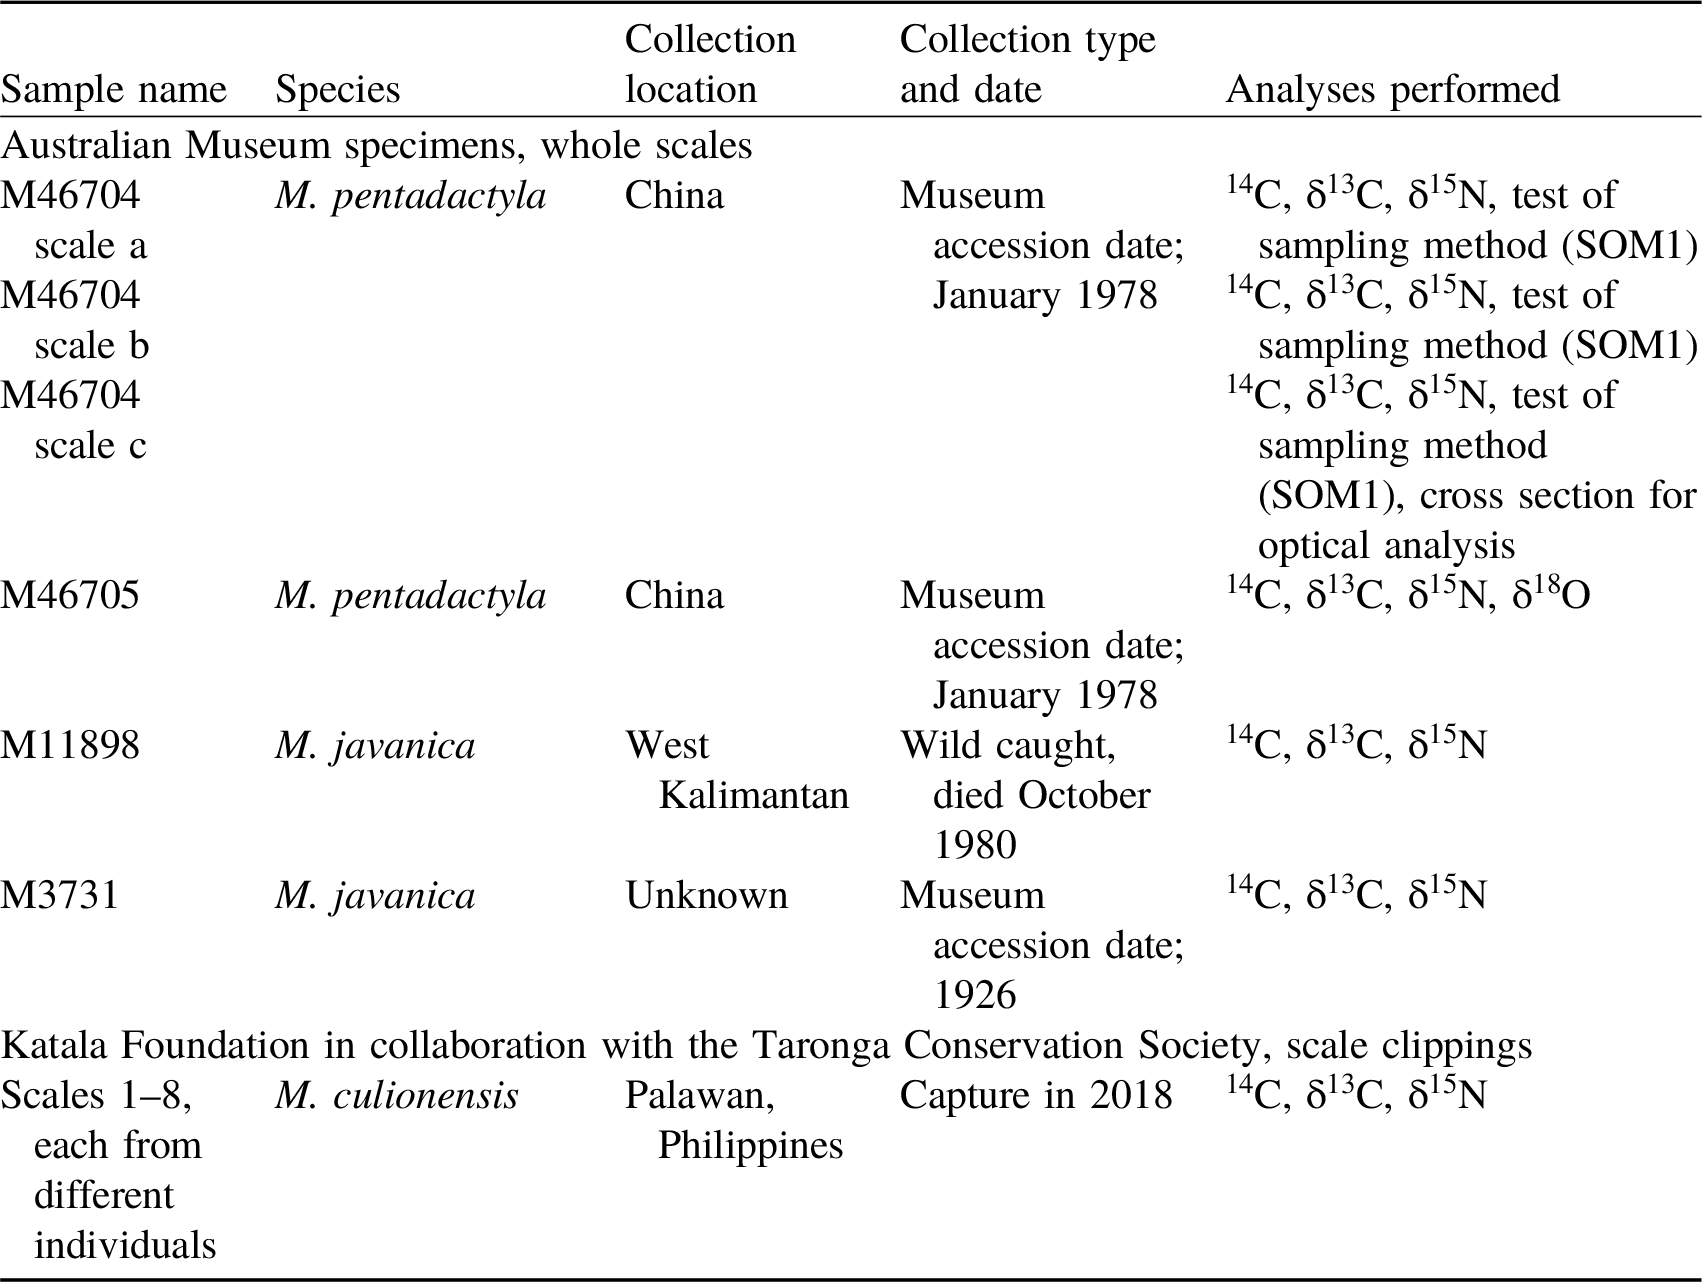
To investigate scale morphology prior to sampling, M46704c was cut along the median plane (apex to attachment point, Figure 1a) to reveal a cross section. Throughout this paper, “attachment point” refers to the end of the scale that is attached to the skin, and “apex” the point furthest from the attachment. The ‘proximal’ side faces towards the skin, and the “dorsal” side faces away from the skin. The cross section was mounted in epoxy and polished, finishing with 1 μm diamond polishing solution and the section was inspected with a Leica DFC310FX reflective light optical microscope. Three layers can be defined by cell shape and orientation (Figure 1b, ventral, middle and dorsal) as previously identified in pangolin scales (Wang et al. Reference Wang, Yang, Sherman and Meyers2016). They also show what appear to be growth lines, with some appearing stronger than others (Figure 1c and d). It is unclear what causes these lines or what periodicity they have. However, if they represent isochrons, they imply that growth occurs from three directions around the scale bed, in a similar way to human fingernails (De Berker et al. Reference de Berker, Wojnarowska, Sviland, Westgate, Dawber and Leigh2000). The dorsal surface of pangolin scales has a series of transversal and longitudinal ridges, but these do not appear to be closely related to the growth lines seen in cross section.
Anatomy of a pangolin scale: a) dorsal and ventral sides of M3731 (Sunda pangolin), b) cross section showing the three layers, dorsal, middle and ventral, c) schematic, and d) photograph of scale M46704c (Chinese pangolin) showing how this scale would sit within the epidermis. Major growth lines (gray), direction of growth (red arrows, following Spearman Reference Spearman1967) and area where wear is observed (dots) are marked.

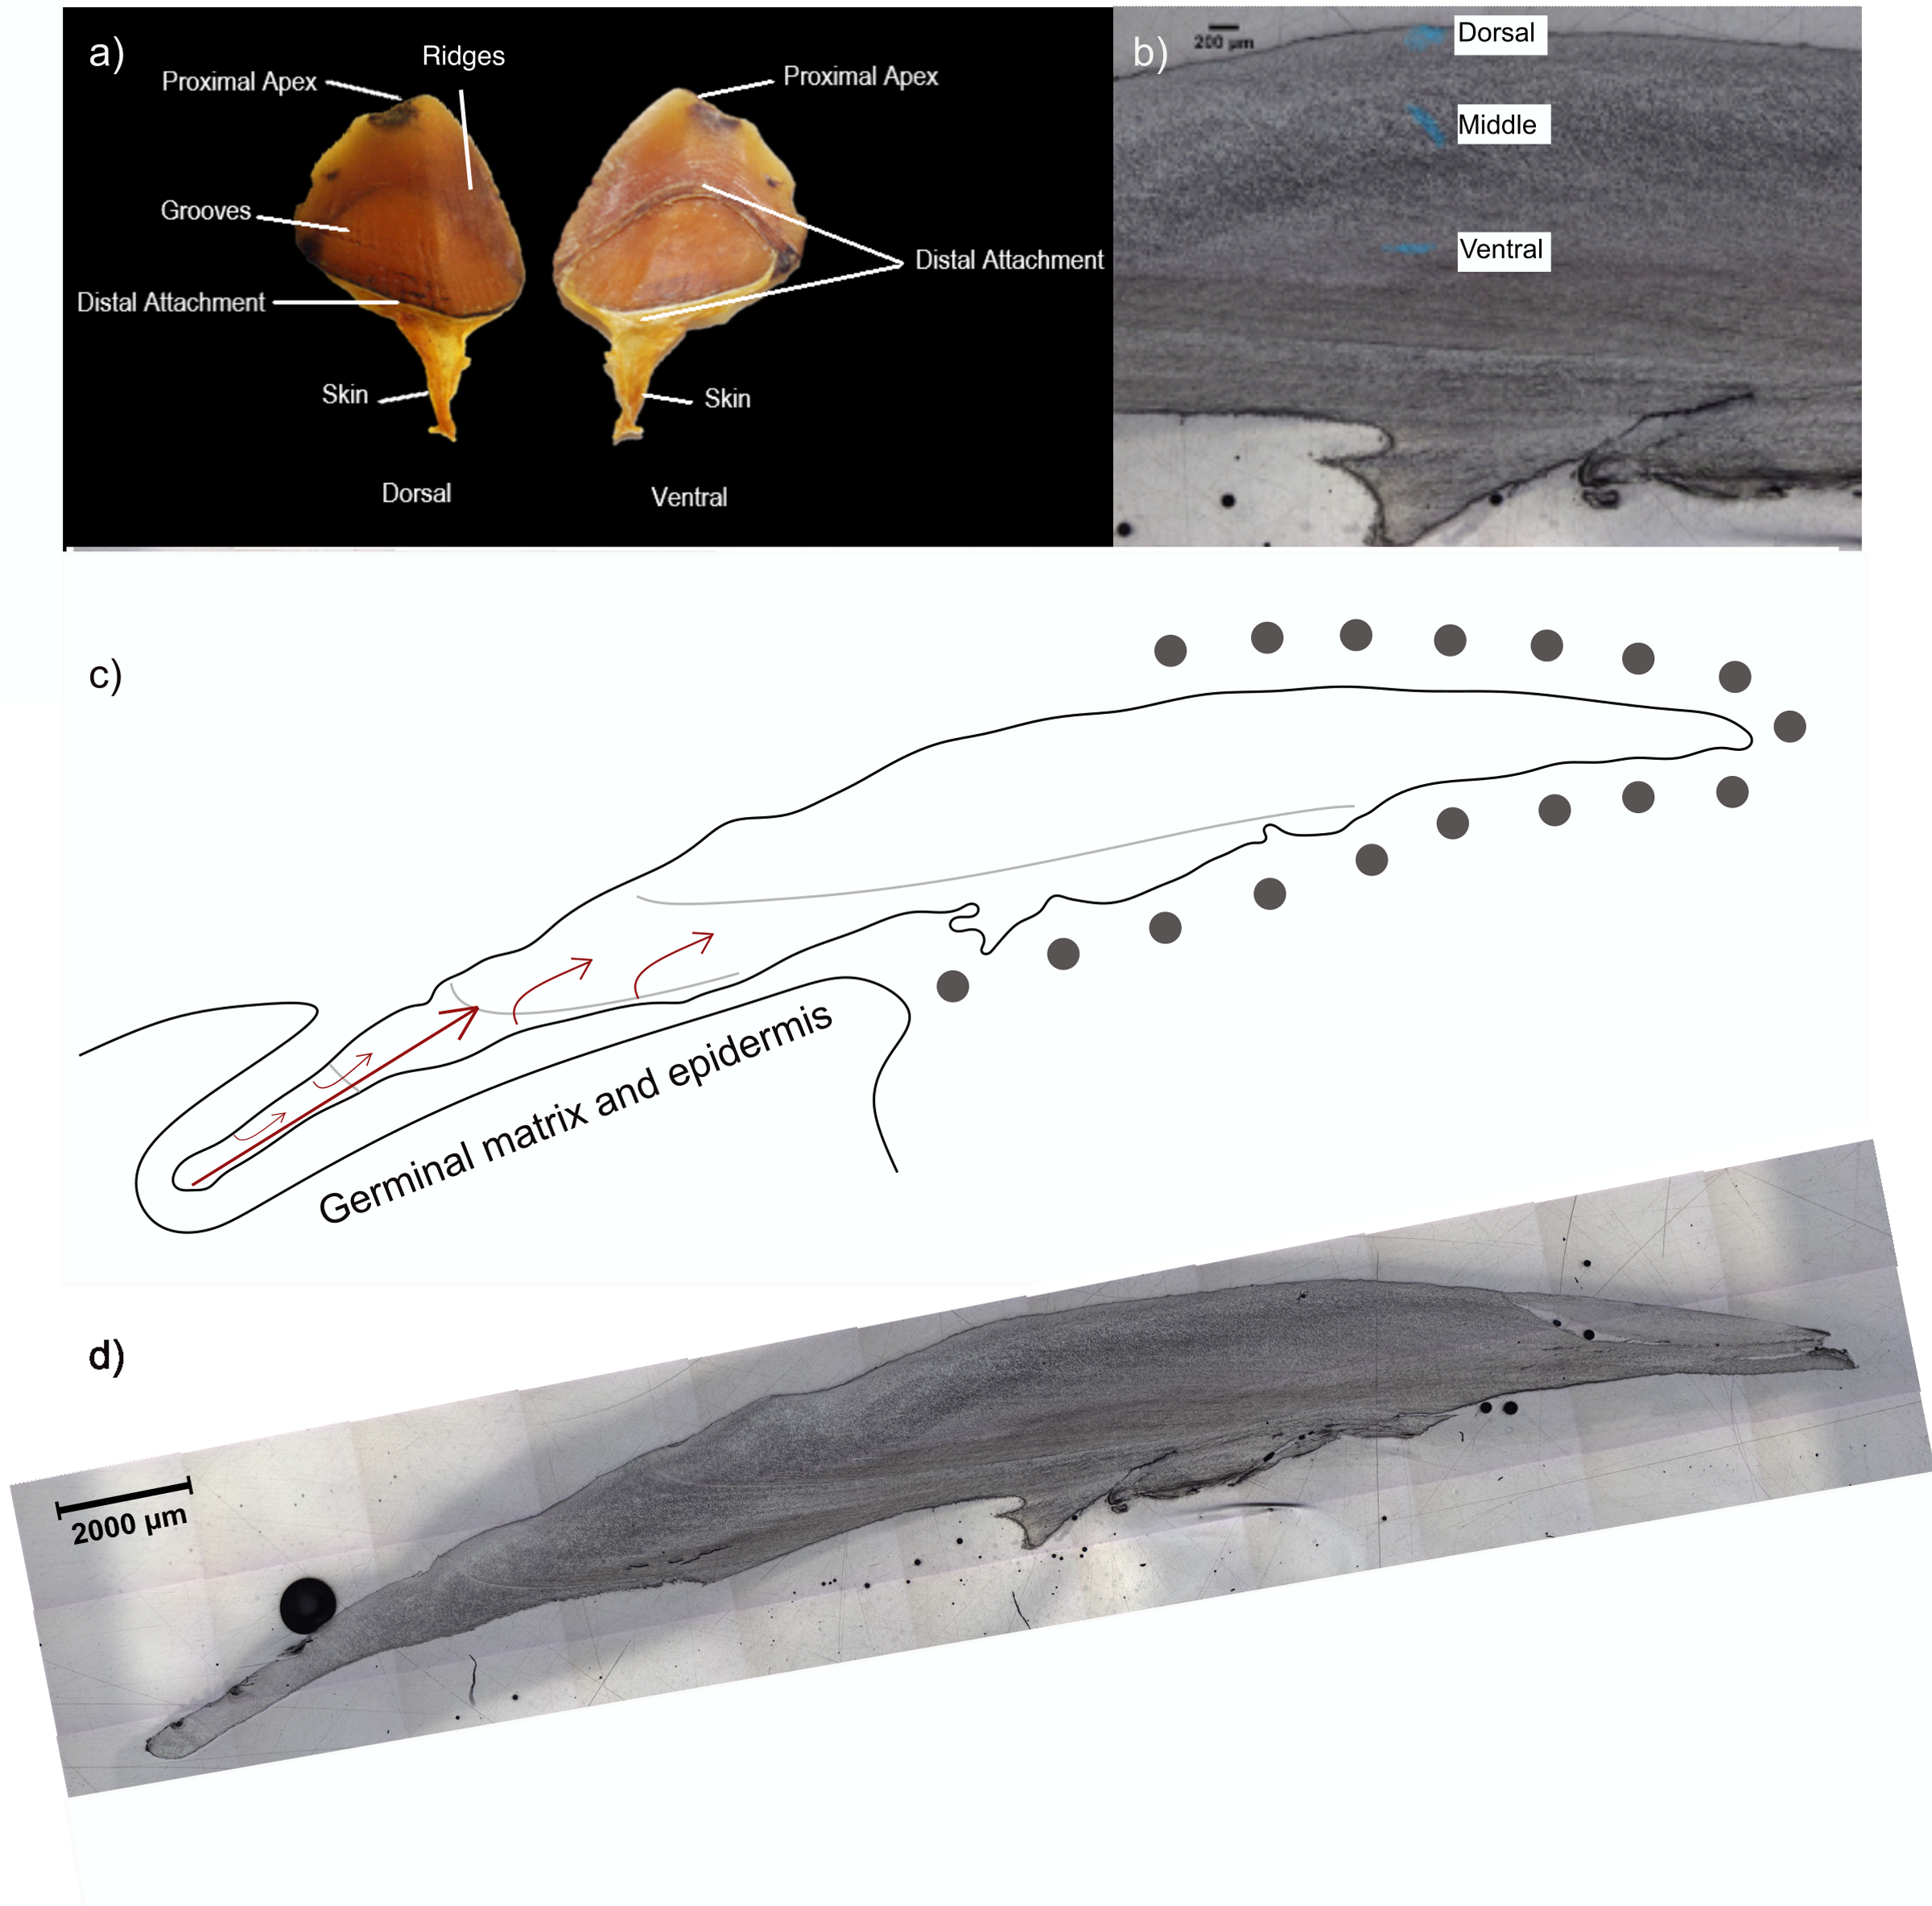
For isotopic analysis, a strip ca. 2 mm wide was cut from the central axis from most scales (Figure 2a). For m46704a and b “transverse slices” were taken (Supp. Figure 1). Scale close to the attachment point is closer in age to death/ collection and scale at the apex is closer to birth. To limit time averaging, we aimed to remove dorsal and ventral layers prior to sampling for isotope analysis with a handheld DremelTM drill and diamond drill bit. However, repeated analysis of scales M46704a, b and c suggest that time averaging effects are unlikely to cause problems, as a variety of sampling procedures gave indistinguishable results (SOM 1). All data is provided in the Supplementary Online Material (Supp. Tables 2–8). The strip was then cut into slices weighing approximately 1–2 mg, allowing the radiocarbon measurements to be fitted to the calibration curve (Figure 2b).
Sampling and radiocarbon analysis of a pangolin scale. A scale from a Sunda pangolin is shown for reference (M11898). a) Slices were taken from a strip taken from the proximal apex to the distal attachment point. The location of the clipping taken by the Katala Foundation on live animals in Palawan is indicated, demonstrating that only the apex is included. b) Schematic outlining how the radiocarbon analyses across the scale could produce an age estimate by comparison to the radiocarbon bomb curve (Hua et al. 2020; Ramsey Reference Ramsey2009a). During this period, the F14C in the atmosphere almost doubled due to the production of high energy neutrons from above ground nuclear detonations but has since dropped to c.1950 levels.

More than 10 slices were cut from the scales sampled from the Australian Museum. Up to five slices were selected for radiocarbon dating, and the remaining samples used for stable isotope analysis. Only the section of the scale closest to the apex is present in the scale clippings from Palawan (Figure 2a). For these samples, two slices were collected from the apex, and two from the end closest to the distal attachment. Of each pair, one was used for radiocarbon and one for δ13C and δ15N analysis. All samples were washed in ethanol, defatted in a 2:1 mixture of dichrolomethane and methanol, rinsed in ultrapure water and dried in a 40 °C oven.
For radiocarbon dating, samples were combusted in an evacuated quartz tube in the presence of CuO wire and Ag foil. The resulting CO2 was cryogenically collected and purified and graphitized over an Fe catalyst in the presence of H2. Graphite was dated at the NEC Single Stage AMS at the Australian National University (Fallon et al. Reference Fallon, Fifield and Chappell2010). Dates were calculated using an AMS derived δ13C using standard methods (Stuiver and Polach Reference Stuiver and Polach1977). A fingernail, cut on 22 February 2022, was used as a substrate matched standard and pretreated alongside the pangolin scales to assess whether contaminants were added during preparation. At first, we aimed to produce graphite targets containing 1 mg C. However, the high sulfur content of the keratin caused problems graphitizing, and remaining targets were made of 0.5 mg C.
Calibration of pre-bomb samples was performed using a 50:50 mix of the IntCal20 (Reimer et al. Reference Reimer, Austin, Bard, Bayliss, Blackwell, Bronk Ramsey, Butzin, Cheng, Edwards, Friedrich, Grootes, Guilderson, Hajdas, Heaton, Hogg, Hughen, Kromer, Manning, Muscheler, Palmer, Pearson, van der Plicht, Reimer, Richards, Scott, Southon, Turney, Wacker, Adolphi, Büntgen, Capano, Fahrni, Fogtmann-Schulz, Friedrich, Köhler, Kudsk, Miyake, Olsen, Reinig, Sakamoto, Sookdeo and Talamo2020) and SHCal20 (Hogg et al. Reference Hogg, Heaton, Hua, Palmer, Turney, Southon, Bayliss, Blackwell, Boswijk, Bronk Ramsey, Pearson, Petchey, Reimer, Reimer and Wacker2020) calibration curves, whilst post-bomb calibration was performed using the NH3 calibration curve (Hua et al. Reference Hua, Turnbull, Santos, Rakowski, Ancapichún, de Pol-Holz, Hammer, Lehman, Levin, Miller, Palmer and Turney2022) in OxCal v.4.4 (Ramsey Reference Ramsey2009a) with a resolution of 0.2 calyr–1. Age models were produced using the P_Sequence model in OxCal (Ramsey Reference Ramsey2008) and all measurements were assumed to have a 5% prior probability of being an outlier within the General t-type Outlier Model (Ramsey Reference Ramsey2009b). In some cases, a prior assumption needed to be made that the start Boundary fell between 1965 and 2000. All CQL2 code is given in SOM5.
δ13C and δ15N were analyzed on a Sercon 20-22 IRMS connected to an ANCA GSL operating in continuous flow mode. An inhouse gelatin standard was used to correct for drift during the run, and data was corrected using a multipoint scaling process using USGS40, USGS61, USGS65 and IAEA-C6. Uncertainty was assessed by repeat measurements of the in-house gelatine standard and was less than 0.2‰ for both δ13C and δ15N. The C:N ratio was assessed to determine whether large amounts of contaminant were present in the keratinous scale.
δ18O was initially analyzed using an ion probe (SI-SHRIMP) (Ávila et al. Reference Ávila, Ireland, Holden, Lanc, Latimore, Schram, Foster, Williams, Loiselle and Fu2020, Ireland et al. Reference Ireland, Clement, Compston, Foster, Holden, Jenkins, Lanc, Schram and Williams2008). However, we were unable to produce enough oxygen to obtain accurate analyses, and so slices from one sample (M46705) were analyzed for δ18O using an TC/EA coupled with Delta XL Mass Spectrometer in continuous flow mode (Thermo-Fisher Scientific) at the University of Western Australia. Results have been normalized to VSMOW scale based on USGS42 and USGS43 and equilibration method (Coplen and Qi Reference Coplen and Qi2012). The uncertainty of δ18O IRMS analyses is 0.5‰.
Results and discussion
Optical analysis
Images of the scale cross sections show clear indications of wear with, for instance, the dorsal layer fully removed close to the apex of M46705 (Supp. Figure 2). This strongly supports the observation that pangolin scales continue to grow during life and are worn away (Spearman Reference Spearman1967; Wang et al. Reference Wang, Yang, Sherman and Meyers2016). It is therefore unlikely that a date at the apex represents a date close to birth for older animals and where wear is present. In these cases, it is not possible to use radiocarbon to determine the age of an animal.
Radiocarbon dating
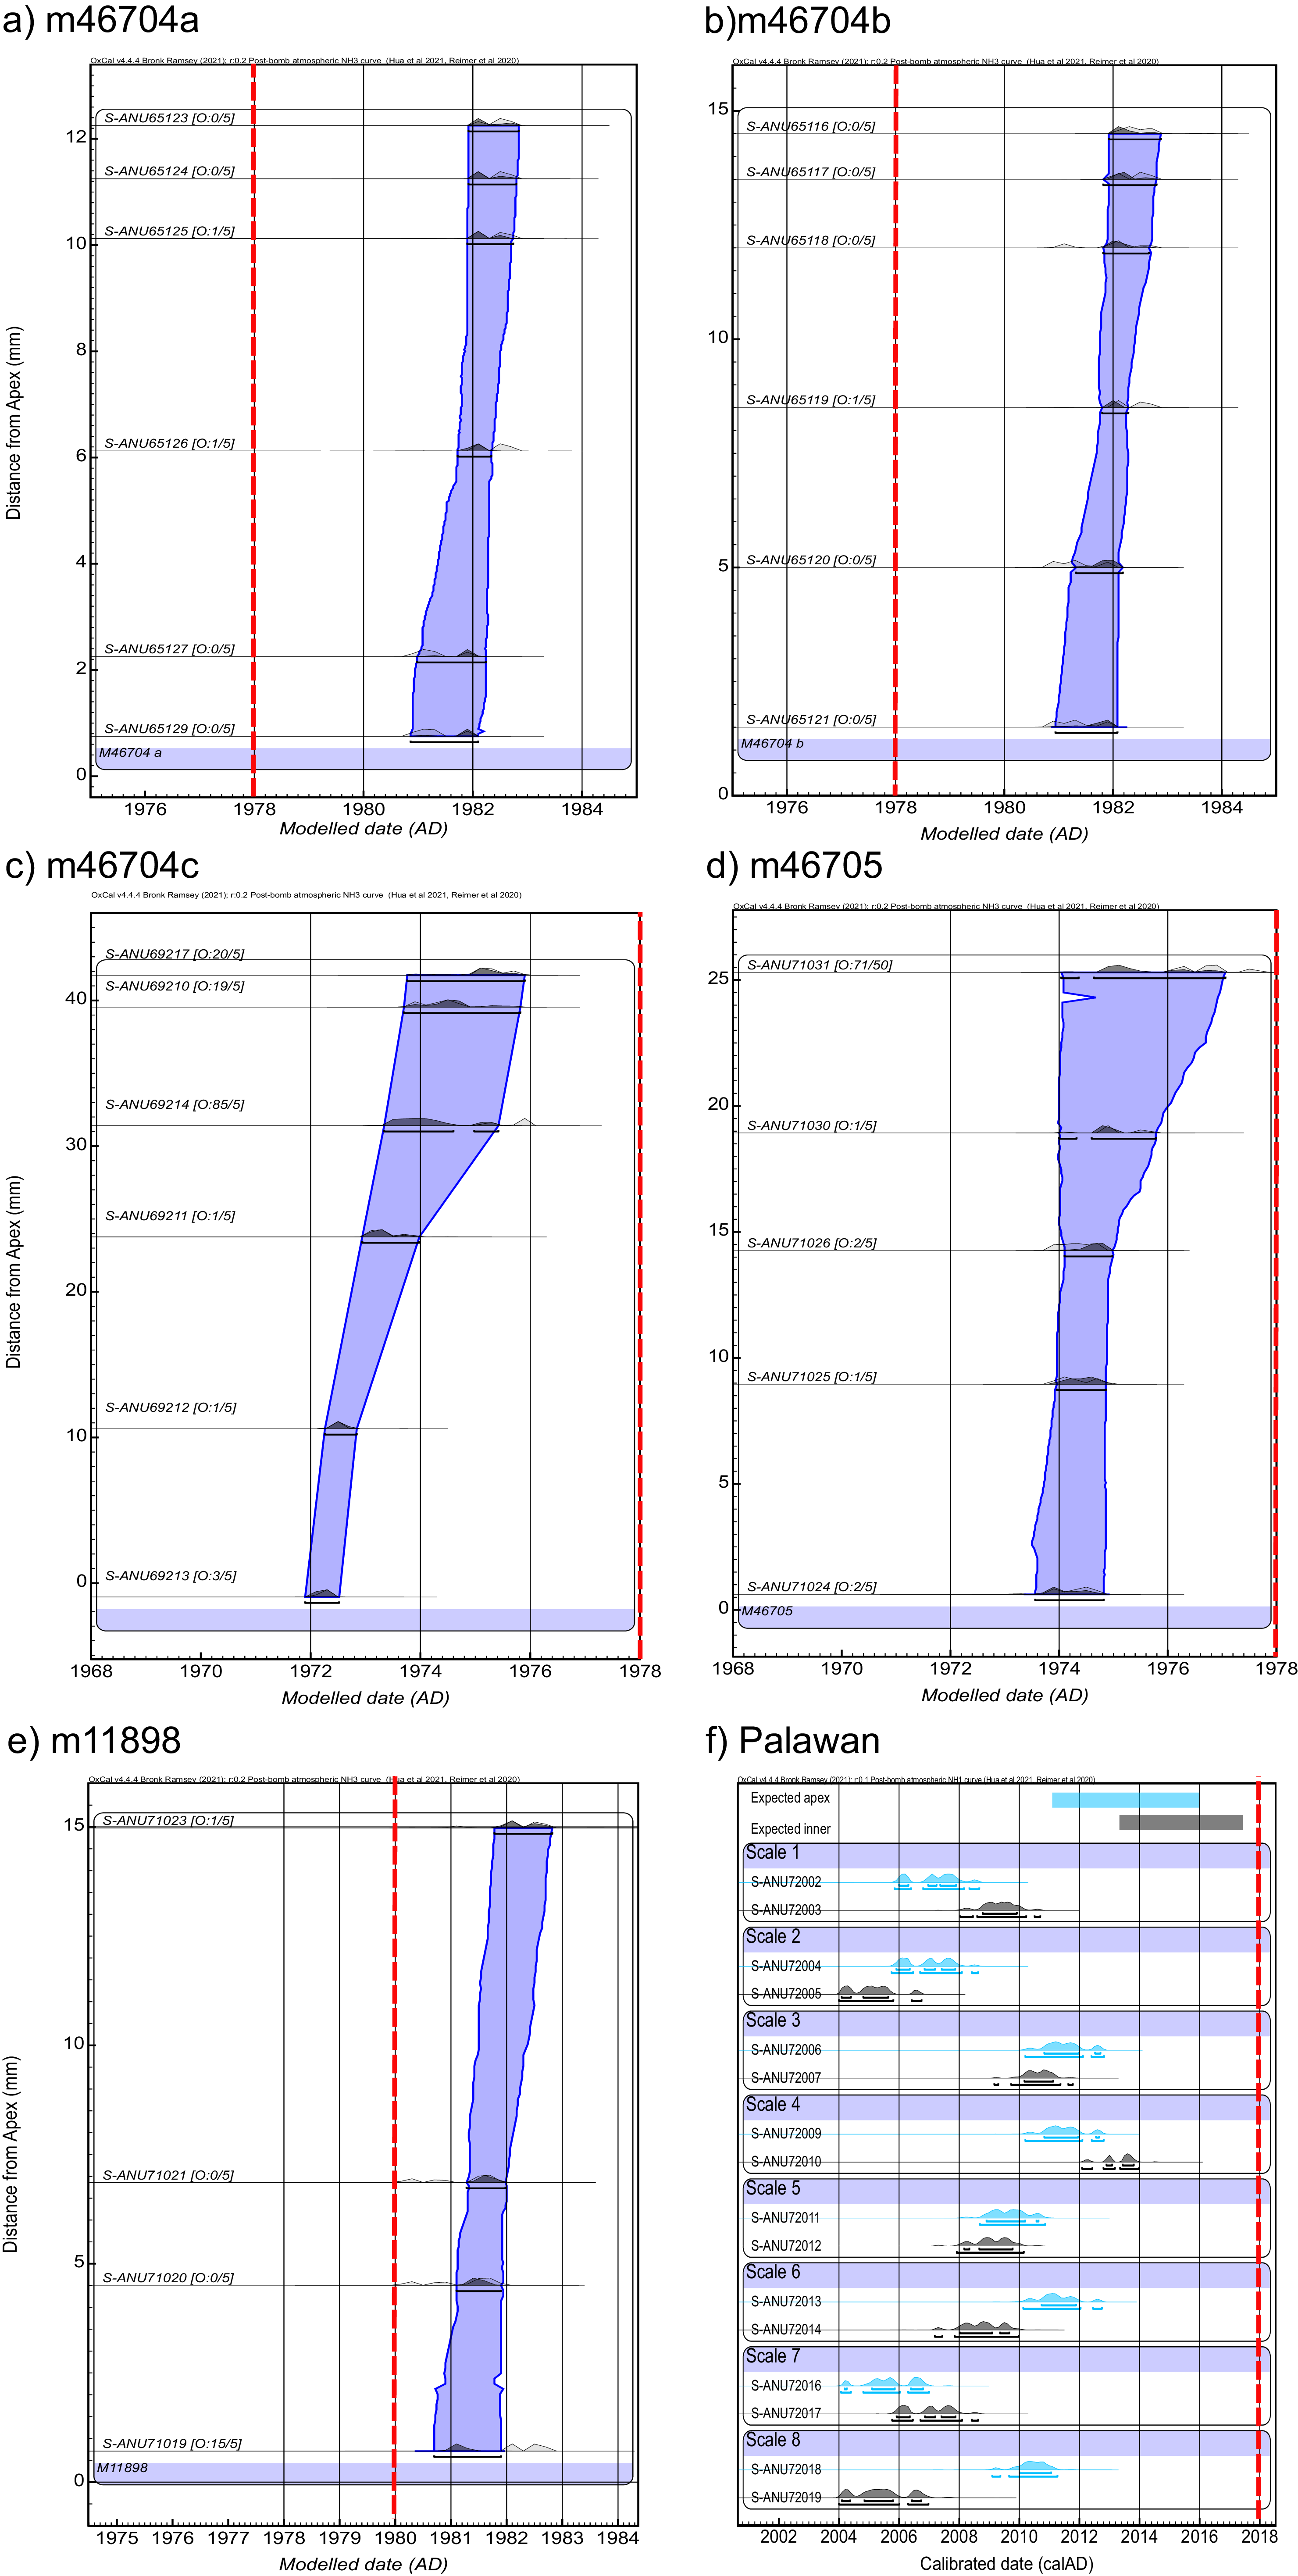
Radiocarbon dates on the pangolin scales appear robust; the nail standard produced accurate dates demonstrating that contamination was not added during sample preparation (Supp. Table 1), the C:N ratio of keratin appears reasonable at 3.5–3.7 (Supp. Tables 2–7), and in all cases, radiocarbon dates are either consistent or gradually increasing in age across a scale (Figure 4a–e). However, radiocarbon dating of the scales produced some unexpected results.
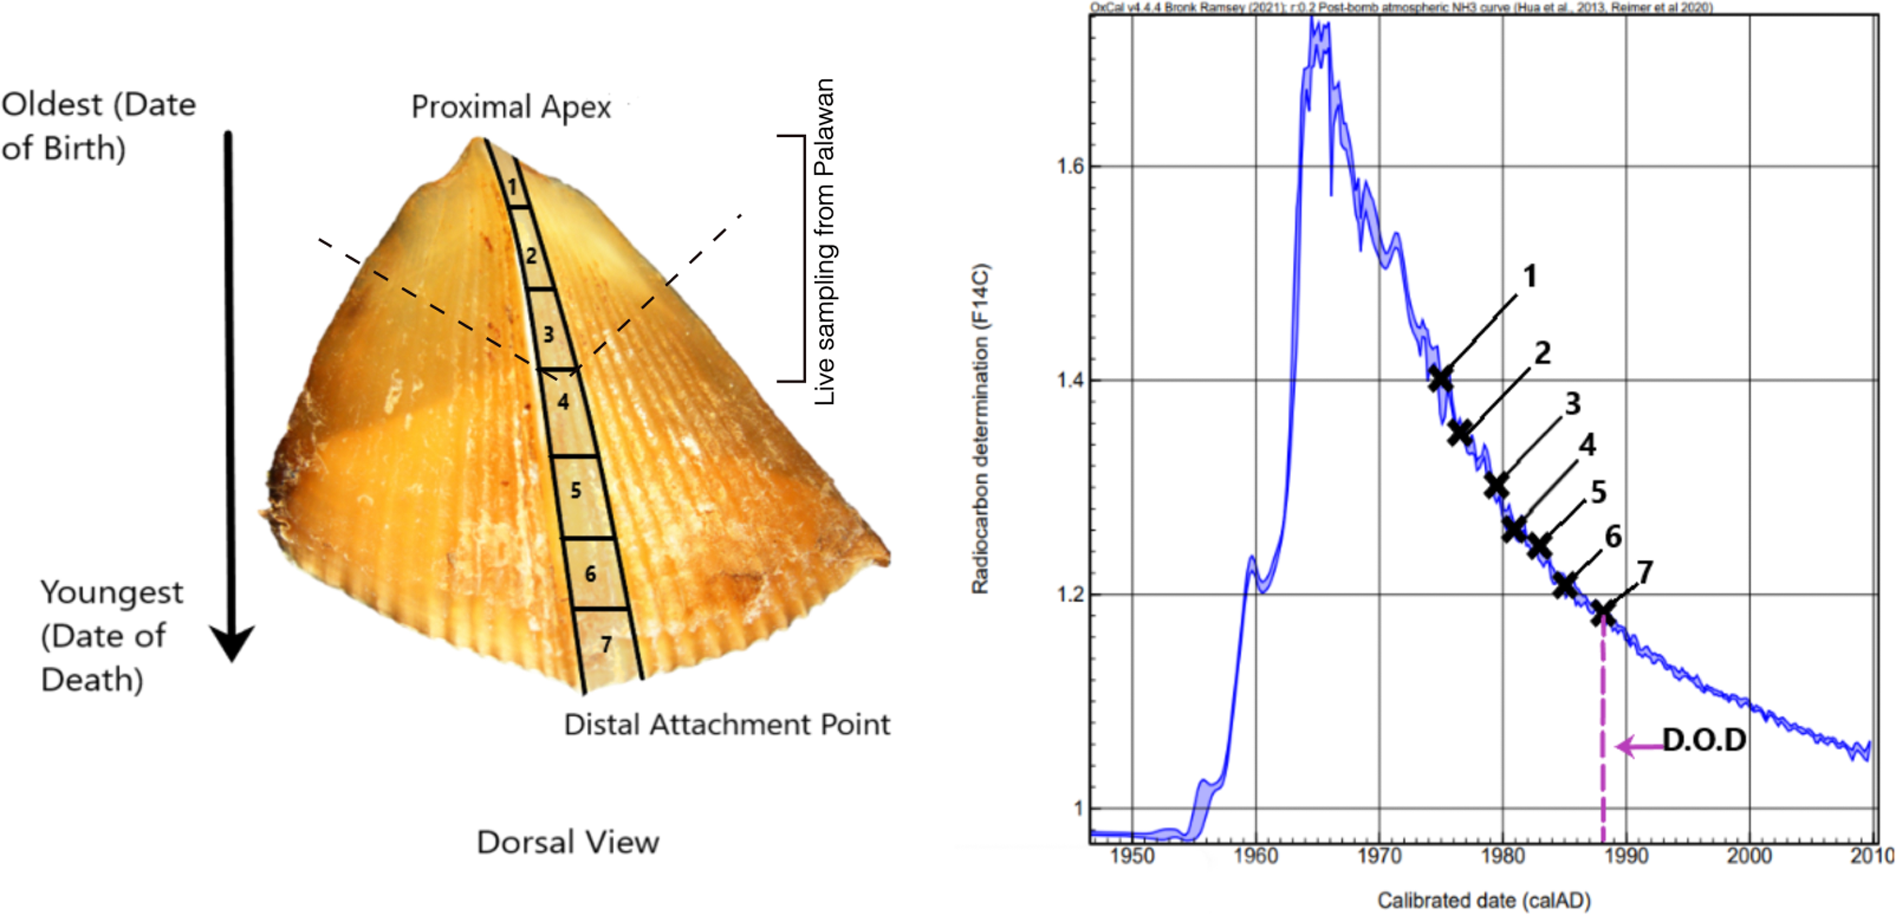
The five radiocarbon dates on the pre-bomb scale from pangolin M3731, are in agreement with each other (X 2 (4, N = 5) = 9.3, p < 0.05) (Figure 3). The calibration curve between 1650 and 1950 is quite flat, resulting in very broad probability distributions. Despite this, only three of the five measurements include the period shortly before 1926 (the accession date) within the 95% probability range. Two have a very low probability of being collected in the early 20th century, and this is reflected when the weighted average is calibrated. However, it is possible that this animal died long before being accessioned in the museum as the scales were taken from a pelt, and it is not clear what information can be concluded from these results.
Radiocarbon dating of pre-bomb scale M3731, showing that 2 of the 5 measurements are not in agreement with a collection date in the century before the pelt was acquired by the Australian Museum in 1926. The dark gray distribution represents the probability distribution of the calibrated date and the bracket beneath the 95% probability range. The R_Combine function was used to calibrate the weighted average of all radiocarbon ages from this sample. The date of accession to the museum is indicated by the red dotted line. This period of the calibration curve is rather flat, and so the probability ranges are extremely broad.

Radiocarbon dating of post-bomb scales. P_Sequence models of a) m46704a, b) m46704b, c) m46704c and d) m46705 and e) m11898 from the Australian Museum. The distal attachment point (youngest part of the scale) is shown at the top of the image. m46704 a–c were thought to be from the same animal, but it is possible that a and b are from m11898. f) Calibrated radiocarbon dates of the slices taken from the Philippine pangolin clips from Palawan. The slice taken closest to the apex is shown in blue and the slice closest to the attachment point is shown in grey. The probability distribution arising from the rising arm of the bomb spike is not shown. In each image the date of accession (a–d), or date of capture (e–f) is indicated in red. In a–e the probability distribution of the calibrated date is shown in pale grey, and the probability distribution of the modelled date is given in dark grey. The 95% range of the modelled date is represented by the bracket beneath each age estimate. The blue area represents the 95% range of the growth model.

Of the post-bomb scales from the Australian Museum, only M46704c and M46705 predate their accession date (Figure 4a–e). In each case, the delay between death as assessed from the modelled age of the attachment point and the date of accession seems reasonable at around 1–2 years. In contrast, M46704a and b (accessioned in 1978) and M11898 (died in 1980) appear to post-date their accession/ death date. Radiocarbon dating predicts that all three scales grew between 1981 and 1983.
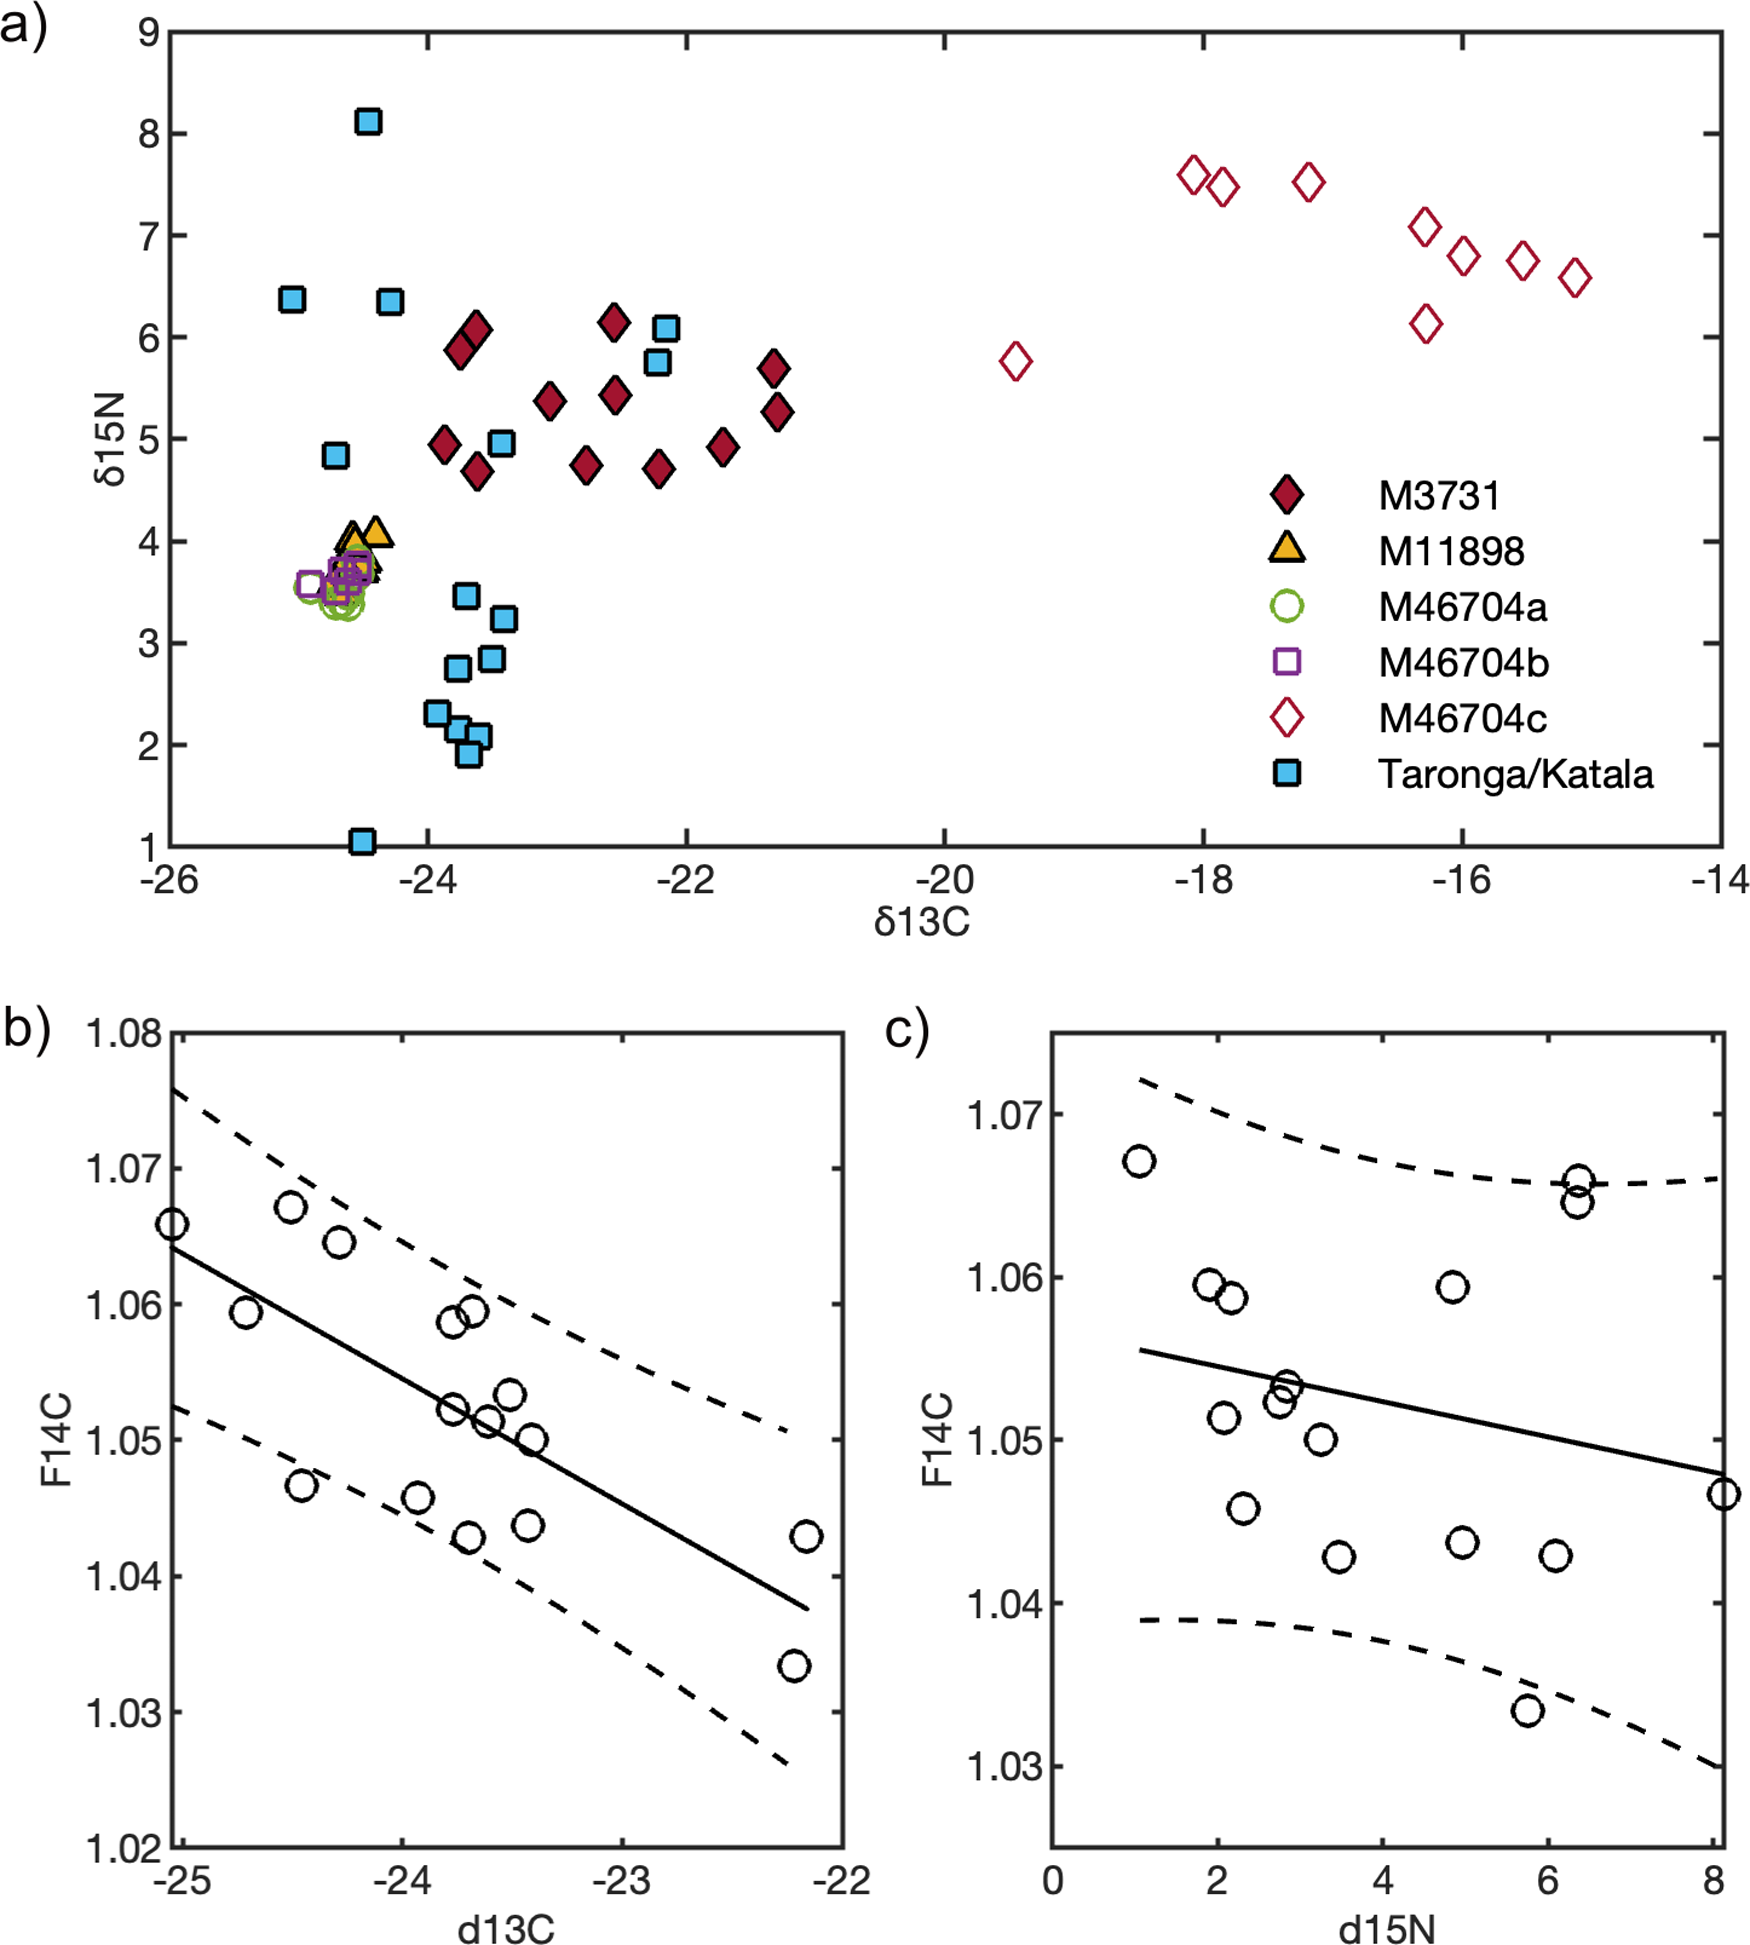
M46704, M46705 and M11898 from the Australian Museum had been stolen, and later recovered from a single vat of ethanol. When they were recovered, they were separated into individual containers of ethanol, and detached scales assigned to the most likely animal. To reduce damage to the animal, detached or loose scales were taken by the museum for us to use. It is therefore possible that M46704a and b were derived from M11898, explaining their consistent ages. All three scales also have remarkably similar δ13C and δ15N values, supporting this hypothesis (Figure 4a). If this was the case, all three scales provide a consistent age estimate, but one that post-dates capture by 1–2 years.
It is possible that this slight decrease in the F14C value may be caused by preservation in ethanol, which in the past was made from fossil fuel (or radiocarbon-depleted) sources. However, Strzepek et al. (Reference Strzepek, Thresher, Revill, Smith, Komugabe and Fallon2014) found that ethanol did not affect the age of the collagen found in deep sea corals, and so it seems unlikely that this may have affected the age. Likewise, the disagreement between the radiocarbon date and the recorded date of death is not likely to be an effect of calibration. Although the collection site in West Kalimantan is very close to the equator, the NH3 and SH3 atmospheric zones had very similar F14C between 1970 and 1980 (Hua et al. Reference Hua, Turnbull, Santos, Rakowski, Ancapichún, de Pol-Holz, Hammer, Lehman, Levin, Miller, Palmer and Turney2022).
Scales from pangolins that were captured on a known date and stored dry in the Philippines should not be affected by either of these problems. However, radiocarbon dates on this second group of scales were also variable and do not seem consistent with their known sampling date. These samples were collected and stored in a fridge and cannot be affected by preservation in a solvent. Palawan Island is also located towards the center of the NH3 zone, and so the calibration curve is expected to be suitable.
Dates from scale 4 are in the correct order and around four years older than date of capture. This seems reasonable if scales from the Philippine pangolin grow at similar rates to those from the Chinese and Sunda pangolin, since only around 1 cm was cut from the apex of the scale. In contrast, dates from e.g. scales 7 and 8 appear slightly too old, suggesting that the apex formed at least eight years before capture. Dates from scale 1 and 3 are reversed, with the apex apparently younger than the slice taken from closer to the attachment point. Whilst the apparently old ages could imply that these scales were taken from older animals than those sampled from the Australian Museum, or that scales in the Philippine pangolin grow at a slower rate, the reversed ages are more difficult to explain.
One potential reason that radiocarbon dates do not align with the expected age could be the variable inclusion of wood-eating termites in the diet of pangolins. Hyodo et al. (Reference Hyodo, Matsumoto, Takematsu and Itioka2015) found that the dietary age of termites could be more than 50 years old. If this were the case for the Australian Museum samples, who lived in the 1970s and 1980s, large amounts of pre-bomb carbon could have been consumed, causing the F14C values to decrease. The Philippine pangolins lived in the 2000s, so are more likely to have consumed carbon derived from wood growing during the bomb pulse, causing the F14C to appear elevated. This is consistent with the results that we have obtained.
Dietary isotopes
To investigate reasons for the discrepancies in radiocarbon dating further, we analyzed the dietary isotopes δ13C and δ15N (Figure 5a). Whilst most scales cluster between a δ13C of –26 and –21‰ typical of a C3 environment, M46704 c appears to have fed in a more open environment with access to a food chain based on some C4 plants, with M3731 falling between these two extremes. Whilst animals feeding in C3 environments have very consistent δ13C values across the scale, values from the two scales with higher values vary by more than 2‰, and a cyclical pattern can be seen when plotted as distance from apex (Supp. Figure 4a–d). With limited information about scales from the Australian Museum, this pattern is difficult to interpret but suggests diet varied over time and potentially seasonally. This is supported by observations that the diet of the Chinese pangolin varies by season in both the amount eaten and prey composition with, for example, ants being the major prey in summer and termites in winter (Sun et al. 2025).
Dietary stable isotope analyses. a) carbon and nitrogen isotope analyses by scale, and the relationship between F14C and b) δ13C, c) δ15N in the Philippine pangolins captured in late 2018. Uncertainty terms are within the point size.

δ15N is similarly varied between animals, and again, M46704c and M3731 appear to show a cyclical variation (Supp. Figure 3a–d). Most stark however, is the variation of around 7‰ within animals feeding within the relatively small area sampled on Palawan suggesting that individual pangolins select to feed on different species and/or in different sub-environments.
All scales from Palawan were collected in 2018. If we assume that the scales grew at a similar rate and the amount of time elapsed between the apex and date of capture was similar, we can assess the relationship between δ13C and δ15N and F14C to assess whether radiocarbon analyses could be affected by termites eating old wood. Although F14C is not correlated with δ15N (r = 0.23, p > 0.05, tcrit = 2.14), it is correlated with δ13C (r = 0.75, p < 0.05, tcrit = 2.14) (Figure 5 b,c). Scale slices depleted in 13C are also more enriched in 14C implying that radiocarbon may be affected by diet. More negative δ13C measurements are often found in more forested environments (van der Merwe and Medina Reference van der Merwe and Medina1991). Therefore, it is plausible that pangolins eating more termites that feed on the remains of trees deep within the forest have both a lower δ13C and a higher F14C value derived from wood growing during the peak of the bomb curve, than pangolins eating ants feeding on material from more open environments. δ15N largely reflects trophic position and is less closely correlated with the reason for F14C variation, although there is a very large spread in values within this population.
Unfortunately, no stable isotope data on termites and ants is available for comparison from Palawan. In the Lambir Hills National Park, Sarawak,Malaysia, Hyodo et al. (Reference Hyodo, Takematsu, Matsumoto, Inui and Itioka2011) found that δ13C of woody detritus is more enriched in 13C than understory leaves. However, the isotopic range of ants and termites overlaps, with complex physiological processes and humification of feeding substrates causing invertebrates with different diets to have similar isotopic signatures.
Few studies have focused on prey species, although the Philippine pangolin is known to forage both terrestrially and arboreally (Schoppe et al. 2020). Both ant and termite species have been recorded as prey (Acosta-Lagrada Reference Acosta-Lagrada2012), although Schoppe and Alvarado (2015) observe the species frequently predating on the weaver ant (Oecophylla smaragdina). Together, the radiocarbon and stable isotope data may hint at considerable differences in prey choice between individuals or reflect a seasonal difference which could not be resolved with the section of scale sampled.
It is also interesting to note that M46704 which appears to have eaten some food from a food chain based on C4 plants, and therefore mostly grasses with minimal inbuilt age, provided a reasonable radiocarbon age estimate unaffected by old-wood.
Oxygen isotopes
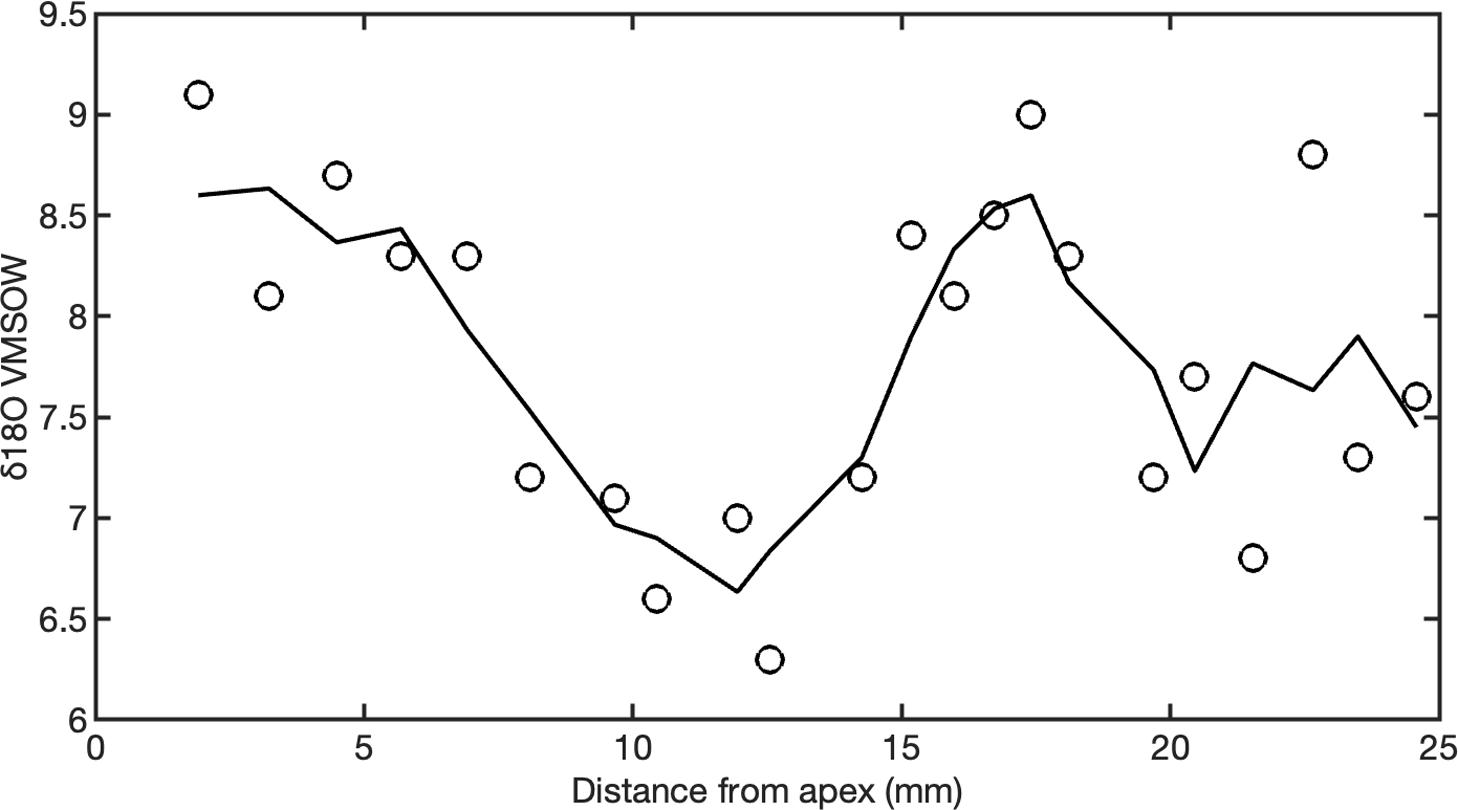
With these uncertainties it is clear that radiocarbon cannot be used alone to assess the growth or age of a pangolin scale. Oxygen isotopes may provide a possible alternative method to assess growth rate, as a seasonal fluctuation in the δ18O of precipitation is expected throughout the range of the Chinese pangolin in SE and SW China (Chen et al. Reference Chen, Huang, Lao, Zhang, Chen, Zhou, Lu and Zhu2021, Reference Chen, Chen, Zhang, Peng and Risi2023). 22 slices were sampled from M46705 and show a clear fluctuation between 6.3 ‰ and 9.1 ‰, with at least two peaks and two troughs, suggesting the scale took between 1.5 and 2 years to grow (Figure 6). This scale produced a reasonable radiocarbon estimate for the animals’ date of death, a year earlier than its accession date, suggesting that it is not grossly affected by carbon from old wood. Therefore, it is reassuring to see that the timescale represented by the oxygen isotope analysis is similar to the radiocarbon estimate of between 0 and 3.7 years (95% probability), modelled using the OxCal Interval function.
δ18O analysis from M46705 (Chinese pangolin), 3 point moving average.

Conclusion
There is a growing need to study the illegal trade, demography and ecology of the eight pangolin species to aid projects attempting to limit the trade, understand its impact on the remaining population of pangolins, and aid conservation efforts. Isotopic analysis has the potential to contribute through analyses of living animals as well as on the vast numbers of scales seized. Microscopic inspection of pangolin scales shows clear evidence of wear, suggesting that scale from early life is likely to have worn away in all but the youngest pangolins. Radiocarbon dating of scales is unlikely to be able to accurately ascertain date of birth. Although the data presented here are preliminary, radiocarbon appears to be affected by the choice of some animals to eat wood-consuming termites and may thus best be used as a dietary isotope. However, it may still be possible to radiocarbon date scales from animals that do not live in forested environments and consume primarily ants, although this remains to be tested (e.g. the Temminck’s ground pangolin, Smutsia temminckii). Oxygen isotopes provide a complementary technique to assess how quickly scales grow and could be used alongside other elemental and isotopic analysis to provide a time frame for changes in diet or mobility. Growth rate varied between scales however there was no evidence to suggest any had ceased growing. In one scale where oxygen isotope analysis was undertaken, growth rate was rapid with the scale representing at most 2 years of growth. Whilst scales appear to grow constantly and are worn away through life, we were not able to determine whether scales can be lost and regrow.
Supplementary material
To view supplementary material for this article, please visit https://doi.org/10.1017/RDC.2026.10239
Acknowledgments
The Katala Foundation is thanked for their work in the collection of the samples from Palawan. The Taronga Foundation and Taronga Conservation Society are thanked for support in the collection of, and loan of these samples respectively. The Australian Museum and Sandy Ingleby are thanked for permission to sample pangolin scales from the museum collections and provision of associated data and advice. Staff of the Australian National University Radiocarbon Facility are thanked for help with analysis, particularly Rebecca Esmay and Eric Usher. The West Australian Biochemistry Centre are thanked for analysis of δ18O, and Ian Williams at the Australian National University is thanked for help with an initial attempt to analyze δ18O with the Sensitive High Resolution Ion Microprobe (SHRIMP). Funding was provided by the Research School of Earth Sciences at the Australian National University. Rachel Wood is supported by the NERC and AHRC funded National Environmental Isotope Facility (NE/Y005449/1). All authors contributed to the study conception and design. Sabine Schoppe designed sample collection from the Philippines. Data collection and analysis were performed by Erin Barr, Stewart Fallon and Rachel Wood. The first draft of the manuscript was written by Erin Barr and Rachel Wood, and all authors commented on previous versions of the manuscript. All authors read and approved the final manuscript.


 Open access

