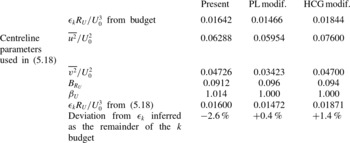
1. Introduction
Turbulent flows involving scalar mixing are encountered in many industrial applications and natural situations such as combustion chambers, pollutant dispersion etc. The usual scalar quantities of interest are heat, chemical species or particles convected in a given flow field. When low concentrations of species or small temperature gradients (small enough to neglect buoyancy effects) are involved, the scalar is considered passive. If theoretical and numerical modelling of complex flows is to be realized, reliable data for simpler classical flows are needed as benchmarks. In that sense, experimental study of the self-preserving region of a slightly heated round free jet can offer unique insight into the finest of turbulent motions, together with an opportunity for quantitative assessment of passive scalar mixing.
Modelling the velocity and temperature fields and understanding the interactions between these fields require study of the transport equations of the turbulent kinetic energy,
 $k\equiv (\overline{u^{2}}+\overline{v^{2}}+\overline{w^{2}})/2$
(where
 $u$
,
 $v$
and
 $w$
are the fluctuating streamwise, radial and azimuthal velocity components, respectively), and the halved temperature variance,
 $\overline{{\it\theta}^{2}}/2$
. Among the key terms needed to balance these equations, the sink or destruction terms are of prime interest:
 ${\it\epsilon}_{k}$
and
 ${\it\epsilon}_{{\it\theta}}$
represent, respectively, the mean rate of dissipation of
 $k$
and
 $\overline{{\it\theta}^{2}}/2$
per unit mass. Direct measurement of
 ${\it\epsilon}_{k}$
or
 ${\it\epsilon}_{{\it\theta}}$
has proven to be very challenging, because these terms are determined by the variance of velocity and temperature derivatives, which are mostly produced by the smallest scales of the flow field.
Turbulence in jet flows has been investigated for the better part of the twentieth century. During this period, an impressive amount of work has been devoted to studying this flow field’s most critical quantities. In the first wave of investigations, which includes the work of Heskestad (Reference Heskestad1965) (plane jet) and Wygnanski & Fiedler (Reference Wygnanski and Fiedler1969), the velocity field was studied using a stationary crossed hot-wire (SHW) probe. After doubts were raised about control of the boundary conditions, adequate use of the governing equations (George Reference George1990) and the limitation of SHW measurements in highly turbulent flows, more sophisticated methods were put forward, namely laser doppler velocimetry (LDV) by Hussein, Capp & George (Reference Hussein, Capp and George1994) (hereafter referred to as HCG) and use of the flying hot-wire (FHW) by Panchapakesan & Lumley (Reference Panchapakesan and Lumley1993a ) (hereafter referred to as PL) and HCG. Nearly 20 years later, it is the authors’ opinion that there is still room for improvement on this body of work. In addition to recent advancements in data storage and computing capabilities and in the reliability of LDV systems, the next few paragraphs will discuss the reasons motivating our present study devoted to the classical flow of the slightly heated round jet.
For both HCG and PL, the problem posed by the high turbulence intensity and the use of SHW probes was settled by the new means of measurement employed. Specifically, HCG demonstrated that SHW and LDV measurements in the same flow would yield considerably different results, thus highlighting the importance of the bias induced by high turbulence levels on the SHW results. Despite the use of measurement devices thought to be unaffected by high turbulence levels, important differences were found between the results of HCG and of PL. Some of these could be attributed to the difference in Reynolds numbers of nearly one order of magnitude between the two jets (
 $\mathit{Re}_{D}=9.5\times 10^{4}$
for HCG and
 $\mathit{Re}_{D}=1.1\times 10^{4}$
for PL). For the most part, though, the discrepancies reported remain unexplained. Also, regarding HCG, the results reported are affected by a noticeable level of scattering, especially where third-order moments of fluctuating velocity are concerned (e.g.
 $\overline{u^{3}}$
,
 $\overline{uv^{2}}$
and
 $\overline{uw^{2}}$
). This situation may be attributed to statistical convergence or flow stability issues. It might also be related to the random error affecting the determination of the residence time by the LDV processor.
HCG and PL established the budget of the transport equation for the turbulent kinetic energy
 $k$
and the Reynolds stresses
 $\overline{u_{i}u_{j}}$
. HCG used dissipation data provided by Hussein & George (Reference Hussein and George1989) and George & Hussein (Reference George and Hussein1991), and inferred the pressure diffusion term (
 ${\it\Pi}_{k}$
) as the closing balance. PL assumed the dissipation to be the remainder of the budget and neglected the pressure diffusion term. Also, due to the jet geometry and the characteristics of the measurement devices used, most attempts at establishing the turbulent kinetic energy transport budget are made without measuring the third-order correlation
 $\overline{vw^{2}}$
, which plays a crucial role in the turbulent diffusion. Both HCG and PL assumed
 $\overline{vw^{2}}=\overline{v^{3}}$
for the purpose of estimating the turbulent diffusion. This substitution not only affects the value of the turbulent diffusion term calculated but also has an influence on the value of the term inferred by balancing the budget (
 ${\it\Pi}_{k}$
for HCG and
 ${\it\epsilon}_{k}$
for PL). In the case of PL, the use of the surrogate also influences the value of the dissipation found for the
 $\overline{u_{i}u_{i}}$
component budgets, since small-scale isotropy was assumed (
 ${\it\epsilon}_{ij}=(2/3){\it\epsilon}_{k}{\it\delta}_{ij}$
).
Additionally, for the production term of the
 $\overline{v^{2}}$
budget (
 $P_{vv}$
) reported by PL, what is in all likelihood an unfortunate miscalculation led to
 $P_{vv}\approx 0$
on the entire jet (also noticed by Lipari & Stansby Reference Lipari and Stansby2011). The value of the third-order moments constituting this term would in fact suggest otherwise. This obviously affects the value of the production term appearing in the turbulent kinetic energy budget (
 $P_{k}$
), but it also has an impact on the value of the dissipation rate
 ${\it\epsilon}_{k}$
inferred, which in turn is used in the budgets of the
 $\overline{u_{i}u_{i}}$
components, as mentioned above.
More recently, the large eddy simulation (LES) of Bogey & Bailly (Reference Bogey and Bailly2009) conducted with parameters close to those of PL (except for the jet-exit Mach number
 $\mathit{Ma}=0.9$
) produced very similar results. Bogey & Bailly (Reference Bogey and Bailly2009) found that the pressure diffusion term
 ${\it\Pi}_{k}$
could be neglected away from the jet centreline, but was of some importance close to the centreline. However, for a much lower Reynolds number (
 $\mathit{Re}_{D}=2000$
), Taub et al. (Reference Taub, Lee, Balachandar and Sherif2013) presented a direct numerical simulation (DNS) study, showing that the pressure diffusion term was negligible on the jet centreline and reached a maximum value at a radial distance of
 ${\it\xi}=r/R_{u}=0.3$
. Further away from the jet centreline, the LES and DNS just mentioned produced pressure diffusion terms of the same magnitude. These two simulations also showed that the radial component of the pressure–velocity correlation compares relatively well with Lumley’s model (Lumley Reference Lumley1978). Consequently, neglecting the pressure diffusion term appears to be a somewhat questionable assumption that once again influences the value of
 ${\it\epsilon}_{k}$
inferred as the closing balance of the budget.
Direct evaluation of pressure diffusion involves measurement of pressure–velocity correlations. For example, Terashima, Sakai & Nagata (Reference Terashima, Sakai and Nagata2012) performed simultaneous measurements of pressure and velocity fluctuations in a plane jet. They used a miniature pressure sensor placed between the prongs of a SHW probe to evaluate pressure diffusion. To the authors’ knowledge, this type of combined sensor has not been used in a round free jet. However, due to well-known limitations of SHW probes in this type of flow, it still seems preferable to make use of Lumley’s model to evaluate the pressure diffusion term.
In parallel with the velocity field, extensive studies have also been made of passive contaminants. The concern expressed by Combest, Ramachandran & Dudukovic (Reference Combest, Ramachandran and Dudukovic2011) regarding the lack of availability of reliable values of the turbulent Prandtl number (
 $\mathit{Pr}_{T}$
), later addressed in Darisse, Lemay & Benaïssa (Reference Darisse, Lemay and Benaïssa2013a
), is but one implication. In spite of that, reliable measurements of the passive scalar field of round jets evolving in still air (without a co-flow) are few and far between (Gouldin et al.
Reference Gouldin, Schefer, Johnson and Kollmann1986). One reason for this is the difficulty in performing measurements of temperature fluxes using a combined stationary hot-wire–cold-wire (SHW–CW) probe. High turbulence levels leading to flow reversal and inevitable thermal contamination of the cold-wire probe make these kinds of measurements for the outer part of the jet especially challenging (see Antonia, Chambers & Hussain Reference Antonia, Chambers and Hussain1980; Antonia & Browne Reference Antonia and Browne1983).
It is therefore worth mentioning the pioneering work of Corrsin & Uberoi (Reference Corrsin and Uberoi1950) and Chevray & Tutu (Reference Chevray and Tutu1972). Later, Chua & Antonia (Reference Chua and Antonia1990) used a SHW probe with a wider acceptance cone angle to measure the temperature fluxes (the probe characteristics are discussed in more detail in Browne, Antonia & Chua Reference Browne, Antonia and Chua1989). This work subsequently led to the establishment of a transport budget for
 $\overline{{\it\theta}^{2}}/2$
in Antonia & Mi (Reference Antonia and Mi1993) (hereafter referred to as AM);
 $\overline{{\it\theta}^{2}}/2$
transport budgets have also been established in a round jet with a strong co-flow by Antonia, Prabhu & Stephenson (Reference Antonia, Prabhu and Stephenson1975) and in a plane jet by Antonia et al. (Reference Antonia, Browne, Chambers and Rajagopalan1983).
In addition to the limitations affecting the measuring instruments used, the data reported by Chevray & Tutu (Reference Chevray and Tutu1972) were acquired at the downstream location of
 $x/D=15$
(where
 $D$
is the diameter of the jet nozzle). The low level of signal available in the measurement of temperature fluctuations farther downstream explains this choice of location. However, at
 $x/D=15$
, the flow is most likely still influenced by the initial conditions and is unlikely to have reached full self-preservation.
In establishing the transport budget of
 $\overline{{\it\theta}^{2}}/2$
, AM carried out direct measurements of the temperature dissipation rate using a pair of cold-wire probes. The temperature dissipation rate was also measured by Darisse, Lemay & Benaïssa (Reference Darisse, Lemay and Benaïssa2014), and they produced a detailed analysis of the different
 ${\it\epsilon}_{{\it\theta}}$
estimates on the jet centreline. This analysis allowed them to conclude that the value inferred from the closing balance of the budget was a reliable estimate of the temperature dissipation rate. Given the technical means of measurement currently available in most laboratory environments, the establishment of every single term of the transport budget of
 $\overline{{\it\theta}^{2}}/2$
can be achieved. Also, since the bulk of the value of these terms resides in the larger structures of the flow (as opposed to the dissipation), satisfactory levels of accuracy can be attained.
The turbulent diffusion term
 $D_{{\it\theta}}$
of the budget reported by AM was inferred as the closing balance, although unfortunately (as will be demonstrated in § 5.4) it does not meet the requirement that the radial part of
 $D_{{\it\theta}}$
has to integrate to zero across the jet. Moreover, in establishing the transport budget of
 $\overline{{\it\theta}^{2}}/2$
, AM neglected the streamwise gradients of the production term,
 $P_{{\it\theta}}$
. Darisse et al. (Reference Darisse, Lemay and Benaïssa2014) found this quantity to be non-negligible, especially near the jet centreline.
In the present paper, all of the aforementioned concerns are addressed. Firstly, all the velocity measurements are performed using a proven LDV technique. The emphasis is on flow stability and statistical convergence (see Darisse, Lemay & Benaïssa Reference Darisse, Lemay and Benaïssa2013b
). Secondly, no surrogate for the third-order moment
 $\overline{vw^{2}}$
is used, which provides an unbiased estimate of the turbulent diffusion terms. The pressure diffusion
 ${\it\Pi}_{k}$
is obtained using Lumley’s model. The dissipation rate
 ${\it\epsilon}_{k}$
is then inferred by balancing the
 $k$
budget. Also, all the measurements reported here are performed at the downstream location of
 $x/D=30$
, where self-preservation is observed. Likewise, for the passive scalar transport budget, both radial and streamwise components of the production term (
 $P_{{\it\theta}}$
) are measured, and similarly for the turbulent diffusion term,
 $D_{{\it\theta}}$
. Consequently, the temperature dissipation rate (
 ${\it\epsilon}_{{\it\theta}}$
) is also taken as the closing balance of the
 $\overline{{\it\theta}^{2}}/2$
budget.
Numerous studies have been devoted to the direct measurement of turbulent kinetic energy or the temperature dissipation rate. However, several of these have been carried out using an open-loop approach, i.e. without having access to well-established reference values for the purpose of validation. The present work intends to put forward such reference values for
 ${\it\epsilon}_{k}$
and
 ${\it\epsilon}_{{\it\theta}}$
, established in the exact same slightly heated jet flow.
Another main objective of the present paper is to construct a detailed database that includes well-converged profiles of second- and third-order moments of fluctuating velocity, temperature and temperature–velocity mixed moments. Along with the budgets of
 $k$
and
 $\overline{{\it\theta}^{2}}/2$
, these measurements allow us to establish the budgets of other important physical quantities, such as Reynolds stresses
 $\overline{u_{i}u_{j}}$
and turbulent heat fluxes
 $\overline{u_{i}{\it\theta}}$
.
2. Experimental set-up and measurement techniques
2.1. Jet facility and flow conditions
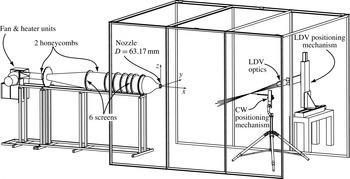
The measurements presented here are performed on a slightly heated round jet evolving horizontally in a dedicated portion of the laboratory. The jet assembly and the measuring equipment are illustrated in figure 1. The air is supplied by a paddle blower into a settling chamber (
 $2.54~\text{m}~\text{long}\times 317.5~\text{mm}$
in diameter) of circular cross-section, containing two honeycombs and six screens of decreasing mesh sizes. The vibration of the motor is prevented from affecting the settling chamber, as the two sections are mounted on separate frames. A single contraction of ratio 25 : 1 modelled after a fifth-degree polynomial led to the jet exit, which has a diameter of
 $D=63.2~\text{mm}$
. In operation mode, the exit velocity is
 $U_{j}=36.3~\text{m}~\text{s}^{-1}$
.
Schematic diagram of the jet facility and measurement apparatus.

Single hot-wire velocity measurements on the exit plane (Darisse et al.
Reference Darisse, Lemay and Benaïssa2013b
) have revealed very thin laminar boundary layers at the lips of the nozzle, low turbulence levels (including inside the boundary layer) and a top-hat velocity profile. These experimental conditions yield
 $\mathit{Re}_{D}=1.4\times 10^{5}$
(where
 $\mathit{Re}_{D}\equiv U_{j}D/{\it\nu}$
). The streamwise evolution of the centreline mean velocity and jet half-radius (
 $U_{0}$
and
 $R_{U}$
, respectively) are also presented in Darisse et al. (Reference Darisse, Lemay and Benaïssa2013b
).
The jet evolves in a part of the laboratory delimited by side walls and a ceiling. The measurement environment created is open-ended, with a square cross-section of size
 $42D$
. Such dimensions are very large compared to the radial length scales of the jet, so they provide boundary conditions close to those for a free jet (see Darisse et al.
Reference Darisse, Lemay and Benaïssa2013b
, figure 7, for the circularity of mean velocity isocontours at
 $x/D=26$
). Screens of mesh size approximately
 $2~\text{mm}$
are placed at both ends of the room. Also, the jet is slightly heated to a temperature of
 ${\it\Theta}_{j}=20\,^{\circ }\text{C}$
relative to the ambient temperature using a heater unit located just upstream of the fan. Both the ambient and the jet air temperatures are monitored using thermistor probes.
All the measurements reported here are taken at the downstream location of
 $x/D=30$
. At this position, the streamwise evolution of all parameters of interest has reached self-preservation, as will be discussed in § 3. At
 $x/D=30$
, the centreline mean streamwise velocity is
 $U_{0}=7.78~\text{m}~\text{s}^{-1}$
, and the temperature excess above the ambient is
 ${\it\Theta}_{0}=3.38\,^{\circ }\text{C}$
. This yields a Richardson number of value
 $\mathit{Ri}=3\times 10^{-4}$
(
 $\mathit{Ri}\equiv \mathit{Gr}/\mathit{Re}_{0}^{2}$
, where
 $Gr\equiv gR_{U}^{3}{\it\Theta}_{0}/({\it\nu}^{2}T_{a})$
is the Grashof number and
 $\mathit{Re}_{0}\equiv U_{0}R_{U}/{\it\nu}$
the local Reynolds number) and a density ratio of the jet to ambient air of
 ${\it\rho}_{j}/{\it\rho}_{amb}\approx 0.99$
. The temperature can thus be treated as a passive scalar. Moreover, at
 $x/D=30$
on the jet centreline, the jet half-radius is
 $R_{U}=167~\text{mm}$
, the Kolmogorov microscale on the centreline is
 ${\it\eta}=0.096~\text{mm}$
, and the Kolmogorov frequency
 $f_{K}\equiv \overline{U}/(2{\rm\pi}{\it\eta})$
is about 13 kHz. Also at
 $x/D=30$
on the jet centreline,
 $\mathit{Re}_{{\it\lambda}}=548$
(
 $\mathit{Re}_{{\it\lambda}}\equiv \sqrt{\overline{u^{2}}}{\it\lambda}/{\it\nu}$
, where
 ${\it\lambda}\equiv \sqrt{15{\it\nu}\overline{u^{2}}/{\it\epsilon}_{k}}$
) and
 $\mathit{Pe}_{{\it\lambda}}=211$
(
 $\mathit{Pe}_{{\it\lambda}}\equiv \sqrt{\overline{u^{2}}}\hspace{2.22198pt}{\it\lambda}_{{\it\theta}}/{\it\alpha}$
, where
 ${\it\lambda}_{{\it\theta}}\equiv \sqrt{3{\it\alpha}\hspace{2.22198pt}\overline{{\it\theta}^{2}}/{\it\epsilon}_{{\it\theta}}}$
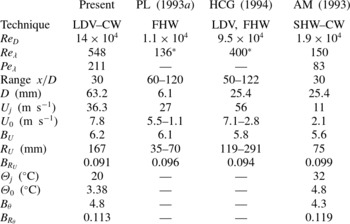
). The main flow characteristics of the present jet, as well as those taken from the main databases used for comparison in this article, are given in table 1.
Mean flow and scalar parameters used in different experimental studies (for PL and HCG, the asterisk indicates an estimate using
 $\mathit{Re}_{{\it\lambda}}=1.3\sqrt{\mathit{Re }_{D}}$
, see Ruffin et al.
Reference Ruffin, Schiestel, Anselmet, Amielh and Fulachier1994).

Since the jet studied evolved horizontally, one needs to take special care to ensure that the boundary conditions are symmetric, especially with regard to the external temperature field. A failure to take into account the natural thermal stratification would make it impossible to describe a free round jet accurately. Details of the means employed to guarantee that the properties measured by spanning the jet horizontally and vertically are identical and the consequences of not acting on the issue are described at length in Darisse et al. (Reference Darisse, Lemay and Benaïssa2013a ).
2.2. LDV measurements
A two-colour (blue 488 nm, green 514 nm) Stabilite 2017-AR argon laser together with Dantec back-scattering optics and a Dantec BSA-F60 processor are used to carry out velocity measurements in the jet. The Dantec optics also include a beam expander with a focal length of 1000 mm, which allows the LDV apparatus to remain outside the jet flow. Each set of laser beams produces a 22 fringe measurement cell of dimensions
 $0.14~\text{mm}\times 0.14~\text{mm}\times 3.70~\text{mm}$
for the blue light and
 $0.15~\text{mm}\times 0.15~\text{mm}\times 3.90~\text{mm}$
for the green light. For most measurements, the longer side of the cell was oriented in a direction of non-existent or minimal mean gradient. Measurements with the cell oriented along the radial direction and along the streamwise direction produced virtually identical results; consequently, the impact of cell size was deemed negligible.
Safex 2010 and Antari Z-1200 fog generators are used along with Rosco glycol-based fog fluids as seeding particles. The nominal diameter of the particles generated is of the order of
 $1~{\rm\mu}\text{m}$
. This value is considered small enough to follow the velocity field down to the finest scales of interest. For measurements at
 $x/D=30$
, the time constant for the particles was found to be less than
 $10~{\rm\mu}\text{s}$
, which is lower than the inverse of the Kolmogorov frequency for this location,
 $1/f_{K}\approx 77~{\rm\mu}\text{s}$
. Very attentive care is taken to provide a seeding of sufficient density and uniformity, even in the outer regions of the jet. This is achieved by filling the laboratory with fog particles well ahead of time, intended to constitute a seeding buffer. The generators kept producing particles during the measurements to prevent any decay in the seeding density.
Several authors have considered using the residence time of the particle in the measurement cell as a weighting function for the data (see e.g. Buchhave, George & Lumley Reference Buchhave, George and Lumley1979; Hussein et al.
Reference Hussein, Capp and George1994), but reducing the data in this manner still failed to resolve the value of
 $\overline{V}$
. This situation is problematic, especially in the case of a flow that offers such limited consistency checks, such as the continuity equation. McLaughlin & Tiederman (Reference McLaughlin and Tiederman1973) considered a weighting based on the value of the instantaneous velocity, but since the measurement system only gives access to two components at a time, so this method is not implemented either. Given our confidence in the density and uniformity of the present seeding, the saturable detector technique is adopted (see Stevenson & Thompson Reference Stevenson and Thompson1982; Edwards et al.
Reference Edwards, Dybbs, Adrian, Boutier, Eaton, George and Meyers1987; Herrin & Dutton Reference Herrin and Dutton1993). A
 $400~{\rm\mu}\text{s}$
dead time between any pair of consecutive samples is imposed on the LDV flow processor. A study of asymptotic convergence conducted at several radial locations led to the conclusion that this dead time renders the measured value independent of the sampling rate. It was also found that the velocity bias incurred by not limiting the sampling rate of the LDV processor is in reasonable concordance with the theoretical predictions of Zhang (Reference Zhang2002).
For each measurement point, an average of
 $6.5\times 10^{5}$
data samples acquired over
 $330~\text{s}$
are considered in the case of velocity measurements alone. In the case of simultaneous LDV–cold-wire (LDV–CW) measurements, an average of
 $9\times 10^{4}$
data samples acquired over
 $440~\text{s}$
is used.
2.3. Cold-wire thermometry
Temperature fluctuations are measured using cold-wire probes coupled with constant current anemometers (CCAs). The CCAs are operated with a current of 0.1 mA, thus ensuring very low velocity sensitivity. The CCAs are made in-house and provide a dynamic response well above flow cutoff frequencies while giving a very high signal-to-noise ratio as explained in Lemay & Benaïssa (Reference Lemay and Benaïssa2001). The cold-wire probes are welded in-house, using Pt–10 % Rh Wollaston wire of diameter
 $d=0.58~{\rm\mu}\text{m}$
, and have a sensitive length etched to
 $l=0.55~\text{mm}$
. This gives a ratio to the Kolmogorov microscale of
 $l/{\it\eta}\approx 5.5$
for the jet centreline at
 $x/D=30$
.
A NI PCI-6023E 12-bit data acquisition board with a SCXI-1000 conditioning unit equipped with a SCXI-1141 filter/amplifier module is used to digitize the CCA signal. The frequency response of the cold-wire probes is determined for flow velocities ranging from 1.5 to
 $12~\text{m}~\text{s}^{-1}$
using the potential flow available at the jet nozzle exit and the current injection technique described in Lemay & Benaïssa (Reference Lemay and Benaïssa2001).
The cold-wire probes are positioned using a sturdy tripod equipped with translation stages especially designed for this operation. Also, the probe holders provide the appropriate clearance to ensure that the tripod is located far enough downstream of the measurement point that it would not induce significant flow disturbances. LDV measurements performed with and without the tripod in position produce virtually identical results.
2.4. Dual LDV–cold-wire measurements
Establishment of the
 $\overline{{\it\theta}^{2}}/2$
and
 $\overline{u_{i}{\it\theta}}$
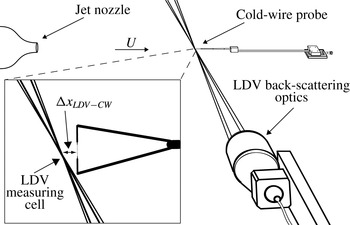
transport budgets requires access to mixed velocity–temperature moments. These are measured by positioning a cold-wire probe just downstream of the LDV measurement cell, as portrayed in figure 2 and described by Darisse et al. (Reference Darisse, Lemay and Benaïssa2013a
). For these measurements, the cold-wire probes are systematically checked for wire straightness. A micrometric translation stage with a least count of 0.0254 mm is used to precisely position the cold-wire probe. If the intensity of the laser beams used is not very high, one could position the LDV measurement cell and the sensitive part of the cold-wire in the exact same spot. Obviously, in the present case, doing such a thing is inconceivable, so a precise study of just how close downstream of the measurement cell the cold-wire probe can be located without experiencing contamination must be undertaken beforehand. A distance
 ${\rm\Delta}x_{LDV-CW}$
that is between 2 and 3 Kolmogorov microscales was found and is used for the present experiment. This distance is consistent with what was found by Wardana, Ueda & Mizomoto (Reference Wardana, Ueda and Mizomoto1995) and Pietri, Amielh & Anselmet (Reference Pietri, Amielh and Anselmet2000), whereas Heist & Castro (Reference Heist and Castro1998) used a slightly larger distance.
Schematic of the cold-wire probe, the LDV optics and the measuring cell.

The temperature signal is acquired in parallel by the acquisition board described earlier at a sampling frequency of 40 kHz and by the 16-bit acquisition board of the LDV processor. For the latter, the signal is registered only when a particle is detected in the measurement cell by the processor. The signal from the traditional data acquisition board is then low-pass filtered and resynchronized to the one acquired by the LDV in order to compute heat fluxes. A time delay, proportional to the flow convective time between the LDV measurement cell and the cold-wire probe, is considered in order to take into account the gap between the two probes. Wardana et al. (Reference Wardana, Ueda and Mizomoto1995) also used this strategy.
The deposition of oil droplets on the sensitive part of a cold-wire probe affects its frequency response, as demonstrated by Weiss, Paranthoën & Lecordier (Reference Weiss, Paranthoën and Lecordier2005). This adverse effect can be prevented by burning the deposit through a momentary anemometer overheat ratio raise (see Tholet & Bogart Reference Tholet and Bogart1994) or with the use of a solvent. In the present case, the oil deposits are washed out by dipping the probe in acetone after each 30 or 60 s of consecutive measurements, depending on the signal characteristics. The consequences for the temperature spectrum of a failure to wash the probe with regularity are depicted in Darisse et al. (Reference Darisse, Lemay and Benaïssa2013a ). Only files reporting a temperature fluctuation variance and skewness sufficiently close to those previously obtained without seeding are considered for post-processing.
2.5. Remarks on uncertainties
An uncertainty analysis is performed for most centreline results. In the case of mean and fluctuating temperature, the specific characteristics of the calibration equipment and data acquisition board used are taken into account. The impact of curve-fits performed on the calibration data, stability of the jet apparatus operation point and laboratory ambient conditions, as well as the accuracy of the fine positioning of the probes, are also examined.
A confidence level of 95 % is considered in the propagation-of-uncertainty analysis (see Coleman & Steele Reference Coleman and Steele1999). Also, the variances of the mean and variance estimators given in Benedict & Gould (Reference Benedict and Gould1996) are used, along with the assumption of a normal distribution and the consideration of statistically independent samples. As suggested by George, Beuther & Lumley (Reference George, Beuther and Lumley1978), only
 $1/(2T_{I})$
independent samples should be considered per second of measurement time. The flow integral time scale,
 $T_{I}$
, is defined as
 $$\begin{eqnarray}T_{I}=\int _{0}^{\infty }R_{uu}({\it\tau})\,\text{d}{\it\tau},\end{eqnarray}$$
where
 $R_{uu}({\it\tau})$
is the temporal autocorrelation coefficient of the streamwise velocity. Previous measurements returned
 $T_{I}=0.007~\text{s}$
(so
 $1/(2T_{I})=72$
independent samples per second) on the jet centreline, at
 $x/D=30$
. Hence, for this location, this process yields
 $$\begin{eqnarray}\displaystyle & {\it\Theta}_{0}=3.38\pm 0.06\,^{\circ }\text{C}, & \displaystyle\end{eqnarray}$$
 $$\begin{eqnarray}\displaystyle & \displaystyle \left.\frac{\overline{{\it\theta}^{2}}}{{\it\Theta}_{0}^{2}}\right|_{{\it\xi}=0}=0.039\pm 0.002. & \displaystyle\end{eqnarray}$$
An analysis based on compliance with the continuity, mean momentum and enthalpy equations, together with a similar study of uncertainty propagation, is conducted for the LDV data. This particular approach reveals levels of uncertainty in accordance with those reported by Iyer & Woodmansee (Reference Iyer and Woodmansee2005). The following uncertainties are found, on the jet centreline, at
 $x/D=30$
:
 $$\begin{eqnarray}\displaystyle & U_{0}=7.78\pm 0.03~\text{m}~\text{s}^{-1}, & \displaystyle\end{eqnarray}$$
 $$\begin{eqnarray}\displaystyle & \displaystyle \left.\frac{k}{U_{0}^{2}}\right|_{{\it\xi}=0}=0.079\pm 0.006, & \displaystyle\end{eqnarray}$$
 $$\begin{eqnarray}\displaystyle & \displaystyle \left.\frac{\overline{u{\it\theta}}}{U_{0}{\it\Theta}_{0}}\right|_{{\it\xi}=0}=0.023\pm 0.002. & \displaystyle\end{eqnarray}$$
 $k$
and
 $\overline{{\it\theta}^{2}}/2$
budget terms, as will be presented in § 5.
3. Self-similar behaviour
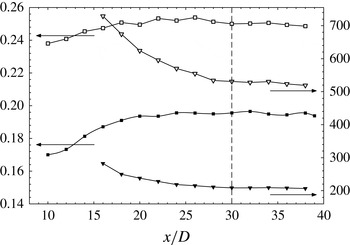
Figure 3 presents the streamwise evolution of different parameters of interest measured on the jet centreline. In the present case,
 $\sqrt{\overline{u^{2}}}$
displays self-similarity from
 $x/D=18$
onwards. Based on SHW measurements, Chua & Antonia (Reference Chua and Antonia1986), at
 $\mathit{Re}_{D}=17\,500$
, observed self-preservation for
 $\sqrt{\overline{u^{2}}}$
starting as early as
 $x/D=15$
, whereas Xu & Antonia (Reference Xu and Antonia2002), for
 $\mathit{Re}_{D}=86\,000$
, noticed self-preserving behaviour beginning around
 $x/D=25$
. For
 $\sqrt{\overline{v^{2}}}$
, Xu & Antonia (Reference Xu and Antonia2002) reported self-preservation further downstream, at approximately
 $x/D=60$
. However, from
 $x/D=35$
onwards, the streamwise evolution of
 $\sqrt{\overline{v^{2}}}$
observed by PL (their figure 5) is constant within a
 $\pm 3\,\%$
margin, suggesting that a self-preserving behaviour is reached at this location. This observation was also supported by the LES of Bogey & Bailly (Reference Bogey and Bailly2009). Judging from the variability of the locations at which self-preservation is attained, a definite conclusion in this regard based on the literature seems hard to reach.
Streamwise evolution of various normalized parameters along the jet centreline: ▫,
 $\sqrt{\overline{u^{2}}}/U_{0}$
; ▪,
 $\sqrt{\overline{{\it\theta}^{2}}}/{\it\Theta}_{0}$
; ▿,
 $\mathit{Re}_{{\it\lambda}}$
; ▾,
 $\mathit{Pe}_{{\it\lambda}}$
.

The streamwise evolution of
 $\mathit{Re}_{{\it\lambda}}$
as inferred from
 ${\it\epsilon}_{k_{iso}}$
(estimated from SHW measurements and local isotropy with Taylor’s hypothesis instead of using the value inferred from the
 $k$
budget as in table 1) is also presented in figure 3. It appears to reach an asymptotic value upstream of
 $x/D=30$
, which suggests that the equilibrium of small scales has been reached and self-similar behaviour of all quantities achieved. Based on SHW measurements, Xu & Antonia (Reference Xu and Antonia2002) (
 $\mathit{Re}_{D}=86\,000$
) observed self-preservation for
 $\sqrt{\overline{u^{2}}}$
starting at approximately
 $x/D=25$
, and further downstream for
 $\sqrt{\overline{v^{2}}}$
, at approximately
 $x/D=60$
. Chua & Antonia (Reference Chua and Antonia1986) (
 $\mathit{Re}_{D}=17\,500$
) observed, also based on SHW measurements, self-preserving behaviour of their jet for
 $\sqrt{\overline{u^{2}}}$
as early as
 $x/D=15$
.
For the scalar, Chua & Antonia (Reference Chua and Antonia1986) and AM considered self-preservation based on a constant value of
 $\sqrt{\overline{{\it\theta}^{2}}}/{\it\Theta}_{0}$
reached at
 $x/D>15$
. Based on the same criterion, Mi, Nobes & Nathan (Reference Mi, Nobes and Nathan2001) analysed a series of measurement results obtained in different conditions and concluded that self-preservation is attained at varying downstream locations, depending on the initial conditions.
Asymptotic behaviour of the streamwise evolution of turbulent and passive scalar-related statistics is a necessary, though not sufficient, condition to guarantee self-preservation. By analogy to the dynamic field, complete self-preservation is warranted by the constancy of the turbulent Péclet number
 $\mathit{Pe}_{{\it\lambda}}\equiv {\it\lambda}_{{\it\theta}}\sqrt{\overline{u^{2}}}/{\it\alpha}$
. In the present case,
 $\mathit{Pe}_{{\it\lambda}}$
can be rewritten as
 $$\begin{eqnarray}\mathit{Pe}_{{\it\lambda}}=\left(\frac{3}{15}\;\mathit{Pr}\;\frac{\hspace{2.22198pt}\overline{{\it\theta}^{2}}\hspace{2.22198pt}}{\overline{u^{2}}}\;\frac{{\it\epsilon}_{k_{iso}}}{{\it\epsilon}_{{\it\theta}_{iso}}}\right)^{1/2}\;\mathit{Re}_{{\it\lambda}}.\end{eqnarray}$$
As shown in figure 3,
 $\mathit{Pe}_{{\it\lambda}}$
has a constant value from
 $x/D=30$
on. It can then be concluded that the scalar field reaches a self-preserving state at the current measurement position.
4. Statistical properties of velocity and temperature fields
4.1. Momentum integral and mean velocity results
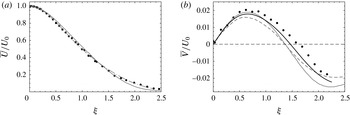
Radial profiles of the normalized mean streamwise and radial velocity are shown in figure 4. The present mean streamwise velocity is compared with the data reported by PL (FHW) and HCG (LDV). The agreement between the three sets of data is almost flawless, the only discrepancy being that the curve reported by PL lies slightly above our curve for
 ${\it\xi}\approx 1$
and below for
 ${\it\xi}>1.5$
. Using this profile at
 $x/D=30$
and the ones presented in figure 5, the following momentum integral is evaluated and compared with the momentum flux at the nozzle of the jet,
 $M_{j}$
:
 $$\begin{eqnarray}M=2{\rm\pi}{\it\rho}\int _{0}^{\infty }\left[\overline{U^{2}}+\overline{u^{2}}-\frac{1}{2}(\overline{v^{2}}+\overline{w^{2}})\right]r\,\text{d}r.\end{eqnarray}$$
Radial profiles of the normalized mean velocity components: (a) streamwise velocity, present LDV data (filled circles) compared with the results of PL (grey solid line) and HCG (grey dot–dash line); (b) radial velocity, present LDV data (filled circles) and
 $\overline{V}$
inferred from the continuity equation (4.2) (black solid line) compared with the results of PL (grey solid line).

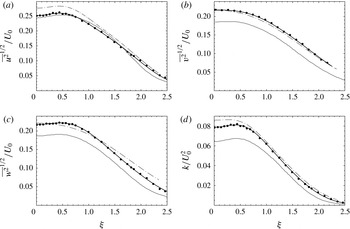
Radial profiles of normalized root-mean-square velocity fluctuations and turbulent kinetic energy: present LDV data (filled circles) and best-fit curve (black solid line) compared with the results of PL (grey solid line) and HCG (grey dot–dash line).

In the present experiment, a value of
 $M/M_{j}=1.04$
is obtained. PL reported a practically identical value for the same measurement location, whereas HCG (LDV) obtained 0.97 at
 $x/d=70$
. George (Reference George1990) examined the momentum integral deficit revealed in Wygnanski & Fiedler (Reference Wygnanski and Fiedler1969) and concluded that the discrepancies between their results and those found later could not solely be explained by differences in the boundary conditions. In the present case, the value obtained for
 $M/M_{j}$
reinforces the following claims.
-
(i) The jet evolves freely in an environment that prevents the formation of any return flow.
-
(ii) The apparatus used to ensure uniformity of the thermal boundary conditions does not interfere with jet entrainment in a noticeable way; if that were the case, the value of
 $M/M_{j}$
obtained would have been much larger.

In figure 4(b), the value of the mean radial velocity is in reasonable agreement with the value inferred from the continuity equation:
 $$\begin{eqnarray}\frac{\overline{V}}{U_{0}}=\frac{B_{R_{U}}}{{\it\xi}}\hspace{2.22198pt}\left[{\it\xi}^{2}\left(\frac{\overline{U}}{U_{0}}\right)+({\it\beta}_{U}-2)\int _{0}^{{\it\xi}}{\it\xi}^{\prime }\left(\frac{\overline{U}}{U_{0}}\right)\,\text{d}{\it\xi}^{\prime }\right],\end{eqnarray}$$
where
 ${\it\beta}_{U}=1.014$
accounts for the effects of initial conditions which are inducing differences in the virtual origins of the
 $U_{j}/U_{0}$
and
 $R_{U}/D$
distributions (see § A.2.1 for details). The closeness between the measured and calculated data confirms that the seeding was sufficiently uniform, especially in the outer parts of the jet. The calculated values of the radial mean velocity also provide a test for the boundary conditions, as (4.2) includes
 $B_{R_{U}}$
, the jet spreading rate. The evolution of the jet half-width,
 $R_{U}$
, for the present jet is explored in Darisse et al. (Reference Darisse, Lemay and Benaïssa2013b
) and yielded a value of
 $B_{R_{U}}=0.091$
, which is very close to the values obtained by HCG (LDV) and PL, as shown in table 1. A similarly good agreement between measured and calculated values of
 $\overline{V}/U_{0}$
was obtained by Khorsandi, Gaskin & Mydlarski (Reference Khorsandi, Gaskin and Mydlarski2013) in a water jet using acoustic doppler velocimetry.
4.2. Second-order moments of velocity fluctuations
Figure 5 shows radial profiles of the square root of the Reynolds stresses
 $\overline{u^{2}}$
,
 $\overline{v^{2}}$
and
 $\overline{w^{2}}$
, normalized by the mean centreline velocity, along with the turbulent kinetic energy
 $k$
, normalized by the square of the mean centreline velocity. For
 $\overline{u^{2}}$
(figure 5
a), reasonable agreement is observed between the present data and the results of PL on the centreline, whereas the data of HCG are higher. The off-axis peak, which is to be expected from the turbulent production profile, can be seen in the present data as well as in the results of PL and HCG. The present data for
 $\overline{v^{2}}$
(figure 5
b) appear to match the results obtained by HCG across the entire jet, while in contrast the data of PL lie a bit lower. The present radial profile of
 $\overline{v^{2}}$
also agrees with the DNS results reported by Wang et al. (Reference Wang, He, Lv, Zhou, Fan and Cen2010). Moreover, by axisymmetric considerations, the values of
 $\overline{v^{2}}$
and
 $\overline{w^{2}}$
have to be equal for
 ${\it\xi}=0$
. The present data satisfy this criterion.
The azimuthal Reynolds stress
 $\overline{w^{2}}$
obtained in the present study exhibits an off-axis hump at roughly the same location as that for
 $\overline{u^{2}}$
. In the former case, this hump can be explained by the shape of the turbulence production curve. The magnitude of the Reynolds number as an explanation of the presence of this hump seems unlikely, since HCG with
 $\mathit{Re}_{D}=9.5\times 10^{4}$
did not measure such a hump, while PL with
 $\mathit{Re}_{D}=1.1\times 10^{4}$
did. The LES of Bogey & Bailly (Reference Bogey and Bailly2009) with a
 $\mathit{Re}_{D}$
identical to that of PL found the hump, but at a slightly higher level. A DNS study performed by Babu & Mahesh (Reference Babu and Mahesh2005) for a round jet with
 $\mathit{Re}_{D}=2400$
also reported the hump. More recently, Darisse et al. (Reference Darisse, Lemay and Benaïssa2013b
) found that the hump in the
 $\overline{w^{2}}$
profile is due especially to velocity events with a large incident angle. They found that by filtering the LDV signal, with the aim of mimicking the behaviour of a stationary X-hot-wire probe, the hump in
 $\overline{w^{2}}$
would vanish.
The radial profile of
 $k$
is also presented in figure 5(d). The present results agree relatively well with the
 $k$
profile reported by HCG, whereas that of PL lies a little lower, reflecting the behaviour of their radial and azimuthal components. However, there is good agreement (not shown here) with the DNS results reported by Wang et al. (Reference Wang, He, Lv, Zhou, Fan and Cen2010).
The Reynolds shear stress
 $\overline{uv}$
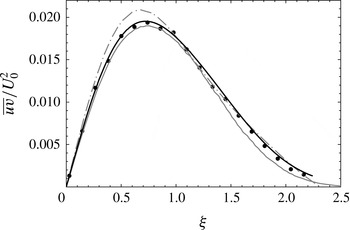
, normalized by the square of the mean centreline velocity, is presented in figure 6. A test of the consistency of the present data comes from the expression for
 $\overline{uv}$
derived from the mean momentum equations:
 $$\begin{eqnarray}\displaystyle \frac{\overline{uv}}{U_{0}^{2}} & = & \displaystyle \underbrace{\frac{B_{R_{U}}}{{\it\xi}}\left[(2-{\it\beta}_{U})\left(\frac{\overline{U}}{U_{0}}\right)\int _{0}^{{\it\xi}}{\it\xi}^{\prime }\left(\frac{\overline{U}}{U_{0}}\right)\,\text{d}{\it\xi}^{\prime }+2({\it\beta}_{U}-1)\int _{0}^{{\it\xi}}{\it\xi}^{\prime }\left(\frac{\overline{U}}{U_{0}}\right)^{2}\,\text{d}{\it\xi}^{\prime }\right]}_{\text{I}}\nonumber\\ \displaystyle & & \displaystyle +\,\underbrace{B_{R_{U}}\left[{\it\xi}\frac{(\overline{u^{2}}-\overline{v^{2}})}{U_{0}^{2}}+\frac{2({\it\beta}_{U}-1)}{{\it\xi}}\int _{0}^{{\it\xi}}{\it\xi}^{\prime }\frac{(\overline{u^{2}}-\overline{v^{2}})}{U_{0}^{2}}\,\text{d}{\it\xi}^{\prime }\right]}_{\text{II}}\nonumber\\ \displaystyle & & \displaystyle +\,\underbrace{B_{R_{U}}\left[{\it\beta}_{U}\hspace{2.22198pt}{\it\xi}\int _{{\it\xi}}^{\infty }\frac{1}{{\it\xi}^{\prime }}\frac{(\overline{v^{2}}-\overline{w^{2}})}{U_{0}^{2}}\,\text{d}{\it\xi}^{\prime }+\frac{({\it\beta}_{U}-1)}{{\it\xi}}\int _{0}^{{\it\xi}}{\it\xi}^{\prime }\frac{(\overline{v^{2}}-\overline{w^{2}})}{U_{0}^{2}}\,\text{d}{\it\xi}^{\prime }\right]}_{\text{III}}.\end{eqnarray}$$
Radial profile of the normalized Reynolds shear stress and comparison with the estimate from the mean momentum equation: present LDV data (filled circles) and
 $\overline{uv}$
inferred from (4.3) (black solid line) compared with the results of PL (grey solid line) and HCG (grey dot–dash line).

The expression (4.3) is divided into three parts. Term I is related to the mean streamwise velocity, while terms II and III represent the influences of Reynolds stresses. Because of the axisymmetric aspect of the jet, the value of the third term in (4.3) is null on the centreline and remains negligible throughout the jet. Moreover, as in the case of the equation of mean radial velocity (4.2), the parameter
 ${\it\beta}_{U}$
accounts for the effects of initial conditions. It is worth pointing out that
 ${\it\beta}_{U}$
approaches unity for large values of the streamwise location
 $x/D$
. In this case, the last terms in each of the three lines of (4.3) are null and one finds the usual form of the Reynolds shear stress inferred from the momentum equation. The present measurements of
 $\overline{uv}$
closely fit the outcome of (4.3), which is an indication of the statistical convergence and consistency of the present LDV database.
4.3. Third-order moments of velocity fluctuations
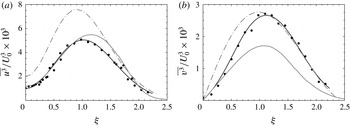
The third-order moments of velocity fluctuations are presented in figures 7 and 8. In the case of the
 $\overline{u^{3}}$
moment (figure 7
a), our results agree well with the data of PL, especially around the jet centreline. In the case of
 $\overline{v^{3}}$
(figure 7
b), the data of HCG appear to follow the present results more closely, particularly in the outer part of the jet, while the measurements of PL fall below the LDV data reported here.
Radial profiles of normalized third-order normal moments of the velocity fluctuations: the present LDV data (filled circles) and best-fit curve (black solid line) compared with the results of PL (grey solid line) and HCG (grey dot–dash line).

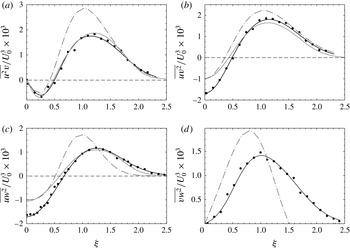
Radial profiles of normalized third-order shear moments of the velocity fluctuations: the present LDV data (filled circles) and best-fit curve (black solid line) compared with the PL results (grey solid line) and HCG LDV results (or HCG SHW results in the case of
 $\overline{vw^{2}}$
) (grey dot–dash line).

The other non-zero third-order moments of the velocity fluctuations are plotted in figure 8. The value for
 $\overline{uv^{2}}$
(figure 8
a) presented here agrees closely with the PL data throughout the jet. The results from HCG (LDV) tend to follow our data around the jet centreline, but they exhibit a higher bump around
 ${\it\xi}=1$
.
As expected, the centreline values of
 $\overline{uv^{2}}$
and
 $\overline{uw^{2}}$
(figure 8
b and c, respectively) are nearly identical, as required by axisymmetry. For these two moments, though, the results reported by PL and HCG (LDV) differ substantially from the present ones. This is especially remarkable on the jet centreline; the present data are much lower than the values of PL and HCG (LDV), which agree at this location.
Figure 8(d) also displays the third-order moment
 $\overline{vw^{2}}$
of velocity fluctuation. The estimation of this quantity in air jets has historically been problematic: the use of X-hot-wire probes only allows measurement of one velocity component other than the streamwise one. To circumvent this limitation, Wygnanski & Fiedler (Reference Wygnanski and Fiedler1969) used the technique developed by Townsend (Reference Townsend1949). The value of
 $\overline{vw^{2}}$
could be inferred from the signal of a probe positioned at a roll angle of
 $45^{\circ }$
together with prior knowledge of the Reynolds stresses. HCG positioned an X-hot-wire probe set for
 $U{-}V$
measurements close to another probe set for
 $U{-}W$
measurements. The results they found were deemed unreliable, partly due to the spatial integration but mainly because of the probable (and hard-to-quantify) cross-thermal contamination between the two probes. The data they obtained are plotted against our results in figure 8(d).
PL and HCG chose to use
 $\overline{v^{3}}$
as a surrogate for
 $\overline{vw^{2}}$
in the turbulent diffusion term of the
 $k$
budget. The idea behind this substitution is that by symmetry, just like
 $\overline{vw^{2}}$
,
 $\hspace{2.22198pt}\overline{v^{3}}$
has to cross the centreline at value zero, remain positive throughout the jet and approach zero again in the outer part.
The present data for
 $\overline{vw^{2}}$
were obtained by orienting the longer side of the LDV measurement cell streamwise, which was achieved by positioning the LDV optics downstream of the measurement location. The laser beams were aligned so that both the radial and the azimuthal components of velocity could be measured. The 1000 mm beam expander and the optic support used allowed for sufficient clearance so that the bulkier LDV positioning apparatus could be located far enough downstream. The data for
 $\overline{V}$
,
 $\overline{v^{2}}$
,
 $\overline{w^{2}}$
and
 $\overline{v^{3}}$
acquired in that configuration were virtually identical to the profiles reported here. Also, Pitot tube traverses at the measurement location did not reveal any noticeable differences in the value of
 $\overline{U}$
. The LES of Bogey & Bailly (Reference Bogey and Bailly2009) found a curve that is very similar to the present data around the jet centreline but lower for the rest of the jet. More recently, Wang et al. (Reference Wang, He, Lv, Zhou, Fan and Cen2010) performed a DNS study of a round jet at
 $\mathit{Re}_{D}=4700$
and found values for
 $\overline{vw^{2}}$
that nearly match the present results, despite some statistical convergence issues.
4.4. Mean and fluctuating temperature fields
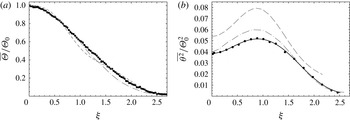
Radial distributions of the mean temperature relative to the ambient temperature and the variance of temperature fluctuations are presented in figure 9. Our results are compared with those reported by Chevray & Tutu (Reference Chevray and Tutu1972) and Chua & Antonia (Reference Chua and Antonia1990). In the present case, mean temperature measurements were performed across the jet using a thermistor probe, whereas in the other two studies cold-wire probes were used. Chevray & Tutu (Reference Chevray and Tutu1972) performed their measurements at a streamwise distance of
 $x/D=15$
, while Chua & Antonia (Reference Chua and Antonia1990) (hereafter referred to as CA) reported measurements taken at several downstream locations. However, CA’s data corresponding to
 $x/D=30$
are the only results considered here, because AM used some of CA’s measurements to compute their
 $\overline{{\it\theta}^{2}}/2$
budget at this particular downstream location.
Radial profiles of: (a) normalized mean temperature relative to ambient temperature; (b) normalized variance of temperature fluctuations. The present thermistor (
 $\overline{{\it\Theta}}$
) and cold-wire (
 $\overline{{\it\theta}^{2}}$
) data (filled circles) together with the best-fit curves (black solid lines) are compared with results reported by Chevray & Tutu (Reference Chevray and Tutu1978) at
 $x/D=15$
(grey dot–dash lines) and CA at
 $x/D=30$
(grey dashed lines).

Figure 9(a) shows that for
 ${\it\xi}\leqslant 1$
, the present
 $\overline{{\it\Theta}}$
profile and that of Chevray & Tutu (Reference Chevray and Tutu1972) are in very good agreement, while further away from the centreline their data lie marginally lower than ours. The
 $\overline{{\it\Theta}}$
profile reported in CA lies slightly lower than the present one for
 $0.8\leqslant {\it\xi}\leqslant 1.4$
. However, their profile is in reasonably good agreement with the present data.
For the variance of temperature fluctuations, the present data appear to match the results of Chevray & Tutu (Reference Chevray and Tutu1972) on the jet centreline and in the outer part of the jet, whereas around
 ${\it\xi}=1$
the data of Chevray & Tutu (Reference Chevray and Tutu1972) are higher than our values. The data of CA are considerably higher than the present values, with the exception of the outermost part of the jet, in which relatively good agreement with the present data is observed. It must be pointed out that these values for
 $\overline{{\it\theta}^{2}}/{\it\Theta}_{0}^{2}$
appear to be at odds with the values previously reported by Chua & Antonia (Reference Chua and Antonia1986) for the jet centreline, in the same jet apparatus, under arguably identical conditions. In that particular case, the reported values of
 $\overline{{\it\theta}^{2}}/{\it\Theta}_{0}^{2}$
were very close to the present ones. Moreover, AM reported a centreline value of 0.04, which is in very close agreement with the present one. Mi et al. (Reference Mi, Nobes and Nathan2001) also reported centreline values of
 $\overline{{\it\theta}^{2}}/{\it\Theta}_{0}^{2}$
that are very similar to ours, although slightly higher, in a round jet with
 $\mathit{Re}_{D}=16\,000$
.
4.5. Mixed velocity–temperature correlations
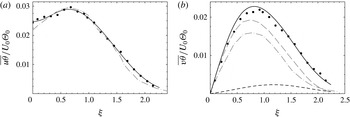
The radial distributions of turbulent heat fluxes, normalized by
 $U_{0}{\it\Theta}_{0}$
, are depicted in figure 10. The present data for
 $\overline{u{\it\theta}}$
(figure 10
a) appear to track the results of Chevray & Tutu (Reference Chevray and Tutu1978) very closely in the region spreading out from the centreline up to
 ${\it\xi}\approx 1.5$
. In the outer part of the jet (
 ${\it\xi}>1.5$
), SHW–CW measurements reported by Chevray & Tutu (Reference Chevray and Tutu1978) are slightly lower than the present LDV–CW data. This discrepancy is expected for two reasons.
-
(i) The single SHW probe underestimates the streamwise velocity fluctuations in this region, which is characterized by high turbulence levels (as supported by HCG and by Darisse et al. Reference Darisse, Lemay and Benaïssa2013b ).
-
(ii) Due to the occurrence of turbulent events characterized by negative instantaneous streamwise velocity, the cold-wire signals are most probably affected by thermal contamination coming from the SHW probe, which is located a short distance downstream (as required to obtain a good estimate of a single point correlation).
Radial profiles of turbulent heat fluxes: (a)
 $\overline{u{\it\theta}}/(U_{0}{\it\Theta}_{0})$
, present LDV–CW data (filled circles) and best-fit curve (black solid line) compared with measurements of Chevray & Tutu (Reference Chevray and Tutu1978) at
 $x/D=15$
(grey dot–dash line); (b)
 $\overline{v{\it\theta}}/(U_{0}{\it\Theta}_{0})$
, present LDV–CW data (filled circles),
 $\overline{v{\it\theta}}$
inferred from (4.4) (black solid line) and the part of
 $\overline{v{\it\theta}}$
accounted for by term II in (4.4) (black dashed line), compared with the enthalpy equation results of CA (only mean fields, grey dashed line) and the SHW–CW measurements of Chevray & Tutu (Reference Chevray and Tutu1978) at
 $x/D=15$
(grey dot–dash line).

For these two reasons, in the outer part of a heated free jet, a SHW–CW combined probe is not expected to provide accurate measurements of any second- or third-order mixed correlations.
The radial distribution of
 $\overline{v{\it\theta}}/U_{0}{\it\Theta}_{0}$
is presented in figure 10(b). Another assessment of consistency for the present dataset is provided by the degree of compliance of this flux with its corresponding expression inferred from the mean enthalpy equation. The following equation expresses the value of
 $\overline{v{\it\theta}}/U_{0}{\it\Theta}_{0}$
as a sum of contributions from the mean (term I) and fluctuating (term II) thermal and velocity fields:
 $$\begin{eqnarray}\displaystyle \frac{\overline{v{\it\theta}}}{U_{0}{\it\Theta}_{0}} & = & \displaystyle \underbrace{\frac{B_{R_{U}}}{{\it\xi}}\int _{0}^{{\it\xi}}\left[{\it\beta}_{{\it\theta}}{\it\xi}^{\prime }\left(\frac{\overline{U}}{U_{0}}\right)\left(\frac{\overline{{\it\Theta}}}{{\it\Theta}_{0}}\right)+(2-{\it\beta}_{U})\frac{\text{d}}{\text{d}{\it\xi}^{\prime }}\left(\frac{\overline{{\it\Theta}}}{{\it\Theta}_{0}}\right)\int _{0}^{{\it\xi}^{\prime }}\tilde{{\it\xi}}\left(\frac{\overline{U}}{U_{0}}\right)\text{d}\tilde{{\it\xi}}\right]\text{d}{\it\xi}^{\prime }}_{\text{I}}\nonumber\\ \displaystyle & & \displaystyle +\,\underbrace{B_{R_{U}}\left[{\it\xi}\frac{\overline{u{\it\theta}}}{U_{0}{\it\Theta}_{0}}+\frac{({\it\beta}_{U}+{\it\beta}_{{\it\theta}}-2)}{{\it\xi}}\int _{0}^{{\it\xi}}{\it\xi}^{\prime }\frac{\overline{u{\it\theta}}}{U_{0}{\it\Theta}_{0}}\,\text{d}{\it\xi}^{\prime }\right]}_{\text{II}}.\end{eqnarray}$$
As in the case of (4.2) and (4.3), the parameter
 ${\it\beta}_{U}$
is used in (4.4) to account for the effects of initial conditions on the velocity field. For the same reason, a parameter
 ${\it\beta}_{{\it\theta}}$
is introduced to account for the effects of initial conditions on the temperature field. In the present case, at
 $x/D=30$
, differences in the virtual origins of the
 $U_{j}/U_{0}$
,
 ${\it\Theta}_{j}/{\it\Theta}_{0}$
and
 $R_{U}/D$
distributions yield
 ${\it\beta}_{U}=1.014$
and
 ${\it\beta}_{{\it\theta}}=1.015$
(see § A.2.1 for details). It is also worth pointing out that
 ${\it\beta}_{U}$
and
 ${\it\beta}_{{\it\theta}}$
both approach unity in the far field of the jet (for example,
 ${\it\beta}_{U}=1.0039$
and
 ${\it\beta}_{{\it\theta}}=1.0042$
for streamwise location
 $x/D=100$
). In this particular case, the last term of (4.4) is almost zero and one obtains the usual form of the turbulent heat flux inferred from the mean enthalpy equation.
The agreement between the outcome of (4.4) and the present data is almost perfect, especially in the outer part of the jet, which reinforces confidence in the present database. The contribution of the fluctuating velocity and thermal fields to (4.4) is presented in figure 10(b). CA had neglected this term as a first-order approximation, which resulted in a good match between the outcome of their equation (which is different from our equation because in their case the radial integration of the
 $\overline{V}$
component is not performed) and the data acquired using a special
 $120^{\circ }$
SHW probe. Pietri (Reference Pietri1997) also neglected this term. In that case, the data inferred from the equation fell below the values obtained from dual LDV–CW measurements. Figure 10(b) also shows a comparison with the data of Chevray & Tutu (Reference Chevray and Tutu1978); the latter values, despite
 $\mathit{Re}_{D}$
being similar to that of the present jet, are significantly lower.
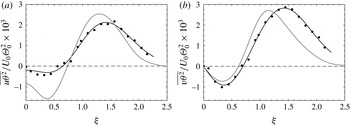
The radial distributions of the third-order mixed correlations
 $\overline{u{\it\theta}^{2}}$
and
 $\overline{v{\it\theta}^{2}}$
in the
 $\overline{{\it\theta}^{2}}/2$
budget are presented in figure 11. Published data for these two mixed correlations are very scarce. This situation can be explained by the extreme sensitivity of these two correlations to thermal contamination of the cold-wire signal, when combined SHW–CW probes are used.
Radial profiles of the normalized third-order mixed correlations (a)
 $\overline{u{\it\theta}^{2}}$
and (b)
 $\overline{v{\it\theta}^{2}}$
; the present results (filled circles and black solid lines) are compared with velocity–concentration third-order moments
 $\overline{uf^{2}}$
and
 $\overline{vf^{2}}$
reported by Panchapakesan & Lumley (Reference Panchapakesan and Lumley1993b
) for a helium jet (grey solid lines).

To the authors’ knowledge, only Antonia et al. (Reference Antonia, Prabhu and Stephenson1975) have published data for
 $\overline{u{\it\theta}^{2}}$
and
 $\overline{v{\it\theta}^{2}}$
in a slightly heated round jet flow. In their case, the jet evolved with a strong co-flow, so no graphic comparison will be presented here. Nevertheless, it is worth pointing out that in spite of a significant divergence in the magnitude of the data reported, the shapes of the curves obtained by Antonia et al. (Reference Antonia, Prabhu and Stephenson1975) are very similar to the present ones. Moreover, in the case of a helium jet, Panchapakesan & Lumley (Reference Panchapakesan and Lumley1993b
) reported triple moments of velocity–concentration (
 $\overline{uf^{2}}$
and
 $\overline{vf^{2}}$
) which are in relatively good agreement with the present velocity–temperature moments. Both the shape and the magnitude of their radial profiles are roughly comparable to the present ones, which is interesting, considering the fact that the scalar in their case is not entirely passive.
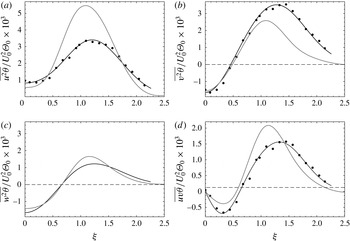
The radial distributions of the third-order mixed correlations involved in the budgets of the turbulent heat fluxes are presented in figure 12. The profiles of
 $\overline{u^{2}{\it\theta}}$
,
 $\overline{v^{2}{\it\theta}}$
and
 $\overline{uv{\it\theta}}$
are obtained from the present LDV–CW measurements. As the mixed moments involving temperature and the azimuthal velocity component are not available in the present dataset, the
 $\overline{w^{2}{\it\theta}}$
profile is generated using a model inspired by Lumley (Reference Lumley1978). The first two terms in (4.5) are the usual ones involved in Lumley’s model. In its original form, this basic gradient transport model does not satisfy the requirement that
 $\overline{v^{2}{\it\theta}}\equiv \overline{w^{2}{\it\theta}}$
on the centreline. Since this value is known from the present measurement (
 $\overline{v^{2}{\it\theta}}$
at
 ${\it\xi}=0$
is measured), it is possible to check the validity of the
 $\overline{w^{2}{\it\theta}}$
model. In order to fulfil this constraint on the jet centreline, a third term has been added and the original constant (
 $c_{{\it\theta}}=0.11{-}0.20$
) has been adjusted to
 $c_{{\it\theta}}=0.16855$
, as shown below:
 $$\begin{eqnarray}\overline{w^{2}{\it\theta}}=-0.16855\hspace{2.22198pt}\frac{k}{{\it\epsilon}_{k}}\left[\hspace{2.22198pt}\overline{u{\it\theta}}\frac{\partial \overline{w^{2}}}{\partial x}+\overline{v{\it\theta}}\frac{\partial \overline{w^{2}}}{\partial r}+\overline{w^{2}}\frac{\partial \overline{v{\it\theta}}}{\partial r}\hspace{2.22198pt}\right].\end{eqnarray}$$
Radial profiles of normalized third-order mixed moments involved in the budgets of the turbulent heat fluxes: the present results for
 $\overline{u^{2}{\it\theta}}$
,
 $\overline{v^{2}{\it\theta}}$
,
 $\overline{w^{2}{\it\theta}}$
and
 $\overline{uv{\it\theta}}$
(filled circles and black solid lines) are compared with velocity–concentration third-order moments
 $\overline{u^{2}f}$
,
 $\overline{v^{2}f}$
,
 $\overline{w^{2}f}$
and
 $\overline{uvf}$
reported by Panchapakesan & Lumley (Reference Panchapakesan and Lumley1993b
) for a helium jet (grey solid lines).

The self-similar form of the
 $\overline{w^{2}{\it\theta}}$
model is given by
 $$\begin{eqnarray}\displaystyle \frac{\overline{w^{2}{\it\theta}}}{U_{0}^{2}{\it\Theta}_{0}} & = & \displaystyle -0.16855\frac{k}{U_{0}^{2}}\frac{U_{0}^{3}}{{\it\epsilon}_{k}R_{U}}\left\{-B_{R_{U}}\frac{\overline{u{\it\theta}}}{U_{0}{\it\Theta}_{0}}\left[2{\it\beta}_{U}\frac{\overline{w^{2}}}{U_{0}^{2}}+{\it\xi}\frac{\text{d}}{\text{d}{\it\xi}}\left(\frac{\overline{w^{2}}}{U_{0}^{2}}\right)\right]\right.\nonumber\\ \displaystyle & & \displaystyle \left.+\,\frac{\overline{v{\it\theta}}}{U_{0}{\it\Theta}_{0}}\frac{\text{d}}{\text{d}{\it\xi}}\left(\frac{\overline{w^{2}}}{U_{0}^{2}}\right)+\frac{\overline{w^{2}}}{U_{0}^{2}}\frac{\text{d}}{\text{d}{\it\xi}}\left(\frac{\overline{v{\it\theta}}}{U_{0}{\it\Theta}_{0}}\right)\right\}.\end{eqnarray}$$
Interestingly, the shapes and magnitudes of these radial profiles of mixed moments are comparable to the third-order moments of velocity fluctuations presented in figures 7 and 8:
 $\overline{u^{2}{\it\theta}}$
,
 $\overline{v^{2}{\it\theta}}$
and
 $\overline{w^{2}{\it\theta}}$
compare relatively well with
 $\overline{u^{3}}$
,
 $\overline{uv^{2}}$
and
 $\overline{uw^{2}}$
, respectively, while
 $\overline{uv{\it\theta}}$
is in very good agreement with
 $\overline{u^{2}v}$
. To the authors’ knowledge, there are no other results available in the literature for these third-order mixed moments in a slightly heated round jet. However, for the helium jet (Panchapakesan & Lumley Reference Panchapakesan and Lumley1993b
), the radial profiles of
 $\overline{u^{2}f}$
,
 $\overline{v^{2}f}$
,
 $\overline{w^{2}f}$
and
 $\overline{uvf}$
compare relatively well with the present profiles. For the purpose of evaluating the
 $\overline{v{\it\theta}}$
budget (see § 5.5), these observations give us enough confidence in the level of accuracy of
 $\overline{w^{2}{\it\theta}}$
modelled after (4.6).
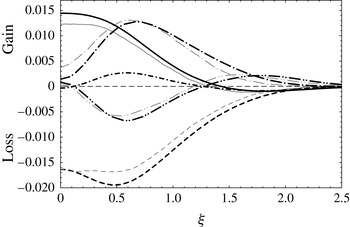
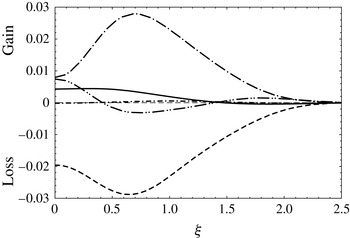
Budget of turbulent kinetic energy normalized by
 $U_{0}^{3}/R_{U}$
, where the present LDV data (black lines) are compared with the results of PL (grey lines): convection (——), production (— ⋅ —), turbulent diffusion (— ⋅ ⋅ —), pressure diffusion (
 ${-}\,\cdot \,{-}$
) and dissipation (– – – –) terms.

5. Budgets of turbulent kinetic energy, Reynolds stresses, temperature variance and turbulent heat fluxes
5.1. Budget of
$k$

The equation for the budget of the turbulent kinetic energy
 $k$
for a statistically stationary, incompressible and mean axisymmetric flow, including a thorough formulation of
 ${\it\epsilon}_{k}$
, is developed in detail in § A.1.2. In the budget equation (A 9), the terms
 $C_{k}$
,
 $P_{k}$
,
 $D_{k}$
,
 $M_{k}$
,
 ${\it\Pi}_{k}$
and
 ${\it\epsilon}_{k}$
stand, respectively, for mean flow convection, production, turbulent diffusion, molecular diffusion, pressure diffusion and dissipation. The first four terms (
 $C_{k}$
,
 $P_{k}$
,
 $D_{k}$
and
 $M_{k}$
) are measured directly, while the pressure diffusion term
 ${\it\Pi}_{k}$
is estimated using the model proposed by Lumley (Reference Lumley1978),
 $$\begin{eqnarray}{\it\Pi}_{k}=\frac{2}{5}\,\left[\frac{\partial \overline{ku}}{\partial x}+\frac{1}{r}\frac{\partial r\overline{kv}}{\partial r}\right]\vphantom{\left[\left(r\frac{\partial k}{\partial r}\right)\right]},\end{eqnarray}$$
where
 $\overline{ku}\equiv (\overline{u^{3}}+\overline{uv^{2}}+\overline{uw^{2}})/2$
and
 $\overline{kv}\equiv (\overline{u^{2}v}+\overline{v^{3}}+\overline{vw^{2}})/2$
, which represent the longitudinal and radial fluxes of
 $k$
due to turbulent motion. Instead of being measured directly, the dissipation rate
 ${\it\epsilon}_{k}$
is inferred from the balance of the
 $k$
budget. As mentioned above, the molecular diffusion term is measured directly, but a standard order-of-magnitude analysis clearly indicates that
 $M_{k}$
could be neglected under the high-Reynolds-number assumption. The present data show that this assumption is valid, since the largest value of this term is about four orders of magnitude smaller than the main terms of the
 $k$
budget. Thus, the molecular diffusion term will not be included in the present analysis. The final dimensional form of the
 $k$
budget, including Lumley’s model for
 ${\it\Pi}_{k}$
, is
 $$\begin{eqnarray}\displaystyle 0 & = & \displaystyle \underbrace{-\!\left[\overline{U}\frac{\partial k}{\partial x}+\overline{V}\frac{\partial k}{\partial r}\vphantom{\left[\overline{uv}\frac{\overline{V}\hspace{2.22198pt}\overline{w^{2}}}{r}\right]}\right]}_{C_{k}}\hspace{2.22198pt}\underbrace{-\left[\overline{u^{2}}\frac{\partial \overline{U}}{\partial x}+\overline{v^{2}}\frac{\partial \overline{V}}{\partial r}+\frac{\overline{V}\hspace{2.22198pt}\overline{w^{2}}}{r}+\overline{uv}\left(\frac{\partial \overline{U}}{\partial r}+\frac{\partial \overline{V}}{\partial x}\right)\right]}_{P_{k}}\nonumber\\ \displaystyle & & \displaystyle \underbrace{-\left[\frac{\partial \overline{ku}}{\partial x}+\frac{1}{r}\frac{\partial r\hspace{2.22198pt}\overline{kv}}{\partial r}\right]\vphantom{\left[\left(r\frac{\partial k}{\partial r}\right)\right]}}_{D_{k}}+\underbrace{\frac{2}{5}\,\left[\frac{\partial \overline{ku}}{\partial x}+\frac{1}{r}\frac{\partial r\hspace{2.22198pt}\overline{kv}}{\partial r}\right]\vphantom{\left[\left(r\frac{\partial k}{\partial r}\right)\right]}}_{{\it\Pi}_{k}\,(\mathit{model})}-\underbrace{\vphantom{\Bigg|}{\it\epsilon}_{k}}_{(\mathit{balance})}.\end{eqnarray}$$
The normalized, self-preserving version of this budget equation is presented in § A.2.2. The radial profiles appearing in (5.2) have been obtained through numerical regressions of the present data using the mathematical expression given in HCG.
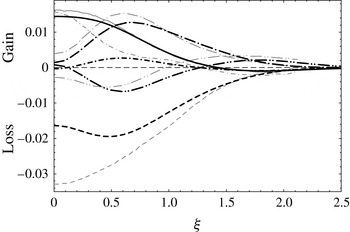
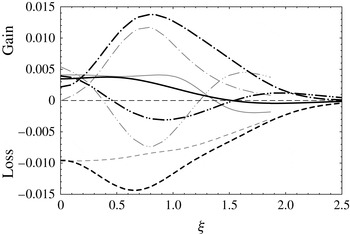
The turbulent kinetic energy transport budget inferred for the current data is plotted and compared with that of PL in figure 13 and with that of HCG in figure 15. In the present study, the pressure diffusion term
 ${\it\Pi}_{k}$
is estimated using Lumley’s model, and dissipation is taken as the closing balance of the budget. The use of Lumley’s model to evaluate
 ${\it\Pi}_{k}$
is also supported by Taub et al. (Reference Taub, Lee, Balachandar and Sherif2013) based on their DNS results. However, PL adopted a different strategy, making the assumption that the pressure diffusion term is negligible. Bogey & Bailly (Reference Bogey and Bailly2009) found the pressure diffusion term to be noticeable (i.e. non-negligible) on the centreline but insignificant in the outer part, thus validating its being neglected in the outer region.
The propagation-of-uncertainties analysis developed in § 2.5 produced centreline values for the convection (
 $C_{k}R_{U}/U_{0}^{3}=0.014\pm 0.001$
) and production (
 $P_{k}R_{U}/U_{0}^{3}=0.0014\pm 0.0008$
) terms. The assumption of a similar level of uncertainty for the remaining terms of the budget yielded
 ${\it\epsilon}_{k}R_{U}/U_{0}^{3}=0.016\pm 0.002$
on the centreline.
Figure 13 shows that there is good agreement between the terms of the present budget equation and those of PL, despite the difference in Reynolds number. This closeness between the datasets also holds for the dissipation, except that PL’s results suggest the existence of a plateau for
 ${\it\epsilon}_{k}$
around the jet centreline (
 $0\leqslant {\it\xi}\leqslant 0.6$
). The present data rather suggest a negative peak value near
 ${\it\xi}=0.5$
, this position being just slightly shifted as compared to the peak observed for the production term. This observed difference in the
 ${\it\epsilon}_{k}$
profiles is in part related to the influence of the pressure diffusion term, which is accounted for in the present balance but not in PL’s analysis.
The difference in the
 ${\it\epsilon}_{k}$
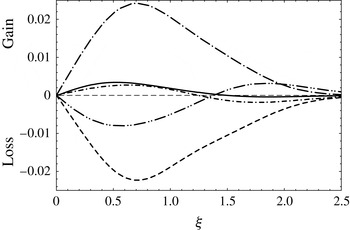
profiles is also related to a miscalculation of PL’s production terms. As will be formally demonstrated in § 5.2, PL unfortunately miscalculated
 $P_{vv}$
, and this resulted in a bias in the evaluation of
 $P_{k}$
. This would explain the discrepancy observed when comparing the production terms in figure 13. This important point affects not only the value of
 $P_{k}$
but also the result of the balancing term,
 ${\it\epsilon}_{k}$
. When this bias is taken into account, the production profile resulting from PL’s corrected data becomes nearly identical to the present one (see figure 18
b). Also, in the outer part of the jet (
 ${\it\xi}>1$
), the dissipation profile obtained from PL’s corrected data is in perfect agreement with the present profile, as can be expected, because in that region the pressure diffusion term is negligible (in the outer part, PL’s assumption is valid). This corrected
 ${\it\epsilon}_{k}$
profile inferred from PL’s budget now exhibits a negative peak value at
 ${\it\xi}=0.5$
, just like ours, and the aforementioned plateau (
 $0\leqslant {\it\xi}\leqslant 0.6$
) for
 ${\it\epsilon}_{k}$
no longer exists. Other consequences of PL’s miscalculation of the production term
 $P_{vv}$
will be discussed in § 5.2.
Moreover, figure 13 shows that the turbulent diffusion profile reported by PL is in very good agreement with the current data, even though PL used a surrogate for the estimate of
 $\overline{vw^{2}}$
. In the present case, since a reliable estimate of the third-order moment
 $\overline{vw^{2}}$
has been acquired, the value of the turbulent diffusion term
 $D_{k}$
is wholly calculated. The present measurements also indicate that the assumption
 $\overline{v^{3}}=\overline{vw^{2}}$
would have led to a sign inversion on the centreline and an error of approximately 15 % across the jet. However, as PL used this assumption and obtained a radial profile for
 $D_{k}$
that compares very well with the present one, it might be tempting to conclude that the use of their substitution is accurate. It will be shown in § 5.2 that the observed agreement is not sufficient for concluding the correctness of PL’s substitution for
 $\overline{vw^{2}}$
.
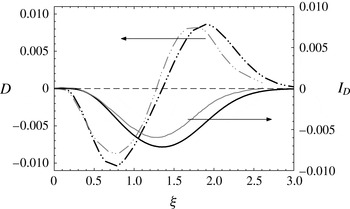
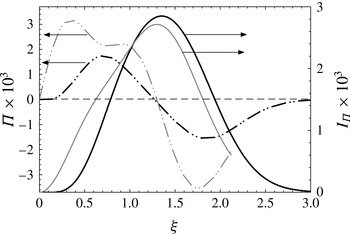
Turbulent diffusion and pressure diffusion are also called redistribution terms because they are expressed as a divergence of energy fluxes. The divergence theorem states that the integral of these terms over an infinite control volume is zero, because the net flux through the control surfaces of this volume is zero. For the self-preserving region of the round jet, where streamwise gradients are almost negligible, this concept can be applied to a finite cylindrical volume of fluid. In this case, the volume integral of the turbulent diffusion term, written in cylindrical coordinates, reduces to
 $$\begin{eqnarray}I_{D}=\int _{0}^{{\it\xi}}{\it\xi}^{\prime }\hspace{2.22198pt}\frac{R_{U}}{U_{0}^{3}}D_{k_{r}}\,\text{d}{\it\xi}^{\prime }\quad \text{with}~D_{k_{r}}=-\frac{1}{r}\hspace{2.22198pt}\frac{\text{d}(r\hspace{2.22198pt}\overline{kv})}{\text{d}r}.\end{eqnarray}$$
The integrand (
 $D={\it\xi}\hspace{2.22198pt}D_{k_{r}}R_{U}/U_{0}^{3}$
) in (5.3) is defined with the radial turbulent diffusion
 $D_{k_{r}}$
, which is the radial part of
 $D_{k}$
expressed in (5.2). Upon integrating across the whole jet (
 ${\it\xi}\rightarrow \infty$
), one obtains
 $I_{D}=0$
, which means that the integral of the radial flux of
 $k$
across the jet has to be zero. It is usual to verify the validity of the estimate of the turbulent diffusion
 $D_{k}$
by checking that (5.3) amounts to zero when
 ${\it\xi}\rightarrow \infty$
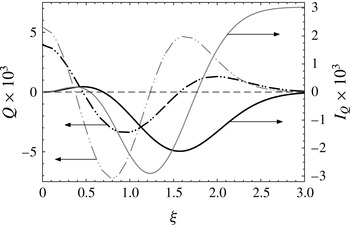
(PL and Wygnanski & Fiedler Reference Wygnanski and Fiedler1969). This integral test is also used to assess, in part, the accuracy of the budget balance. Figure 14 indicates that PL’s data and the present study both verify that (5.3) amounts to zero across the jet.
Integral of the radial turbulent diffusive flux, where the present LDV data (black lines) are compared with the results of PL (grey lines): profile of the integrand
 $D$
of (5.3) (— ⋅ ⋅ —) and the running integral
 $I_{D}=-{\it\xi}\hspace{2.22198pt}\overline{kv}/U_{0}^{3}$
(——).

The integral (5.3) is simple to calculate and yields a very succinct expression as shown in (5.4) below. Expressed in this way, it becomes obvious that the integral requirement
 $I_{D}=0$
does not constitute a sufficient test of the validity of
 $D_{k}$
, because it relies only on the fact that
 $\overline{kv}$
has to be zero at the jet boundary. This requirement is always satisfied in a free jet, even with a bad estimate of
 $D_{k}$
.
 $$\begin{eqnarray}I_{D}=-{\it\xi}\frac{\overline{kv}}{U_{0}^{3}}.\end{eqnarray}$$
On the other hand, the integral test
 $I_{D}=0$
using (5.3) can be very useful in specific cases. When
 $D_{k}$
is inferred from the closing term of the
 $k$
budget (instead of being directly evaluated from the divergence of the measured third-order moments), the integral test becomes more relevant. The integral test used in this way will be applied in the next paragraph to check the validity of the pressure diffusion term
 ${\it\Pi}_{k}$
reported by HCG.
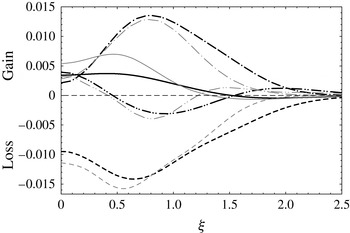
The comparison of the present budget and the one found by HCG is presented in figure 15. Despite the similarity in the means of measurement and the closeness in Reynolds numbers, the budget found by HCG bears little similarity to the present one. Some differences are noticeable when comparing the dissipation and pressure diffusion terms for
 ${\it\xi}<1$
. Also, the centreline value of the turbulent diffusion term found by HCG is negative. As mentioned in § 1, HCG’s LDV estimates of the third-order moments were affected by a relatively large scatter (i.e.
 $\overline{u^{3}}$
,
 $\overline{uw^{2}}$
and
 $\overline{v^{3}}$
profiles and, near the centreline,
 $\overline{uv^{2}}$
). Moreover, just as in PL, the assumption
 $\overline{v^{3}}=\overline{vw^{2}}$
was made. All these elements may cast some doubt on the accuracy of their
 $D_{k}$
estimate. However, since the main differences between the present results and HCG’s budget are those relating to the
 ${\it\Pi}_{k}$
and
 ${\it\epsilon}_{k}$
profiles, the following analysis focuses on these two terms.
Budget of turbulent kinetic energy normalized by
 $U_{0}^{3}/R_{U}$
, where the present LDV data (black lines) are compared with the results of HCG (grey lines): convection (——), production (— ⋅ —), turbulent diffusion (— ⋅ ⋅ —), pressure diffusion (
 ${-}\,\cdot \,{-}$
) and dissipation (– – – –) terms.

In the case of HCG’s budget, the value for the dissipation term was found through direct measurements and the local axisymmetry assumption, as reported in George & Hussein (Reference George and Hussein1991). The closing balance of the budget is therefore the pressure diffusion, which appears to be nearly equal to the turbulent convection term on the jet centreline. In this region, the present results for pressure diffusion and dissipation are remarkably different from those reported by HCG. Bogey & Bailly (Reference Bogey and Bailly2009) made the same observation based on their LES results. On the jet centreline, compared to HCG’s results, they found a pressure diffusion term that was five times smaller and a dissipation term that was two times smaller. Considering this level of discrepancy between their simulation and HCG’s results, they questioned the validity of the local axisymmetry assumption used to estimate the dissipation term and, consequently, the pressure diffusion, which is the balancing term of HCG’s budget. Bogey & Bailly (Reference Bogey and Bailly2009) also argued that the pressure diffusion would not be so dominant on the jet axis at high Reynolds number.
Again, as previously stated, the volume integral of the transport terms across the jet has to be zero. Therefore, neglecting the streamwise gradients, the integral of the radial transport by pressure fluctuation has to amount to zero across the jet (
 $I_{{\it\Pi}}=0$
for
 ${\it\xi}\rightarrow \infty$
). This integral is defined as
 $$\begin{eqnarray}I_{{\it\Pi}}=\int _{0}^{{\it\xi}}{\it\xi}^{\prime }\hspace{2.22198pt}\frac{R_{U}}{U_{0}^{3}}{\it\Pi}_{k_{r}}\,\text{d}{\it\xi}^{\prime }\quad \text{with}~{\it\Pi}_{k_{r}}=-\frac{1}{{\it\rho}}\hspace{2.22198pt}\frac{1}{r}\hspace{2.22198pt}\frac{\text{d}(r\hspace{2.22198pt}\overline{pv})}{\text{d}r}.\end{eqnarray}$$
For the present results, the pressure diffusion is estimated by following Lumley’s model (
 $\overline{pv}/{\it\rho}=-2\overline{kv}/5$
). Thus, as the integral requirement for
 $D_{k}$
, i.e. (5.3), has already been confirmed (figure 14), the integral requirement for
 ${\it\Pi}_{k}$
is consequently verified (figure 16). Moreover, the
 ${\it\Pi}_{k}$
profile inferred from the balance of the
 $k$
budget reported by HCG almost satisfies (5.5). Actually, if one extrapolates the
 $I_{{\it\Pi}}$
profile to larger
 ${\it\xi}$
values, it is clear that their estimate tends towards zero. It is worth mentioning that although the pressure diffusion term reported by HCG was probably overestimated in the centreline region (
 ${\it\xi}\rightarrow 0$
), this bias had practically no influence on the integral test
 $I_{{\it\Pi}}=0$
for
 ${\it\xi}\rightarrow \infty$
. As mentioned earlier, the fact that the integral test amounts to zero across the jet does not guarantee the accuracy of the flux term under investigation. This test is rather useful when the integral does not amount to zero; in that particular case, one can conclude that the estimate of the flux term under investigation is inaccurate.
Integral of the radial pressure diffusive flux, where the present LDV data using Lumley’s model (black lines) are compared with HCG’s closing term of the
 $k$
budget (grey lines): profile of the integrand
 ${\it\Pi}$
in (5.5) (— ⋅ ⋅ —) and the running integral
 $I_{{\it\Pi}}$
(——).

To conclude this section, let us recall that all the
 $k$
budgets previously reported (PL, HCG and Wygnanski & Fiedler Reference Wygnanski and Fiedler1969) have exhibited a maximum value for the dissipation
 ${\it\epsilon}_{k}$
on the jet centreline. In contrast, the present measurements rather suggest a negative peak value at
 ${\it\xi}=0.5$
, near the maximum of
 $P_{k}$
,
 $\overline{uv}$
and
 $k$
. This question will be addressed in greater depth in § 5.3.
5.2. Budget of each component of the Reynolds stress tensor
The equations for the budget of the Reynolds stresses
 $\overline{u_{i}u_{j}}$
give insight into the redistribution mechanisms at play in forming the
 $k$
budget. For a statistically stationary, incompressible and mean axisymmetric flow, the four
 $\overline{u_{i}u_{j}}$
budget equations are presented in detail in § A.1.1. In (A 1)–(A 4), the seven terms of the
 $\overline{u_{i}u_{j}}$
budgets are referred to, respectively, as the convection by mean flow (
 $\unicode[STIX]{x1D60A}_{ij}$
), production rate tensor (
 $\unicode[STIX]{x1D617}_{ij}$
), pressure–rate-of-strain interactions (
 ${\it\Phi}_{ij}$
), transport by turbulent diffusion (
 $\unicode[STIX]{x1D60B}_{ij}$
), transport by pressure diffusion (
 ${\it\Pi}_{ij}$
), transport by molecular diffusion (
 $\unicode[STIX]{x1D614}_{ij}$
) and dissipation rate tensor (
 ${\it\epsilon}_{ij}$
). Each of these terms has indices indicating the component of the Reynolds stresses being considered.
The terms
 $\unicode[STIX]{x1D60A}_{ij}$
,
 $\unicode[STIX]{x1D617}_{ij}$
,
 $\unicode[STIX]{x1D60B}_{ij}$
and
 $\unicode[STIX]{x1D614}_{ij}$
are measured directly, while the dissipation (
 ${\it\epsilon}_{ij}$
) and pressure diffusion (
 ${\it\Pi}_{ij}$
) are estimated using standard models. The
 ${\it\epsilon}_{ij}$
tensor is estimated by following the usual assumption of local isotropy,
 ${\it\epsilon}_{ij}=(2{\it\epsilon}_{k}/3)\hspace{2.22198pt}{\it\delta}_{ij}$
, where
 ${\it\epsilon}_{k}$
is inferred from the balance of the
 $k$
budget. This local isotropy assumption is also supported by the LES results reported in Bogey & Bailly (Reference Bogey and Bailly2009). The
 ${\it\Pi}_{ij}$
term is estimated by using the pressure–velocity correlation model proposed by Lumley (Reference Lumley1978), and each component is expressed as
 $$\begin{eqnarray}{\it\Pi}_{uu}=\frac{4}{5}\,\frac{\partial \overline{ku}}{\partial x},\quad {\it\Pi}_{vv}=\frac{4}{5}\,\frac{\partial \overline{kv}}{\partial r},\quad {\it\Pi}_{ww}=\frac{4}{5}\,\overline{\frac{kv}{r}},\quad {\it\Pi}_{uv}=\frac{2}{5}\left(\frac{\partial \overline{kv}}{\partial x}+\frac{\partial \overline{ku}}{\partial r}\right),\end{eqnarray}$$
where
 $\overline{ku_{i}}\equiv \overline{(u^{2}+v^{2}+w^{2})u_{i}}/2$
.
The last term of the
 $\overline{u_{i}u_{j}}$
budget which is not directly measured stands for pressure–rate-of-strain interactions (
 ${\it\Phi}_{ij}$
). This crucial term involved in Reynolds stress turbulence modelling is also referred to as the redistribution term, because it does not contribute to the change in
 $k$
but rather redistributes the turbulent energy among the normal stresses;
 ${\it\Phi}_{ij}$
is inferred from the balance of the
 $\overline{u_{i}u_{j}}$
budget.
As mentioned, the molecular diffusion term (
 $\unicode[STIX]{x1D614}_{ij}$
) is measured directly, but similarly to the case of the
 $k$
budget,
 $\unicode[STIX]{x1D614}_{ij}$
could be neglected under the high-Reynolds-number assumption. Thus, the molecular diffusion term will not be included in our analysis of the
 $\overline{u_{i}u_{j}}$
budgets.
The final dimensional forms of the
 $\overline{u_{i}u_{j}}$
budgets, including Lumley’s model for
 ${\it\Pi}_{ij}$
, are as follows.
 $\overline{u^{2}}$
budget:
 $$\begin{eqnarray}\displaystyle 0 & = & \displaystyle \underbrace{-\!\left(\overline{U}\frac{\partial \overline{u^{2}}}{\partial x}+\overline{V}\frac{\partial \overline{u^{2}}}{\partial r}\right)}_{C_{uu}}\underbrace{-\,2\vphantom{\Bigg|}\left(\overline{u^{2}}\frac{\partial \overline{U}}{\partial x}+\overline{uv}\frac{\partial \overline{U}}{\partial r}\right)}_{P_{uu}}+\underbrace{\vphantom{\Bigg|}2\,\overline{\frac{p}{{\it\rho}}\frac{\partial u}{\partial x}}}_{{\it\Phi}_{uu}\,(balance)}\nonumber\\ \displaystyle & & \displaystyle \underbrace{-\left(\frac{\partial \overline{u^{3}}}{\partial x}+\frac{1}{r}\frac{\partial r\overline{u^{2}v}}{\partial r}\right)}_{D_{uu}}+\underbrace{\frac{4}{5}\vphantom{\Bigg|}\frac{\partial \overline{ku}}{\partial x}}_{{\it\Pi}_{uu}\,(model)}-\underbrace{\phantom{\Bigg|}\frac{2}{3}{\it\epsilon}_{k}}_{(iso.\,model)}.\end{eqnarray}$$
 $\overline{v^{2}}$
budget:
 $$\begin{eqnarray}\displaystyle 0 & = & \displaystyle \underbrace{-\!\left(\overline{U}\frac{\partial \overline{v^{2}}}{\partial x}+\overline{V}\frac{\partial \overline{v^{2}}}{\partial r}\right)}_{C_{vv}}\underbrace{-\,2\phantom{\Bigg|}\left(\overline{uv}\frac{\partial \overline{V}}{\partial x}+\overline{v^{2}}\frac{\partial \overline{V}}{\partial r}\right)}_{P_{vv}}+\underbrace{2\,\phantom{\Bigg|}\overline{\frac{p}{{\it\rho}}\frac{\partial v}{\partial r}}}_{{\it\Phi}_{vv}\,(balance)}\nonumber\\ \displaystyle & & \displaystyle \underbrace{-\left(\frac{\partial \overline{uv^{2}}}{\partial x}+\frac{1}{r}\frac{\partial r\overline{v^{3}}}{\partial r}-2\frac{\overline{vw^{2}}}{r}\right)}_{D_{vv}}+\underbrace{\frac{4}{5}\phantom{\Bigg|}\frac{\partial \overline{kv}}{\partial r}}_{{\it\Pi}_{vv}\,(model)}-\underbrace{\phantom{\Bigg|}\frac{2}{3}{\it\epsilon}_{k}}_{(iso.\,model)}.\end{eqnarray}$$
 $\overline{w^{2}}$
budget:
 $$\begin{eqnarray}\displaystyle 0 & = & \displaystyle \underbrace{-\left(\overline{U}\frac{\partial \overline{w^{2}}}{\partial x}+\overline{V}\frac{\partial \overline{w^{2}}}{\partial r}\right)}_{C_{ww}}\underbrace{-\,2\phantom{\Bigg|}\frac{\overline{V}\;\overline{w^{2}}}{r}}_{P_{ww}}+\underbrace{2\,\phantom{\Bigg|}\overline{\frac{p}{{\it\rho}}\left(\frac{1}{r}\frac{\partial w}{\partial {\it\varphi}}+\frac{v}{r}\right)}}_{{\it\Phi}_{ww}\,(balance)}\nonumber\\ \displaystyle & & \displaystyle \underbrace{-\left(\frac{\partial \overline{uw^{2}}}{\partial x}+\frac{1}{r}\frac{\partial r\overline{vw^{2}}}{\partial r}+2\frac{\overline{vw^{2}}}{r}\right)}_{D_{ww}}+\underbrace{\frac{4}{5}\,\phantom{\Bigg|}\overline{\frac{kv}{r}}}_{{\it\Pi}_{ww}\,(model)}-\underbrace{\phantom{\Bigg|}\frac{2}{3}{\it\epsilon}_{k}}_{(iso.\,model)}.\end{eqnarray}$$
 $\overline{uv}$
budget:
 $$\begin{eqnarray}\displaystyle 0 & = & \displaystyle \underbrace{-\!\phantom{\Bigg|}\left(\overline{U}\frac{\partial \overline{uv}}{\partial x}+\overline{V}\frac{\partial \overline{uv}}{\partial r}\right)}_{C_{uv}}\underbrace{-\phantom{\Bigg|}\left(\overline{uv}\frac{\partial \overline{U}}{\partial x}+\overline{v^{2}}\frac{\partial \overline{U}}{\partial r}+\overline{u^{2}}\frac{\partial \overline{V}}{\partial x}+\overline{uv}\frac{\partial \overline{V}}{\partial r}\right)}_{P_{uv}}\nonumber\\ \displaystyle & & \displaystyle +\,\underbrace{\phantom{\Bigg|}\overline{\frac{p}{{\it\rho}}\left(\frac{\partial v}{\partial x}+\frac{\partial u}{\partial r}\right)}}_{{\it\Phi}_{uv}\,(balance)}\underbrace{-\left(\frac{\partial \overline{u^{2}v}}{\partial x}+\frac{1}{r}\frac{\partial r\overline{uv^{2}}}{\partial r}-\frac{\overline{uw^{2}}}{r}\right)}_{D_{uv}}+\underbrace{\phantom{\Bigg|}\frac{2}{5}\left(\frac{\partial \overline{kv}}{\partial x}+\frac{\partial \overline{ku}}{\partial r}\right)}_{{\it\Pi}_{uv}\,(model)}.\quad\end{eqnarray}$$
Details regarding normalization and the self-preserving forms of these terms are given in § A.2.2. The
 $\overline{u_{i}u_{j}}$
budgets are presented in figure 17 together with those reported by PL. A few general observations can be made about the results presented in these figures.
-
(i) The convection terms of the normal components are roughly equal. In fact, the magnitude of each term is a reflection of the relative value of the associated Reynolds stress.
-
(ii) As described in § A.1.1, under the assumption of local isotropy,
${\it\epsilon}_{k}$
found as the closing balance of the
$k$
budget is equally divided in the budget of the normal components. A similar strategy was adopted by PL and was later validated by Bogey & Bailly (Reference Bogey and Bailly2009). The closing balance of the component budgets is then equal to the pressure–strain redistribution term,
${\it\Phi}_{ij}$
. The present data show that energy produced by
$\overline{u^{2}}$
is redistributed approximately equally among
$\overline{v^{2}}$
and
$\overline{w^{2}}$
. -
(iii) The production terms
$P_{uu}$
and
$P_{uv}$
together with the pressure–strain terms
${\it\Phi}_{vv}$
and
${\it\Phi}_{ww}$
are the dominant source terms. -
(iv) The dissipation terms
${\it\epsilon}_{uu}$
,
${\it\epsilon}_{vv}$
and
${\it\epsilon}_{ww}$
together with the pressure–strain terms
${\it\Phi}_{uu}$
and
${\it\Phi}_{uv}$
are the dominant sink terms.


Budget of each component of the Reynolds stress tensor normalized by
 $U_{0}^{3}/R_{U}$
, where the present LDV data (black lines) are compared with the results of PL (grey lines): (a) budget of
 $\overline{u^{2}}$
; (b) budget of
 $\overline{v^{2}}$
; (c) budget of
 $\overline{w^{2}}$
; (d) budget of
 $\overline{uv}$
. Plotted are the convection (——), production (— ⋅ —), turbulent diffusion (— ⋅ ⋅ —), pressure diffusion (
 ${-}\,\cdot \,{-}$
), dissipation (– – – –) and pressure–strain (— — —) terms.

5.2.1. Discussion on
$P_{vv}$
reported by PL

Overall, the present Reynolds stress budgets compare relatively well with those reported by PL. However, some differences are observed and these require detailed examination. One of the more noticeable discrepancies is related to the production term
 $P_{vv}$
of the
 $\overline{v^{2}}$
transport budget; unfortunately, PL apparently neglected this term (see Panchapakesan & Lumley Reference Panchapakesan and Lumley1993a
, p. 214, figure 17). This is easily seen by analysing the production terms of the
 $\overline{v^{2}}$
and
 $\overline{w^{2}}$
transport equations (5.8) and (5.9) taken on the jet centreline. Considering
 $\overline{uv}=0$
and
 $\overline{V}=0$
for
 $r=0$
and using l’Hôpital’s rule, these production terms can be written as
 $$\begin{eqnarray}\displaystyle & \displaystyle P_{vv}=-2\hspace{2.22198pt}\left(\overline{uv}\frac{\partial \overline{V}}{\partial x}+\overline{v^{2}}\frac{\partial \overline{V}}{\partial r}\right)\;\Longrightarrow \;P_{vv}\big|_{r=0}=\left.-2\hspace{2.22198pt}\overline{v^{2}}\frac{\partial \overline{V}}{\partial r}\right|_{r=0}, & \displaystyle\end{eqnarray}$$
 $$\begin{eqnarray}\displaystyle & \displaystyle P_{ww}=-2\hspace{2.22198pt}\overline{w^{2}}\frac{\overline{V}}{r}\;\Longrightarrow \;P_{ww}\big|_{r=0}=\left.-2\hspace{2.22198pt}\overline{w^{2}}\frac{\partial \overline{V}}{\partial r}\right|_{r=0}. & \displaystyle\end{eqnarray}$$
Knowing that on the jet centreline
 $\overline{v^{2}}\equiv \overline{w^{2}}$
, (5.11) and (5.12) allow us to write the specific condition
 $$\begin{eqnarray}P_{vv}\big|_{r=0}\equiv P_{ww}\big|_{r=0}.\end{eqnarray}$$
Figure 17 shows that the present data are in agreement with the criterion expressed by (5.13). However, this specific condition is far from being fulfilled by PL’s data; so either
 $P_{vv}$
or
 $P_{ww}$
was miscalculated. Using PL’s results for
 $\overline{V}$
,
 $\overline{v^{2}}$
,
 $\overline{uv}$
and
 $B_{R_{U}}$
in (5.14) below, which represents the normalized and self-preserving form of the production term for
 $\overline{v^{2}}$
, it can be verified that their estimate for
 $P_{vv}$
was miscalculated:
 $$\begin{eqnarray}P_{vv}\hspace{2.22198pt}\frac{R_{U}}{U_{0}^{3}}=2B_{R_{U}}\frac{\overline{uv}}{U_{0}^{2}}\left[\frac{\overline{V}}{U_{0}}+{\it\xi}\frac{\text{d}}{\text{d}{\it\xi}}\left(\frac{\overline{V}}{U_{0}}\right)\right]-2\hspace{2.22198pt}\frac{\overline{v^{2}}}{U_{0}^{2}}\hspace{2.22198pt}\frac{\text{d}}{\text{d}{\it\xi}}\left(\frac{\overline{V}}{U_{0}}\right).\end{eqnarray}$$
Figure 18(a) shows that the corrected profile of
 $P_{vv}$
obtained from PL’s data is in close agreement with the present results. This correction has an impact in many ways, since there are different connections with other terms. Firstly,
 $P_{vv}$
has a direct influence on the pressure–strain estimate
 ${\it\Phi}_{vv}$
, the closing term of the
 $\overline{v^{2}}$
budget. Secondly, as PL’s data verify that
 $P_{k}\equiv (P_{uu}+P_{vv}+P_{ww})/2$
, a miscalculated value of
 $P_{vv}$
has a direct influence on the estimate for
 $P_{k}$
. Consequently, the value of
 ${\it\epsilon}_{k}$
is indirectly affected by the bias on
 $P_{vv}$
, since the dissipation term is obtained as the closing balance of the
 $k$
budget reported by PL. Finally, the bias induced on the evaluation of
 ${\it\epsilon}_{k}$
affects
 ${\it\epsilon}_{vv}$
through the assumption of local isotropy used for the dissipative terms. Thus, only for the
 $\overline{v^{2}}$
budget, a bias on
 $P_{vv}$
induces a bias on
 ${\it\epsilon}_{vv}$
and on the closing term
 ${\it\Phi}_{vv}$
. There is also an impact on the values of
 ${\it\Phi}_{uu}$
and
 ${\it\Phi}_{ww}$
(through
 ${\it\epsilon}_{k}$
), but this effect is less important. Figure 18 shows the corrected profiles of
 $P_{vv}$
,
 ${\it\Phi}_{vv}$
(panel a),
 $P_{k}$
and
 ${\it\epsilon}_{k}$
(panel b) recalculated with PL’s data. The agreement with the present results is now better than what was observed with the uncorrected PL data. The agreement between the present
 $P_{k}$
profile and PL’s corrected one is almost perfect. The only noticeable discrepancy is for
 ${\it\epsilon}_{k}$
in the region
 $0\leqslant {\it\xi}\leqslant 1$
. This behaviour is expected, however, because, as already discussed in § 5.1, this region is also influenced by the pressure diffusion term
 ${\it\Pi}_{k}$
, which was neglected by PL. In the external part, where the pressure diffusion term is negligible, the agreement between the present and corrected PL profiles for
 ${\it\epsilon}_{k}$
is almost perfect. For the
 $\overline{v^{2}}$
budget, the differences between PL’s corrected and uncorrected profiles for
 $P_{vv}$
and
 ${\it\Phi}_{vv}$
are also remarkable (see figures 17
b and 18
a).
Impact of
 $P_{vv}$
correction on some terms of the budgets reported by PL (all terms are normalized by
 $U_{0}^{3}/R_{U}$
), where the present LDV data (black lines) are compared with the corrected PL results (grey lines): (a) production
 $P_{vv}$
(— ⋅ —) and pressure–strain
 ${\it\Phi}_{vv}$
(— — —) terms of the
 $\overline{v^{2}}$
budget; (b) production
 $P_{k}$
(— ⋅ —) and dissipation
 ${\it\epsilon}_{k}$
(– – – –) terms of the
 $k$
budget.

5.2.2. Discussion on the evaluation of the turbulent diffusion
Another difference between PL’s results and the present data relates to the turbulent diffusion terms. In the present case, having a reliable estimate of
 $\overline{vw^{2}}$
leads to the inference of turbulent diffusion profiles
 $D_{vv}$
and
 $D_{ww}$
that are quite different from those reported by PL and HCG. Near the jet centreline, the assumption of
 $\overline{v^{3}}=\overline{vw^{2}}$
made by PL and HCG gave an underestimate of
 $D_{vv}$
and, oppositely, an overestimate of
 $D_{ww}$
when compared with the present measurements. This discrepancy was also pointed out by Bogey & Bailly (Reference Bogey and Bailly2009) based on their LES results. Interestingly, the sum of these two terms resulted in a value for
 $D_{k}$
that is not too affected by the use of this surrogate. This explains why the present profile of
 $D_{k}$
compares well with the data reported by PL (figure 13). To simplify this analysis, we take a closer look at the diffusion terms on the jet centreline. Application of l’Hôpital’s rule yields the following expressions for
 $D_{vv}|_{r=0}$
and
 $D_{ww}|_{r=0}$
:
 $$\begin{eqnarray}\displaystyle & \displaystyle D_{vv}\big|_{r=0}=\left.-\frac{\partial \overline{uv^{2}}}{\partial x}\right|_{r=0}-\left.2\frac{\partial \overline{v^{3}}}{\partial r}\right|_{r=0}+\left.2\frac{\partial \overline{vw^{2}}}{\partial r}\right|_{r=0}, & \displaystyle\end{eqnarray}$$
 $$\begin{eqnarray}\displaystyle & \displaystyle D_{ww}\big|_{r=0}=\left.-\frac{\partial \overline{uw^{2}}}{\partial x}\right|_{r=0}-\left.4\frac{\partial \overline{vw^{2}}}{\partial r}\right|_{r=0}. & \displaystyle\end{eqnarray}$$
 $\overline{v^{3}}=\overline{vw^{2}}$
and neglecting the streamwise derivatives yields
 $D_{vv}\simeq 0$
and
 $D_{ww}\simeq -4\;\partial \overline{vw^{2}}/\partial r|_{r=0}\simeq -4\;\partial \overline{v^{3}}/\partial r|_{r=0}$
(as also pointed out by PL). However, the present measurements (figures 7 and 8) indicate that the centreline derivative of
 $\overline{v^{3}}$
is about three times larger than that found with
 $\overline{vw^{2}}$
. This observation is also supported by the LES results of Bogey & Bailly (Reference Bogey and Bailly2009). Applying an exact factor of three to (5.15) and (5.16) results in
 $D_{vv}=D_{ww}=1.33\hspace{2.22198pt}\partial \overline{v^{3}}/\partial r|_{r=0}$
on the jet centreline. This indicates that, on the jet axis, the turbulent diffusion terms of the
 $\overline{v^{2}}$
and
 $\overline{w^{2}}$
budgets are nearly equal, as confirmed by the data shown in figure 17. Thus, as shown by PL’s results, the use of the aforementioned surrogate for
 $\overline{vw^{2}}$
clearly yields an underestimate of
 $D_{vv}$
and an overestimate of
 $D_{ww}$
in the centreline region. The consequence of this surrogacy is an underestimation of
 ${\it\Phi}_{vv}$
and an overestimation of
 ${\it\Phi}_{ww}$
for PL’s data near the centreline. This assertion is supported by the present
 ${\it\Phi}_{vv}$
and
 ${\it\Phi}_{ww}$
profiles shown in figure 17.
To conclude this section, we emphasize the fact that the present
 $\overline{u_{i}u_{j}}$
budgets compare well with those reported by PL. However, PL’s results are affected by miscalculated values of
 $P_{vv}$
and by the use of a surrogate for the third-order correlation
 $\overline{vw^{2}}$
. When this bias and use of the surrogate are taken into account, PL’s budgets agree even better with the present ones.
5.3. Discussion on the
${\it\epsilon}_{k}$
estimates

In § 5.1, the dissipation rate estimates reported by PL and HCG are compared with the present values. It is worth recalling that these
 ${\it\epsilon}_{k}$
estimates are all obtained using different hypotheses: in the present case,
 ${\it\epsilon}_{k}$
is inferred from the
 $k$
budget in which the pressure diffusion term
 ${\it\Pi}_{k}$
is obtained from Lumley’s model; in PL,
 ${\it\epsilon}_{k}$
was inferred by balancing the
 $k$
budget in which the pressure diffusion term
 ${\it\Pi}_{k}$
was neglected; in HCG,
 ${\it\epsilon}_{k}$
was found from direct measurements under the local axisymmetry assumption.
For comparison purposes, the
 $k$
budgets (only
 $C_{k}$
,
 $P_{k}$
and
 $D_{k}$
) reported by PL and HCG are used to infer new radial profiles of
 ${\it\epsilon}_{k}$
. First, for both PL and HCG, the pressure diffusion term (
 ${\it\Pi}_{k}$
) is obtained using Lumley’s model. Second, PL’s production term is corrected following the discussion presented in § 5.2. Third,
 ${\it\epsilon}_{k}$
is inferred by balancing these modified
 $k$
budgets. Then, three radial profiles of
 ${\it\epsilon}_{k}$
, all inferred in the same way, are presented in figure 19. The dissipation rates found for PL and HCG almost fall within the margins of uncertainty of the present experiment. The three profiles exhibit the same behaviour, with an off-axis peak value located at
 ${\it\xi}\simeq 0.5$
.
Radial distributions of the normalized dissipation rate,
 ${\it\epsilon}_{k}R_{U}/U_{0}^{3}$
, assumed as the remainder of the
 $k$
budget in which pressure diffusion is estimated using Lumley’s model: the present profile (black dashed line) is compared with radial distributions calculated using the data of PL after correction (grey short-dashed line) and of HCG (grey long-dashed line); the symbols on the
 ${\it\xi}=0$
axis are the centreline values found using (5.18) derived from Thiesset, Antonia & Djenidi (Reference Thiesset, Antonia and Djenidi2014).

The centreline value of the dissipation rate can be further analysed. Using a classical self-similarity analysis in the far field of a turbulent round jet (see e.g. Landau & Lifshitz Reference Landau and Lifshitz1959; Friehe, Van Atta & Gibson Reference Friehe, Van Atta and Gibson1972), the streamwise evolution of
 ${\it\epsilon}_{k}$
on the centreline can be expressed as a
 $(-4)$
th power law,
 $$\begin{eqnarray}\left.\frac{{\it\epsilon}_{k}D}{U_{j}^{3}}\right|_{{\it\xi}=0}=A_{{\it\epsilon}_{k}}\left(\frac{x-x_{0}}{D}\right)^{-4}.\end{eqnarray}$$
For the round jet centreline, under the assumptions of local isotropy and complete self-preservation, Thiesset et al. (Reference Thiesset, Antonia and Djenidi2014) recently performed a two-point similarity analysis, establishing an exact expression for the
 $A_{{\it\epsilon}_{k}}$
prefactor. By using the expressions for the evolution of the centreline mean streamwise velocity and jet half-width presented in § A.2.1, together with the expression for the prefactor
 $A_{{\it\epsilon}_{k}}$
reported by Thiesset et al. (Reference Thiesset, Antonia and Djenidi2014), (5.17) allows the self-preserving form of
 ${\it\epsilon}_{k}$
to be rewritten as
 $$\begin{eqnarray}\left.\frac{{\it\epsilon}_{k}R_{U}}{U_{0}^{3}}\right|_{{\it\xi}=0}=\left.B_{R_{U}}\hspace{2.22198pt}{\it\beta}_{U}\hspace{2.22198pt}\frac{\overline{u^{2}}}{U_{0}^{2}}\hspace{2.22198pt}\left(\hspace{2.22198pt}2+\frac{\overline{v^{2}}}{\overline{u^{2}}}\hspace{2.22198pt}\right)\right|_{{\it\xi}=0}.\end{eqnarray}$$
Expression (5.18) can now be used to test the centreline value of the dissipation rate inferred from the budget of
 $k$
. The values plotted for
 ${\it\xi}=0$
in figure 19 are listed in table 2.
Estimates of the normalized dissipation rate on the jet centreline; ‘from budget’ means that
 ${\it\epsilon}_{k}$
is inferred as the remainder of the
 $k$
budget in which the pressure diffusion is obtained using Lumley’s model; ‘from (5.18)’ means that
 ${\it\epsilon}_{k}$
is evaluated using the equation derived from Thiesset et al. (Reference Thiesset, Antonia and Djenidi2014).

Inserting the present measurements of
 $\overline{u^{2}}/U_{0}^{2}$
and
 $\overline{v^{2}}/U_{0}^{2}$
together with the values of
 $B_{R_{U}}$
and
 ${\it\beta}_{U}$
into (5.18) yields a dissipation rate estimate that is only 2.6 % below the centreline value inferred from the
 $k$
budget, well within the margins of uncertainty. This check can also be done with the PL and HCG datasets. Using their centreline measurements for
 $\overline{u^{2}}/U_{0}^{2}$
and
 $\overline{v^{2}}/U_{0}^{2}$
together with their reported value of
 $B_{R_{U}}$
(
 ${\it\beta}_{U}=1$
in their case), (5.18) yields dissipation rate estimates that are, for PL and HCG respectively,
 $+0.4\,\%$
and
 $+1.4\,\%$
higher than their
 $k$
budget remainders.
The good agreement between the present data, the results of PL and HCG and their corresponding outcomes from (5.18) supports the validity of the process used to infer
 ${\it\epsilon}_{k}$
as the remainder of the
 $k$
budget. Also, and more importantly, it suggests that, despite an often significant level of discrepancy between the data reported by PL and HCG, these differences could possibly be attributed to factors that have no direct connection to the measurement procedure per se. In fact, the results presented in figure 19 suggest a relationship between the initial conditions (to
 $\mathit{Re}_{{\it\lambda}}$
for example) and the values reported, rather than a mere measurement bias.
5.4. Budget of
$\overline{{\it\theta}^{2}}/2$

The equation for the budget of
 $\overline{{\it\theta}^{2}}/2$
, for an incompressible and mean axisymmetric flow, is presented in detail in § A.1.3. In the budget equation (A 10), the terms
 $C_{{\it\theta}}$
,
 $P_{{\it\theta}}$
,
 $D_{{\it\theta}}$
,
 $M_{{\it\theta}}$
and
 ${\it\epsilon}_{{\it\theta}}$
stand for the mean flow convection, production rate, transport by turbulent diffusion, transport by molecular diffusion and dissipation rate, respectively. The first four terms are measured directly, and the dissipation rate
 ${\it\epsilon}_{{\it\theta}}$
is inferred from balance of the budget.
With
 ${\it\alpha}$
being the molecular diffusivity of air, an order-of-magnitude analysis, conducted under the assumption of high Reynolds number, indicates that the molecular diffusion term
 $M_{{\it\theta}}$
can be neglected. As already mentioned in the case of
 $k$
and
 $\overline{u_{i}u_{j}}$
budgets, direct measurement of this term confirms the validity of this assumption, since
 $M_{{\it\theta}}$
is about four orders of magnitude smaller than the main terms of the budget. Thus, the molecular diffusion term
 $M_{{\it\theta}}$
will not be included in the present analysis. The final dimensional form of this budget is
 $$\begin{eqnarray}\displaystyle 0 & = & \displaystyle \underbrace{-\!\left[\overline{U}\frac{\partial (\,\overline{{\it\theta}^{2}}/2\,)}{\partial x}+\overline{V}\frac{\partial (\,\overline{{\it\theta}^{2}}/2\,)}{\partial r}\right]}_{C_{{\it\theta}}}\hspace{2.22198pt}\underbrace{-\left[\vphantom{\frac{\partial (\,\overline{{\it\theta}^{2}}/2\,)}{\partial x}}\overline{u{\it\theta}}\frac{\partial \overline{{\it\Theta}}}{\partial x}+\overline{v{\it\theta}}\frac{\partial \overline{{\it\Theta}}}{\partial r}\right]}_{P_{{\it\theta}}}\nonumber\\ \displaystyle & & \displaystyle \underbrace{-\frac{1}{2}\left(\frac{\partial \overline{u{\it\theta}^{2}}}{\partial x}+\frac{1}{r}\frac{\partial r(\,\overline{v{\it\theta}^{2}}\,)}{\partial r}\right)}_{D_{{\it\theta}}}-\underbrace{\vphantom{\Bigg|}{\it\epsilon}_{{\it\theta}}}_{(balance)}.\end{eqnarray}$$
The normalized, self-preserving form of the terms involved in (5.19) is presented in § A.2.3. Similar to the case of the
 $k$
and
 $\overline{u_{i}u_{j}}$
budgets, the radial profiles appearing in (5.19) have been obtained through numerical regressions of the present data using the mathematical expression given in HCG.
The present
 $\overline{{\it\theta}^{2}}/2$
budget is depicted in figure 20 together with the data reported in AM. In their case, the temperature dissipation
 ${\it\epsilon}_{{\it\theta}}$
was obtained by direct measurement and the turbulent diffusion term
 $D_{{\it\theta}}$
was inferred by the difference.
Budget of
 $\overline{{\it\theta}^{2}}/2$
normalized by
 $U_{0}{\it\Theta}_{0}^{2}/R_{U}$
, where the present LDV–CW data (black lines) are compared with the results of AM (grey lines): convection (——), production (— ⋅ —), turbulent diffusion (— ⋅ ⋅ —) and dissipation (– – – –) terms.

As seen in figure 20, the convection term
 $C_{{\it\theta}}$
seems to have a constant value up to
 ${\it\xi}=0.5$
. The uncertainty analysis of § 2.5 yields
 $C_{{\it\theta}}R_{U}/U_{0}{\it\Theta}_{0}^{2}=0.0034\pm 0.0002$
on the centreline. The convection term then decreases slowly and has a negative value in the outer part of the jet. The data reported by AM are slightly higher than the present values and exhibit a small bump around
 ${\it\xi}=1$
.
The production term
 $P_{{\it\theta}}$
obtained from the present measurements is larger than that reported by AM for the entire radial profile. The centreline value of
 $P_{{\it\theta}}$
(
 $0.0021\pm 0.0002$
) is exclusively related to the streamwise gradient of the mean temperature and to the centreline value of
 $\overline{u{\it\theta}}/U_{0}{\it\Theta}_{0}$
. AM neglected this streamwise contribution, and consequently their production term was zero on the jet centreline. Up to roughly
 ${\it\xi}=1$
, the discrepancy between the present production term and that of AM can then be attributed to this consideration. Further away from the jet centreline (
 ${\it\xi}>1$
), the present data indicate (not shown here) that the contribution of the streamwise gradient part to
 $P_{{\it\theta}}$
becomes vanishingly small. Thus, in the outer region, the difference between the present values of
 $P_{{\it\theta}}$
and those of AM can only be attributed to the profiles of
 $\overline{{\it\Theta}}$
and
 $\overline{v{\it\theta}}$
. In this region, discrepancies are observed between these measurement sets, as previously shown in figures 9(a) and 10(b).
As shown in Darisse et al. (Reference Darisse, Lemay and Benaïssa2014), the centreline value of the turbulent diffusion term
 $D_{{\it\theta}}$
depends almost exclusively on the radial first derivative of
 $\overline{v{\it\theta}^{2}}/U_{0}{\it\Theta}_{0}^{2}$
. This statement remains valid throughout almost the entire jet as the value of the streamwise part of
 $D_{{\it\theta}}$
stays about one order of magnitude smaller than its radial part. Similar to the case of the
 $k$
budget, the turbulent diffusion of temperature variance is expressed as the divergence of
 $\overline{{\it\theta}^{2}}/2$
fluxes (
 $\overline{u{\it\theta}^{2}}/2$
and
 $\overline{v{\it\theta}^{2}}/2$
). Thus, upon neglecting the streamwise gradient, the volume integral of the turbulent diffusion term reduces to
 $$\begin{eqnarray}I_{Q}=\int _{0}^{{\it\xi}}{\it\xi}^{\prime }\,\frac{R_{U}}{U_{0}{\it\Theta}_{0}^{2}}\,D_{{\it\theta}_{r}}\hspace{2.22198pt}\text{d}{\it\xi}^{\prime }\quad \text{with}~D_{{\it\theta}_{r}}=-\frac{1}{2r}\hspace{2.22198pt}\frac{\text{d}(r\hspace{2.22198pt}\overline{v{\it\theta}^{2}})}{\text{d}r}.\end{eqnarray}$$
The integrand
 $Q={\it\xi}\,D_{{\it\theta}_{r}}R_{U}/(U_{0}{\it\Theta}_{0}^{2})$
in (5.20) is defined with the radial turbulent diffusion
 $D_{{\it\theta}_{r}}$
, which is the radial part of
 $D_{{\it\theta}}$
in (5.19). Upon integrating across the whole jet (
 ${\it\xi}\rightarrow \infty$
), one obtains
 $I_{Q}=0$
, which means that the integral of the radial flux of
 $\overline{{\it\theta}^{2}}/2$
across the jet has to be zero. In the present case, the solution of the integral (5.20) is simply
 $I_{Q}=-{\it\xi}\hspace{2.22198pt}\overline{v{\it\theta}^{2}}/(2U_{0}{\it\Theta}_{0}^{2})$
. Figure 21 indicates that the present study verifies this integral criterion:
 $I_{Q}$
amounts to zero across the jet. However, AM’s turbulent diffusion profile, which is inferred from the closing term of their budget, does not satisfy the integral requirement. This point may raise the question of direct estimation of the temperature dissipation (see also Darisse et al.
Reference Darisse, Lemay and Benaïssa2014).
Integral of the radial turbulent diffusive flux, where the present LDV–CW data (black lines) are compared with the results of AM (grey lines): profile of the integrand
 $Q$
in (5.20) (— ⋅ ⋅ —) and the running integral
 $I_{Q}$
(——).

The temperature dissipation curve appearing in figure 20 is the closing balance of the present budget. Given the uncertainty in the centreline values of the convection and production contributions, and assuming an uncertainty of similar magnitude for the remaining terms, one obtains
 ${\it\epsilon}_{{\it\theta}}R_{U}/U_{0}{\it\Theta}_{0}^{2}=0.0095\pm 0.0004$
on the jet centreline. There is a significant dip around
 ${\it\xi}=0.65$
, which is a consequence of the bump in the production term. The dissipation reported by AM does not exhibit such an off-axis dip. As a consequence, the diffusion profile inferred by AM has to compensate by being much lower at that radial location. In spite of this, there is good agreement between the present dissipation data and the data of AM on the jet centreline and in its outer part.
The present
 $\overline{{\it\theta}^{2}}/2$
budget can also be compared with the scalar variance budget reported by Panchapakesan & Lumley (Reference Panchapakesan and Lumley1993b
) for a helium jet. As mentioned in § 4.5, the scalar in their case (helium concentration) is not entirely passive. However, the agreement between these two budgets is rather good. Radial profiles of production, turbulent diffusion and dissipation exhibit similar shapes and comparable magnitudes. In addition, their dissipation distribution displays a peak value at approximately
 ${\it\xi}=0.56$
, which is in good agreement with the present peak value observed at around
 ${\it\xi}=0.63$
.
Present budget of
 $\overline{{\it\theta}^{2}}/2$
normalized by
 $U_{0}{\it\Theta}_{0}^{2}/R_{U}$
(black lines) compared with the scalar variance budget reported by Panchapakesan & Lumley (Reference Panchapakesan and Lumley1993b
) for a helium jet (grey lines): convection (——), production (— ⋅ —), turbulent diffusion (— ⋅ ⋅ —) and dissipation (– – – –) terms.

5.5. Budget of turbulent heat fluxes
For a statistically stationary, incompressible and mean axisymmetric flow, the equations for the budget of the turbulent heat flux,
 $\overline{u_{i}{\it\theta}}$
, are presented in detail in § A.1.3. In the budget equations (A 11) and (A 12), the seven terms stand for the mean flow convection (
 $C_{i{\it\theta}}$
), production rate (
 $P_{i{\it\theta}}$
), pressure–temperature gradient correlation (
 ${\it\Phi}_{i{\it\theta}}$
), transport by turbulent diffusion (
 $D_{i{\it\theta}}$
), transport by pressure diffusion (
 ${\it\Pi}_{i{\it\theta}}$
), transport by molecular diffusion (
 $M_{i{\it\theta}}$
) and dissipation rate (
 ${\it\epsilon}_{i{\it\theta}}$
). Each of these terms is labelled with an index (
 $i=1$
for
 $u$
or
 $i=2$
for
 $v$
) that indicates the direction (streamwise or radial) of the heat flux being considered.
The terms
 $C_{i{\it\theta}}$
,
 $P_{i{\it\theta}}$
and
 $D_{i{\it\theta}}$
are measured directly. Similarly to the other budgets, the molecular diffusion term (
 $M_{i{\it\theta}}$
) can be neglected under the high-Reynolds-number assumption, and it will not be included in our analysis of the
 $\overline{u_{i}{\it\theta}}$
budgets. In § 5.2, local isotropy is assumed for the dissipation terms of the
 $\overline{u_{i}u_{j}}$
budgets (
 ${\it\epsilon}_{uu}={\it\epsilon}_{vv}={\it\epsilon}_{ww}$
and
 ${\it\epsilon}_{uv}=0$
). For the turbulent heat flux budgets, the same assumption allows us to consider
 ${\it\epsilon}_{u{\it\theta}}={\it\epsilon}_{v{\it\theta}}=0$
(see e.g. Launder Reference Launder1975; Ruffin et al.
Reference Ruffin, Schiestel, Anselmet, Amielh and Fulachier1994). The
 ${\it\Pi}_{i{\it\theta}}$
term is estimated by using the pressure diffusion model proposed by Lumley (Reference Lumley1978) and is expressed, for each component, as
 $$\begin{eqnarray}{\it\Pi}_{u{\it\theta}}=\frac{2}{5}\vphantom{\Bigg|}\frac{\partial \overline{k{\it\theta}}}{\partial x},\quad {\it\Pi}_{v{\it\theta}}=\frac{2}{5}\vphantom{\Bigg|}\frac{\partial \overline{kv}}{\partial r},\end{eqnarray}$$
where
 $\overline{k{\it\theta}}\equiv \overline{(u^{2}+v^{2}+w^{2}){\it\theta}}/2$
.
The last term of the
 $\overline{u_{i}{\it\theta}}$
budget which is not directly measured is the pressure–temperature gradient correlation or the pressure-scrambling vector,
 ${\rm\Phi}_{i{\it\theta}}$
. This crucial term involved in Reynolds stress turbulence modelling is inferred from the balance of the
 $\overline{u_{i}{\it\theta}}$
budget.
The final dimensional forms of the
 $\overline{u_{i}{\it\theta}}$
budgets, including Lumley’s model for
 ${\it\Pi}_{i{\it\theta}}$
and local isotropy for the dissipation terms, are given by the following two equations.
 $\overline{u{\it\theta}}$
budget:
 $$\begin{eqnarray}\displaystyle 0 & = & \displaystyle \underbrace{-\!\left[\;\overline{U}\frac{\partial \overline{u{\it\theta}}}{\partial x}+\overline{V}\frac{\partial \overline{u{\it\theta}}}{\partial r}\;\right]}_{C_{u{\it\theta}}}\;\underbrace{-\left[\hspace{2.22198pt}\left(\overline{u{\it\theta}}\frac{\partial \overline{U}}{\partial x}+\overline{v{\it\theta}}\frac{\partial \overline{U}}{\partial r}\right)+\hspace{2.22198pt}\left(\overline{u^{2}}\frac{\partial \overline{{\it\Theta}}}{\partial x}+\overline{uv}\frac{\partial \overline{{\it\Theta}}}{\partial r}\right)\hspace{2.22198pt}\right]}_{P_{u{\it\theta}}}\nonumber\\ \displaystyle & & \displaystyle +\,\underbrace{\overline{\frac{p}{{\it\rho}}\frac{\partial {\it\theta}}{\partial x}}\phantom{\Bigg|}}_{{\it\Phi}_{u{\it\theta}}\,(\mathit{balance})}\underbrace{-\left[\hspace{2.22198pt}\frac{\partial \overline{u^{2}{\it\theta}}}{\partial x}+\frac{1}{r}\frac{\partial r\overline{uv{\it\theta}}}{\partial r}\;\right]}_{D_{u{\it\theta}}}+\underbrace{\frac{2}{5}\frac{\partial \overline{k{\it\theta}}}{\partial x}\phantom{\Bigg|}}_{{\it\Pi}_{u{\it\theta}}\,(\mathit{model})}.\end{eqnarray}$$
 $\overline{v{\it\theta}}$
budget:
 $$\begin{eqnarray}\displaystyle 0 & = & \displaystyle \underbrace{-\!\left[\;\overline{U}\frac{\partial \overline{v{\it\theta}}}{\partial x}+\overline{V}\frac{\partial \overline{v{\it\theta}}}{\partial r}\;\right]}_{C_{v{\it\theta}}}\;\underbrace{-\left[\hspace{2.22198pt}\left(\hspace{2.22198pt}\overline{u{\it\theta}}\frac{\partial \overline{V}}{\partial x}+\overline{v{\it\theta}}\frac{\partial \overline{V}}{\partial r}\hspace{2.22198pt}\right)+\hspace{2.22198pt}\left(\hspace{2.22198pt}\overline{uv}\frac{\partial \overline{{\it\Theta}}}{\partial x}+\overline{v^{2}}\frac{\partial \overline{{\it\Theta}}}{\partial r}\hspace{2.22198pt}\right)\hspace{2.22198pt}\right]}_{P_{v{\it\theta}}}\nonumber\\ \displaystyle & & \displaystyle +\,\underbrace{\overline{\frac{p}{{\it\rho}}\frac{\partial {\it\theta}}{\partial r}}\phantom{\Bigg|}}_{{\it\Phi}_{v{\it\theta}}\,(balance)}\hspace{2.22198pt}\underbrace{-\left[\hspace{2.22198pt}\frac{\partial \overline{uv{\it\theta}}}{\partial x}+\frac{1}{r}\frac{\partial r\overline{v^{2}{\it\theta}}}{\partial r}-\frac{\overline{w^{2}{\it\theta}}}{r}\;\right]}_{D_{v{\it\theta}}}+\underbrace{\frac{2}{5}\frac{\partial \overline{k{\it\theta}}}{\partial r}}_{{\it\Pi}_{v{\it\theta}}\,(model)}.\end{eqnarray}$$
Budget of
 $\overline{u{\it\theta}}$
normalized by
 $U_{0}^{2}{\it\Theta}_{0}/R_{U}$
, obtained from the present LDV–CW data: convection (——), production (— ⋅ —), turbulent diffusion (— ⋅ ⋅ —), pressure diffusion (
 ${-}\,\cdot \,{-}$
) and pressure–temperature gradient correlation (– – – –) terms.

Budget of
 $\overline{v{\it\theta}}$
normalized by
 $U_{0}^{2}{\it\Theta}_{0}/R_{U}$
, obtained from the present LDV–CW data: convection (——), production (— ⋅ —), turbulent diffusion (— ⋅ ⋅ —), pressure diffusion (
 ${-}\,\cdot \,{-}$
) and pressure–temperature gradient correlation (– – – –) terms.

The budgets of the streamwise and radial turbulent heat fluxes are presented in figures 23 and 24. To the authors’ knowledge, currently there are no available data in the literature regarding these budgets for the slightly heated round jet. Even if no comparison can be made with other works, some interesting observations emerge.
-
(i) The
$\overline{u{\it\theta}}$
budget shares some similarities with the
$\overline{u^{2}}$
budget presented in figure 17. Convection, production and turbulent diffusion all display similar patterns. Pressure diffusion is negligible in both cases. The sink terms,
${\it\Phi}_{u{\it\theta}}$
for the
$\overline{u{\it\theta}}$
budget and
${\it\Phi}_{uu}-{\it\epsilon}_{uu}$
for the
$\overline{u^{2}}$
budget, are also comparable, both in shape and in magnitude. -
(ii) The
$\overline{v{\it\theta}}$
budget is a near copy of the
$\overline{uv}$
budget presented in figure 17. All the terms are comparable, both in shape and in magnitude.


6. Conclusion
LDV and combined LDV–CW measurements were carried out in the self-preserving region of a slightly heated round jet. Great care has been taken with control of the initial conditions (thermal or otherwise), the issue of statistical convergence, the minute details of probe positioning and the impact of the LDV seeding on the cold-wire probe. This allows for the construction of a novel and complete database that includes well-converged second- and third-order moments of velocity fluctuations, temperature fluctuations and mixed correlations. The good agreement of the present data with the consistency assessments provided by analytical expressions for
 $\overline{V}$
,
 $\overline{uv}$
and
 $\overline{v{\it\theta}}$
derived, respectively, from the continuity, mean momentum and mean enthalpy equations reinforces our confidence in the present results.
The turbulent kinetic energy transport budget and the
 $\overline{u_{i}u_{i}}$
budgets have been established, employing Lumley’s model for estimation of the pressure diffusion terms. Also, the availability of data for the third-order moment
 $\overline{vw^{2}}$
obtained from direct measurement have enabled complete calculation of the turbulent diffusion terms. The effect of the substitution of this third-order moment for
 $\overline{v^{3}}$
has been elucidated. The dissipation
 ${\it\epsilon}_{k}$
is taken as the closing balance of the budget, thus producing what is, in the authors’ opinion, the most reliable estimate to date for this quantity in the free round turbulent jet.
Employing this strategy in the treatment of PL’s and HCG’s data produces
 ${\it\epsilon}_{k}$
curves that are similar to the present one. Also, when the specific parameters of each database are considered, the model developed by Thiesset et al. (Reference Thiesset, Antonia and Djenidi2014) produced centreline values of
 ${\it\epsilon}_{k}$
that are almost identical to the balance of their respective budgets. This result represents a reconciliation of sorts between the databases of PL and HCG and suggests that the discrepancies between the results reported are due to the initial conditions. It also raises the question of the existence of universality in the self-similar state of the turbulent round jet.
The value of every single term of the passive scalar transport budget has been established, except for the dissipation, which was inferred as the closing balance. Measurements of the mixed velocity–temperature correlations (including third-order correlations
 $\overline{u{\it\theta}^{2}}$
and
 $\overline{v{\it\theta}^{2}}$
) engendered the current confidence in the value inferred. Again, in the authors’ opinion, this constitutes the most reliable estimate for
 ${\it\epsilon}_{{\it\theta}}$
that is experimentally attainable.
The transport budgets of the turbulent heat fluxes were also established. Again, to the authors’ knowledge, these budgets have not previously been available in the literature.
Finally, the present study provides a comprehensive database for the slightly heated round jet flow that includes values for the turbulent kinetic energy and temperature dissipation rates. These values could be used in future efforts to advance our knowledge of problems relating to the behaviour of dissipation processes. Also, with the rapid advancement of computing capabilities, DNS at higher Reynolds numbers could help shed some light on the exact behaviour of the smaller structures of turbulence.
Acknowledgements
The authors acknowledge financial support from the Natural Sciences and Engineering Research Council of Canada. They are also grateful to Professor R. Antonia of the University of Newcastle, who provided some of the impetus behind this research project.
Appendix A. Development of the budget equations
This appendix shows how the normalized and self-preserving forms of the budget equations are obtained from the usual dimensional equations.
A.1. Dimensional form of the different budget equations
A.1.1. Reynolds stresses
Starting with the Navier–Stokes and continuity equations written in cylindrical coordinates and applying the Reynolds decomposition rules (for a statistically stationary, incompressible and mean axisymmetric flow), one can derive the transport equations for the four components of the Reynolds stress tensor. These equations written in budget form are usually expressed as
 $0=\unicode[STIX]{x1D60A}_{ij}+\unicode[STIX]{x1D617}_{ij}+{\it\Phi}_{ij}+\unicode[STIX]{x1D60B}_{ij}+{\it\Pi}_{ij}+\unicode[STIX]{x1D614}_{ij}-{\it\epsilon}_{ij}$
. In the following budget equations, the
 $ij$
indices are replaced by the symbols for the actual components (e.g.
 $\unicode[STIX]{x1D60A}_{11}\equiv C_{uu}$
,
 $\unicode[STIX]{x1D617}_{12}\equiv P_{uv}$
and so on).
 $\overline{u^{2}}\text{ budget}$
:
 $$\begin{eqnarray}\displaystyle 0 & = & \displaystyle \underbrace{-\!\left(\overline{U}\frac{\partial \overline{u^{2}}}{\partial x}+\overline{V}\frac{\partial \overline{u^{2}}}{\partial r}\right)}_{C_{uu}}\underbrace{-\,2\vphantom{\Bigg|}\left(\overline{u^{2}}\frac{\partial \overline{U}}{\partial x}+\overline{uv}\frac{\partial \overline{U}}{\partial r}\right)}_{P_{uu}}+\underbrace{\vphantom{\Bigg|}2\hspace{2.22198pt}\overline{\frac{p}{{\it\rho}}\frac{\partial u}{\partial x}}}_{{\it\Phi}_{uu}}\nonumber\\ \displaystyle & & \displaystyle \underbrace{-\,\left(\frac{\partial \overline{u^{3}}}{\partial x}+\frac{1}{r}\frac{\partial r\hspace{2.22198pt}\overline{u^{2}v}}{\partial r}\right)}_{D_{uu}}\underbrace{-\,\vphantom{\Bigg|}\frac{2}{{\it\rho}}\frac{\partial \overline{pu}}{\partial x}}_{{\it\Pi}_{uu}}+\underbrace{\hspace{2.22198pt}{\it\nu}\left[~\frac{\partial ^{2}\overline{u^{2}}}{\partial x^{2}}+\frac{1}{r}\frac{\partial }{\partial r}\left(r\frac{\partial \overline{u^{2}}}{\partial r}\right)\right]}_{M_{uu}}\nonumber\\ \displaystyle & & \displaystyle -\,\underbrace{2{\it\nu}\,\left[\;\overline{\left(\frac{\partial u}{\partial x}\right)^{2}}+\overline{\left(\frac{\partial u}{\partial r}\right)^{2}}+\frac{1}{r^{2}}\overline{\left(\frac{\partial u}{\partial {\it\varphi}}\right)^{2}}\;\right]}_{{\it\epsilon}_{uu}}.\end{eqnarray}$$
 $\overline{v^{2}}\text{ budget}$
:
 $$\begin{eqnarray}\displaystyle 0 & = & \displaystyle \underbrace{-\!\left(\overline{U}\frac{\partial \overline{v^{2}}}{\partial x}+\overline{V}\frac{\partial \overline{v^{2}}}{\partial r}\right)}_{C_{vv}}\underbrace{-\,2\vphantom{\Bigg|}\left(\overline{uv}\frac{\partial \overline{V}}{\partial x}+\overline{v^{2}}\frac{\partial \overline{V}}{\partial r}\right)}_{P_{vv}}+\underbrace{2\,\vphantom{\Bigg|}\overline{\frac{p}{{\it\rho}}\frac{\partial v}{\partial r}}}_{{\it\Phi}_{vv}}\nonumber\\ \displaystyle & & \displaystyle \underbrace{-\left(\frac{\partial \overline{uv^{2}}}{\partial x}+\frac{1}{r}\frac{\partial r\hspace{2.22198pt}\overline{v^{3}}}{\partial r}-2\frac{\overline{vw^{2}}}{r}\right)}_{D_{v}}\underbrace{-\hspace{2.22198pt}\vphantom{\Bigg|}\frac{2}{{\it\rho}}\frac{\partial \overline{pv}}{\partial r}}_{{\it\Pi}_{vv}}+\underbrace{{\it\nu}\left[~\frac{\partial ^{2}\overline{v^{2}}}{\partial x^{2}}+\frac{1}{r}\frac{\partial }{\partial r}\left(r\frac{\partial \overline{v^{2}}}{\partial r}\right)\right]}_{M_{vv}}\nonumber\\ \displaystyle & & \displaystyle -\,\underbrace{2{\it\nu}\,\left[\;\overline{\left(\frac{\partial v}{\partial x}\right)^{2}}+\overline{\left(\frac{\partial v}{\partial r}\right)^{2}}+\frac{1}{r^{2}}\overline{\left(\frac{\partial v}{\partial {\it\varphi}}\right)^{2}}+\frac{\overline{v^{2}}}{r^{2}}+\;2\,\overline{\frac{v}{r^{2}}\frac{\partial w}{\partial {\it\varphi}}}\;\right]}_{{\it\epsilon}_{vv}}.\end{eqnarray}$$
 $\overline{w^{2}}\text{ budget}$
:
 $$\begin{eqnarray}\displaystyle 0 & = & \displaystyle \underbrace{-\left(\overline{U}\frac{\partial \overline{w^{2}}}{\partial x}+\overline{V}\frac{\partial \overline{w^{2}}}{\partial r}\right)}_{C_{ww}}\underbrace{-\,2\vphantom{\Bigg|}\frac{\overline{V}\;\overline{w^{2}}}{r}}_{P_{ww}}+\underbrace{2\,\vphantom{\Bigg|}\overline{\frac{p}{{\it\rho}}\left(\frac{1}{r}\frac{\partial w}{\partial {\it\varphi}}+\frac{v}{r}\right)}}_{{\it\Phi}_{ww}}\nonumber\\ \displaystyle & & \displaystyle \underbrace{-\left(\frac{\partial \overline{uw^{2}}}{\partial x}+\frac{1}{r}\frac{\partial r\hspace{2.22198pt}\overline{vw^{2}}}{\partial r}+2\frac{\overline{vw^{2}}}{r}\right)}_{D_{ww}}\underbrace{-\,2\vphantom{\Bigg|}\overline{\frac{pv}{{\it\rho}r}}}_{{\it\Pi}_{ww}}+\underbrace{{\it\nu}\left[~\frac{\partial ^{2}\overline{w^{2}}}{\partial x^{2}}+\frac{1}{r}\frac{\partial }{\partial r}\left(r\frac{\partial \overline{w^{2}}}{\partial r}\right)\right]}_{M_{ww}}\nonumber\\ \displaystyle & & \displaystyle -\,\underbrace{2{\it\nu}\,\left[\;\overline{\left(\frac{\partial w}{\partial x}\right)^{2}}+\overline{\left(\frac{\partial w}{\partial r}\right)^{2}}+\frac{1}{r^{2}}\overline{\left(\frac{\partial w}{\partial {\it\varphi}}\right)^{2}}+\frac{\overline{w^{2}}}{r^{2}}+\;2\,\overline{\frac{v}{r^{2}}\frac{\partial w}{\partial {\it\varphi}}}\;\right]}_{{\it\epsilon}_{ww}}.\end{eqnarray}$$
 $\overline{uv}\text{ budget}$
:
 $$\begin{eqnarray}\displaystyle 0 & = & \displaystyle \underbrace{-\vphantom{\Bigg|}\left(\overline{U}\frac{\partial \overline{uv}}{\partial x}+\overline{V}\frac{\partial \overline{uv}}{\partial r}\right)}_{C_{uv}}\underbrace{-\vphantom{\Bigg|}\left(\overline{uv}\frac{\partial \overline{U}}{\partial x}+\overline{v^{2}}\frac{\partial \overline{U}}{\partial r}+\overline{u^{2}}\frac{\partial \overline{V}}{\partial x}+\overline{uv}\frac{\partial \overline{V}}{\partial r}\right)}_{P_{uv}}+\underbrace{\vphantom{\Bigg|}\overline{\frac{p}{{\it\rho}}\left(\frac{\partial v}{\partial x}+\frac{\partial u}{\partial r}\right)}}_{{\it\Phi}_{uv}}\nonumber\\ \displaystyle & & \displaystyle \underbrace{-\left(\frac{\partial \overline{u^{2}v}}{\partial x}+\frac{1}{r}\frac{\partial r\hspace{2.22198pt}\overline{uv^{2}}}{\partial r}-\frac{\overline{uw^{2}}}{r}\right)}_{D_{uv}}\underbrace{-\vphantom{\Bigg|}\frac{1}{{\it\rho}}\left(\frac{\partial \overline{pv}}{\partial x}+\frac{\partial \overline{pu}}{\partial r}\right)}_{{\it\Pi}_{uv}}+\underbrace{{\it\nu}\left[~\frac{\partial ^{2}\overline{uv}}{\partial x^{2}}+\frac{1}{r}\frac{\partial }{\partial r}\left(r\frac{\partial \overline{uv}}{\partial r}\right)\right]}_{M_{uv}}\nonumber\\ \displaystyle & & \displaystyle -\,\underbrace{2{\it\nu}\,\left[\;\overline{\left(\frac{\partial u}{\partial x}\right)\left(\frac{\partial v}{\partial x}\right)}+\overline{\left(\frac{\partial u}{\partial r}\right)\left(\frac{\partial v}{\partial r}\right)}+\frac{1}{r^{2}}\overline{\left(\frac{\partial u}{\partial {\it\varphi}}\right)\left(\frac{\partial v}{\partial {\it\varphi}}\right)}+\frac{\overline{uv}}{2r^{2}}+\overline{\frac{u}{r^{2}}\frac{\partial w}{\partial {\it\varphi}}}\!\right]}_{{\it\epsilon}_{uv}}.\end{eqnarray}$$
A.1.2. Turbulent kinetic energy
The transport equation for the turbulent kinetic energy
 $k$
is easily obtained by summing the transport equations of half the normal Reynolds stresses. This equation, written in budget form as
 $0=C_{k}+P_{k}+D_{k}+{\it\Pi}_{k}+M_{k}-{\it\epsilon}_{k}$
, is given by
 $$\begin{eqnarray}\displaystyle 0 & = & \displaystyle \underbrace{-\left[\overline{U}\frac{\partial k}{\partial x}+\overline{V}\frac{\partial k}{\partial r}\vphantom{\left[\overline{uv}\frac{\overline{V}\hspace{2.22198pt}\overline{w^{2}}}{r}\right]}\right]}_{C_{k}}\underbrace{-\left[\overline{u^{2}}\frac{\partial \overline{U}}{\partial x}+\overline{v^{2}}\frac{\partial \overline{V}}{\partial r}+\frac{\overline{V}\hspace{2.22198pt}\overline{w^{2}}}{r}+\overline{uv}\left(\frac{\partial \overline{U}}{\partial r}+\frac{\partial \overline{V}}{\partial x}\right)\right]}_{P_{k}}\nonumber\\ \displaystyle & & \displaystyle \underbrace{-\left[\frac{\partial \overline{ku}}{\partial x}+\frac{1}{r}\frac{\partial r\hspace{2.22198pt}\overline{kv}}{\partial r}\right]\vphantom{\left[\left(r\frac{\partial k}{\partial r}\right)\right]}}_{D_{k}}\underbrace{-\frac{1}{{\it\rho}}\left[\frac{\partial \overline{pu}}{\partial x}+\frac{1}{r}\frac{\partial r\hspace{2.22198pt}\overline{pv}}{\partial r}\right]\vphantom{\left[\left(r\frac{\partial k}{\partial r}\right)\right]}}_{{\it\Pi}_{k}}+\underbrace{{\it\nu}\left[\frac{\partial ^{2}k}{\partial x^{2}}+\frac{1}{r}\frac{\partial }{\partial r}\left(r\frac{\partial k}{\partial r}\right)\right.}_{M_{k}\,-\,{\it\epsilon}_{k}\,\dots }\nonumber\\ \displaystyle & & \displaystyle \underbrace{-\left(\overline{\left(\frac{\partial u}{\partial x}\right)^{2}}+\overline{\left(\frac{\partial v}{\partial x}\right)^{2}}+\overline{\left(\frac{\partial w}{\partial x}\right)^{2}}+\overline{\left(\frac{\partial u}{\partial r}\right)^{2}}+\overline{\left(\frac{\partial v}{\partial r}\right)^{2}}+\overline{\left(\frac{\partial w}{\partial r}\right)^{2}}\right.}_{\dots \,M_{k}\,-\,{\it\epsilon}_{k}\,\dots }\nonumber\\ \displaystyle & & \displaystyle \underbrace{\left.\left.+\frac{1}{r^{2}}\overline{\left(\frac{\partial u}{\partial {\it\varphi}}\right)^{2}}+\frac{1}{r^{2}}\overline{\left(\frac{\partial v}{\partial {\it\varphi}}\right)^{2}}+\frac{1}{r^{2}}\overline{\left(\frac{\partial w}{\partial {\it\varphi}}\right)^{2}}+\frac{(\overline{v^{2}}+\overline{w^{2}})}{r^{2}}+4\overline{\frac{v}{r^{2}}\frac{\partial w}{\partial {\it\varphi}}}\right)~\right]}_{M_{k}\,-\,{\it\epsilon}_{k}}.\end{eqnarray}$$
The viscous terms (
 $M_{k}-{\it\epsilon}_{k}$
) must be rewritten in order to reveal the exact definition of the dissipation rate of
 $k$
, which, expressed in Gibbs’ notation for an incompressible flow, is
 $$\begin{eqnarray}{\it\epsilon}_{k}\equiv 2{\it\nu}\hspace{2.22198pt}\overline{(\unicode[STIX]{x1D668}\boldsymbol{ : }\unicode[STIX]{x1D668}^{\text{T}})}={\it\nu}\hspace{2.22198pt}[\hspace{2.22198pt}\overline{(\boldsymbol{{\rm\nabla}}\boldsymbol{u}\boldsymbol{ : }\boldsymbol{{\rm\nabla}}\boldsymbol{u}^{\text{T}})}+\overline{(\boldsymbol{{\rm\nabla}}\boldsymbol{u}\boldsymbol{ : }\boldsymbol{{\rm\nabla}}\boldsymbol{u}\vphantom{\boldsymbol{{\rm\nabla}}\boldsymbol{u}\boldsymbol{ : }\boldsymbol{{\rm\nabla}}\boldsymbol{u}^{\text{T}}})}\,],\end{eqnarray}$$
where
 $\unicode[STIX]{x1D668}$
and
 $\boldsymbol{u}$
are the fluctuating rate-of-strain tensor and velocity vector, respectively. By expanding explicitly the first term on the right-hand side of (A 6) for a mean axisymmetric flow, one can verify that
 $\overline{(\boldsymbol{{\rm\nabla}}\boldsymbol{u}\boldsymbol{ : }\boldsymbol{{\rm\nabla}}\boldsymbol{u}^{\text{T}})}$
is represented by the last two lines of (A 5). Using the definition of
 ${\it\epsilon}_{k}$
, (A 6), it is thus possible to rewrite the viscous terms of the
 $k$
budget as
 $$\begin{eqnarray}\displaystyle M_{k}-{\it\epsilon}_{k} & = & \displaystyle {\it\nu}\left[\frac{\partial ^{2}k}{\partial x^{2}}+\frac{1}{r}\frac{\partial }{\partial r}\left(r\frac{\partial k}{\partial r}\right)-\overline{(\boldsymbol{{\rm\nabla}}\boldsymbol{u}\boldsymbol{ : }\boldsymbol{{\rm\nabla}}\boldsymbol{u}^{\text{T}})}\right]\nonumber\\ \displaystyle & = & \displaystyle {\it\nu}\left[\frac{\partial ^{2}k}{\partial x^{2}}+\frac{1}{r}\frac{\partial }{\partial r}\left(r\frac{\partial k}{\partial r}\right)+\overline{(\boldsymbol{{\rm\nabla}}\boldsymbol{u}\boldsymbol{ : }\boldsymbol{{\rm\nabla}}\boldsymbol{u}\vphantom{\boldsymbol{{\rm\nabla}}\boldsymbol{u}\boldsymbol{ : }\boldsymbol{{\rm\nabla}}\boldsymbol{u}^{\text{T}}})}-\overline{(\boldsymbol{{\rm\nabla}}\boldsymbol{u}\boldsymbol{ : }\boldsymbol{{\rm\nabla}}\boldsymbol{u}^{\text{T}})}-\overline{(\boldsymbol{{\rm\nabla}}\boldsymbol{u}\boldsymbol{ : }\boldsymbol{{\rm\nabla}}\boldsymbol{u}\vphantom{\boldsymbol{{\rm\nabla}}\boldsymbol{u}\boldsymbol{ : }\boldsymbol{{\rm\nabla}}\boldsymbol{u}^{\text{T}}})}\right]\nonumber\\ \displaystyle & = & \displaystyle {\it\nu}\left[\frac{\partial ^{2}k}{\partial x^{2}}+\frac{1}{r}\frac{\partial }{\partial r}\left(r\frac{\partial k}{\partial r}\right)+\overline{(\boldsymbol{{\rm\nabla}}\boldsymbol{u}\boldsymbol{ : }\boldsymbol{{\rm\nabla}}\boldsymbol{u}\vphantom{\boldsymbol{{\rm\nabla}}\boldsymbol{u}\boldsymbol{ : }\boldsymbol{{\rm\nabla}}\boldsymbol{u}^{\text{T}}})}\right]-{\it\epsilon}_{k}.\end{eqnarray}$$
In the second line of (A 7), the expression
 $\overline{(\boldsymbol{{\rm\nabla}}\boldsymbol{u}\boldsymbol{ : }\boldsymbol{{\rm\nabla}}\boldsymbol{u})}$
has been added and subtracted in order to obtain the exact form for the dissipation
 ${\it\epsilon}_{k}$
as expressed in (A 6). Now, from the last line of (A 7) one can write, for a mean axisymmetric flow, the explicit formulation for the molecular diffusion
 $M_{k}$
:
 $$\begin{eqnarray}\displaystyle M_{k} & = & \displaystyle {\it\nu}\left[\frac{\partial ^{2}k}{\partial x^{2}}+\frac{1}{r}\frac{\partial }{\partial r}\left(r\frac{\partial k}{\partial r}\right)+\overline{(\boldsymbol{{\rm\nabla}}\boldsymbol{u}\boldsymbol{ : }\boldsymbol{{\rm\nabla}}\boldsymbol{u}\vphantom{\boldsymbol{{\rm\nabla}}\boldsymbol{u}\boldsymbol{ : }\boldsymbol{{\rm\nabla}}\boldsymbol{u}^{\text{T}}})}\right]\nonumber\\ \displaystyle & = & \displaystyle {\it\nu}\left[\frac{\partial ^{2}k}{\partial x^{2}}+\frac{1}{r}\frac{\partial }{\partial r}\left(r\frac{\partial k}{\partial r}\right)+\frac{\partial ^{2}\overline{u^{2}}}{\partial x^{2}}+\frac{\partial ^{2}\overline{v^{2}}}{\partial r^{2}}+2\frac{\partial ^{2}\overline{uv}}{\partial x\partial r}+\frac{2}{r}\frac{\partial \overline{uv}}{\partial x}+\frac{2}{r}\frac{\partial \overline{v^{2}}}{\partial r}-\frac{1}{r}\frac{\partial \overline{w^{2}}}{\partial r}\right].\nonumber\\ \displaystyle & & \displaystyle\end{eqnarray}$$
Therefore, using expressions (A 6) and (A 8) in (A 5), the exact form of the
 $k$
budget for an incompressible and axisymmetric flow is expressed as
 $$\begin{eqnarray}\displaystyle 0 & = & \displaystyle \underbrace{-\left[\overline{U}\frac{\partial k}{\partial x}+\overline{V}\frac{\partial k}{\partial r}\vphantom{\left[\overline{uv}\frac{\overline{V}\hspace{2.22198pt}\overline{w^{2}}}{r}\right]}\right]}_{C_{k}}\,\underbrace{-\left[\overline{u^{2}}\frac{\partial \overline{U}}{\partial x}+\overline{v^{2}}\frac{\partial \overline{V}}{\partial r}+\frac{\overline{V}\hspace{2.22198pt}\overline{w^{2}}}{r}+\overline{uv}\left(\frac{\partial \overline{U}}{\partial r}+\frac{\partial \overline{V}}{\partial x}\right)\right]}_{P_{k}}\nonumber\\ \displaystyle & & \displaystyle \underbrace{-\left[\frac{\partial \overline{ku}}{\partial x}+\frac{1}{r}\frac{\partial r\hspace{2.22198pt}\overline{kv}}{\partial r}\right]\vphantom{\left[\left(r\frac{\partial k}{\partial r}\right)\right]}}_{D_{k}}\,\underbrace{-\frac{1}{{\it\rho}}\left[\frac{\partial \overline{pu}}{\partial x}+\frac{1}{r}\frac{\partial r\hspace{2.22198pt}\overline{pv}}{\partial r}\right]\vphantom{\left[\left(r\frac{\partial k}{\partial r}\right)\right]}}_{{\it\Pi}_{k}}\nonumber\\ \displaystyle & & \displaystyle +\,\underbrace{{\it\nu}\left[\frac{\partial ^{2}k}{\partial x^{2}}+\frac{1}{r}\frac{\partial }{\partial r}\left(r\frac{\partial k}{\partial r}\right)+\frac{\partial ^{2}\overline{u^{2}}}{\partial x^{2}}+\frac{\partial ^{2}\overline{v^{2}}}{\partial r^{2}}+2\frac{\partial ^{2}\overline{uv}}{\partial x\partial r}+\frac{2}{r}\frac{\partial \overline{uv}}{\partial x}+\frac{2}{r}\frac{\partial \overline{v^{2}}}{\partial r}-\frac{1}{r}\frac{\partial \overline{w^{2}}}{\partial r}\right]}_{M_{k}}\nonumber\\ \displaystyle & & \displaystyle -\,\underbrace{{\it\nu}\left[\,\overline{\left(\frac{\partial u}{\partial x}\right)^{2}}+\overline{\left(\frac{\partial v}{\partial x}\right)^{2}}+\overline{\left(\frac{\partial w}{\partial x}\right)^{2}}+\overline{\left(\frac{\partial u}{\partial r}\right)^{2}}+\overline{\left(\frac{\partial v}{\partial r}\right)^{2}}+\overline{\left(\frac{\partial w}{\partial r}\right)^{2}}\right.}_{{\it\epsilon}_{k}\,\dots }\nonumber\\ \displaystyle & & \displaystyle \underbrace{+\frac{1}{r^{2}}\overline{\left(\frac{\partial u}{\partial {\it\varphi}}\right)^{2}}+\frac{1}{r^{2}}\overline{\left(\frac{\partial v}{\partial {\it\varphi}}\right)^{2}}+\frac{1}{r^{2}}\overline{\left(\frac{\partial w}{\partial {\it\varphi}}\right)^{2}}}_{\dots \,{\it\epsilon}_{k}\,\dots }\nonumber\\ \displaystyle & & \displaystyle \underbrace{\left.+\frac{(\overline{v^{2}}+\overline{w^{2}})}{r^{2}}+4\overline{\frac{v}{r^{2}}\frac{\partial w}{\partial {\it\varphi}}}-\frac{\partial ^{2}\overline{u^{2}}}{\partial x^{2}}-\frac{\partial ^{2}\overline{v^{2}}}{\partial r^{2}}-2\frac{\partial ^{2}\overline{uv}}{\partial x\partial r}-\frac{2}{r}\frac{\partial \overline{uv}}{\partial x}-\frac{2}{r}\frac{\partial \overline{v^{2}}}{\partial r}+\frac{1}{r}\frac{\partial \overline{w^{2}}}{\partial r}\right]}_{\dots \,{\it\epsilon}_{k}}.\nonumber\\ \displaystyle & & \displaystyle\end{eqnarray}$$
The first two lines (i.e. first nine terms) of the exact dissipation rate
 ${\it\epsilon}_{k}$
written explicitly in (A 9) are usually referred to as the pseudo-dissipation and denoted by
 $\tilde{{\it\epsilon}}_{k}$
. At high Reynolds numbers, it is clear that
 $\tilde{{\it\epsilon}}_{k}$
represents the dominant part of
 ${\it\epsilon}_{k}$
. This is why several authors prefer to define
 ${\it\epsilon}_{k}$
in the simple form of
 $\tilde{{\it\epsilon}}_{k}$
instead of using the exact form. In the present study, we wish to make the distinction because it influences the form of
 $M_{k}$
as shown by expression (A 8) (even if in the end
 $M_{k}$
is negligible).
A.1.3. Variance of temperature fluctuations
Starting from the enthalpy equation written in cylindrical coordinates and applying the Reynolds decomposition rules (for a statistically stationary, incompressible and mean axisymmetric flow), one can derive the transport equation for half the variance of the temperature fluctuations,
 $\overline{{\it\theta}^{2}}/2$
. The dimensional form of this equation, written as a budget, is
 $$\begin{eqnarray}\displaystyle 0 & = & \displaystyle \underbrace{-\left[\,\overline{U}\frac{\partial (\,\overline{{\it\theta}^{2}}/2\,)}{\partial x}+\overline{V}\frac{\partial (\,\overline{{\it\theta}^{2}}/2\,)}{\partial r}\,\right]}_{C_{{\it\theta}}}\underbrace{-\left[\vphantom{\frac{\partial (\,\overline{{\it\theta}^{2}}/2\,)}{\partial x}}\overline{u{\it\theta}}\frac{\partial \overline{{\it\Theta}}}{\partial x}+\overline{v{\it\theta}}\frac{\partial \overline{{\it\Theta}}}{\partial r}\right]}_{P_{{\it\theta}}}\underbrace{-\frac{1}{2}\left(\frac{\partial \overline{u{\it\theta}^{2}}}{\partial x}+\frac{1}{r}\frac{\partial r\hspace{2.22198pt}\overline{v{\it\theta}^{2}}}{\partial r}\right)}_{D_{{\it\theta}}}\nonumber\\ \displaystyle & & \displaystyle +\,\underbrace{\frac{{\it\alpha}}{2}\left[\frac{\partial ^{2}\overline{{\it\theta}^{2}}}{\partial x^{2}}+\frac{1}{r}\frac{\partial }{\partial r}\left(r\frac{\partial \overline{{\it\theta}^{2}}}{\partial r}\right)\right]}_{M_{{\it\theta}}}-\underbrace{{\it\alpha}\left[\,\overline{\left(\frac{\partial {\it\theta}}{\partial x}\right)^{2}}+\overline{\left(\frac{\partial {\it\theta}}{\partial r}\right)^{2}}+\frac{1}{r^{2}}\overline{\left(\frac{\partial {\it\theta}}{\partial {\it\varphi}}\right)^{2}}\,\right]}_{{\it\epsilon}_{{\it\theta}}}.\end{eqnarray}$$
A.1.4. Turbulent heat fluxes
Starting from the sum of the enthalpy equation times
 $u_{i}$
and the Navier–Stokes equation times
 ${\it\theta}$
, written in cylindrical coordinates, and applying the Reynolds decomposition rules (for a statistically stationary, incompressible and mean axisymmetric flow), one can derive the transport equation for the turbulent heat fluxes,
 $\overline{u_{i}{\it\theta}}$
. Their dimensional forms, written as budgets, are the following.
 $\overline{u{\it\theta}}$
budget:
 $$\begin{eqnarray}\displaystyle 0 & = & \displaystyle \underbrace{-\!\left[\;\overline{U}\frac{\partial \overline{u{\it\theta}}}{\partial x}+\overline{V}\frac{\partial \overline{u{\it\theta}}}{\partial r}\;\right]}_{C_{u{\it\theta}}}\;\;\underbrace{-\left[\hspace{2.22198pt}\left(\overline{u{\it\theta}}\frac{\partial \overline{U}}{\partial x}+\overline{v{\it\theta}}\frac{\partial \overline{U}}{\partial r}\right)+\hspace{2.22198pt}\left(\overline{u^{2}}\frac{\partial \overline{{\it\Theta}}}{\partial x}+\overline{uv}\frac{\partial \overline{{\it\Theta}}}{\partial r}\right)\hspace{2.22198pt}\right]}_{P_{u{\it\theta}}}\nonumber\\ \displaystyle & & \displaystyle +\,\underbrace{\overline{\frac{p}{{\it\rho}}\frac{\partial {\it\theta}}{\partial x}}\phantom{\Bigg|}}_{{\it\Phi}_{u{\it\theta}}}\;\;\underbrace{-\hspace{2.22198pt}\left[\frac{\partial \overline{u^{2}{\it\theta}}}{\partial x}+\frac{1}{r}\frac{\partial r\overline{uv{\it\theta}}}{\partial r}\;\right]}_{D_{u{\it\theta}}}\;\;\underbrace{-\;\frac{1}{{\it\rho}}\frac{\partial \overline{p{\it\theta}}}{\partial x}\phantom{\Bigg|}}_{{\it\Pi}_{u{\it\theta}}}\nonumber\\ \displaystyle & & \displaystyle +\;\underbrace{{\it\alpha}\left[\;\frac{\partial }{\partial x}\overline{u\frac{\partial {\it\theta}}{\partial x}}+\frac{1}{r}\frac{\partial }{\partial r}r\overline{u\frac{\partial {\it\theta}}{\partial r}}\;\right]+{\it\nu}\left[\;\frac{\partial }{\partial x}\overline{{\it\theta}\frac{\partial u}{\partial x}}+\frac{1}{r}\frac{\partial }{\partial r}r\overline{{\it\theta}\frac{\partial u}{\partial r}}\;\right]}_{M_{u{\it\theta}}}\nonumber\\ \displaystyle & & \displaystyle -\;\underbrace{({\it\nu}+{\it\alpha})\left[\,\overline{\frac{\partial u}{\partial x}\hspace{2.22198pt}\frac{\partial {\it\theta}}{\partial x}}+\overline{\frac{\partial u}{\partial r}\frac{\partial {\it\theta}}{\partial r}}+\frac{1}{r^{2}}\overline{\frac{\partial u}{\partial {\it\varphi}}\frac{\partial {\it\theta}}{\partial {\it\varphi}}}\,\right]}_{{\it\epsilon}_{u{\it\theta}}}.\end{eqnarray}$$
 $\overline{v{\it\theta}}$
budget:
 $$\begin{eqnarray}\displaystyle 0 & = & \displaystyle \underbrace{-\left[\;\overline{U}\frac{\partial \overline{v{\it\theta}}}{\partial x}+\overline{V}\frac{\partial \overline{v{\it\theta}}}{\partial r}\;\right]}_{C_{v{\it\theta}}}\hspace{2.22198pt}\;\underbrace{-\left[\hspace{2.22198pt}\left(\overline{u{\it\theta}}\frac{\partial \overline{V}}{\partial x}+\overline{v{\it\theta}}\frac{\partial \overline{V}}{\partial r}\right)+\hspace{2.22198pt}\left(\overline{uv}\frac{\partial \overline{{\it\Theta}}}{\partial x}+\overline{v^{2}}\frac{\partial \overline{{\it\Theta}}}{\partial r}\right)\hspace{2.22198pt}\right]}_{P_{v{\it\theta}}}\nonumber\\ \displaystyle & & \displaystyle +\,\underbrace{\overline{\frac{p}{{\it\rho}}\frac{\partial {\it\theta}}{\partial r}}\phantom{\Bigg|}}_{{\it\Phi}_{v{\it\theta}}}\;\;\underbrace{-\hspace{2.22198pt}\left[\hspace{2.22198pt}\frac{\partial \overline{uv{\it\theta}}}{\partial x}+\frac{1}{r}\frac{\partial r\overline{v^{2}{\it\theta}}}{\partial r}-\frac{\overline{w^{2}{\it\theta}}}{r}\;\right]}_{D_{vu{\it\theta}}}\;\;\underbrace{-\;\frac{1}{{\it\rho}}\frac{\partial \overline{p{\it\theta}}}{\partial r}\phantom{\Bigg|}}_{{\it\Pi}_{v{\it\theta}}}\nonumber\\ \displaystyle & & \displaystyle +\,\underbrace{{\it\alpha}\left[\;\frac{\partial }{\partial x}\overline{v\frac{\partial {\it\theta}}{\partial x}}+\frac{1}{r}\frac{\partial }{\partial r}r\overline{v\frac{\partial {\it\theta}}{\partial r}}\;\right]+{\it\nu}\left[\;\frac{\partial }{\partial x}\overline{{\it\theta}\frac{\partial v}{\partial x}}+\frac{1}{r}\frac{\partial }{\partial r}r\overline{{\it\theta}\frac{\partial v}{\partial r}}\;\right]-{\it\nu}\left[\;\frac{\overline{v{\it\theta}}}{r^{2}}+\frac{2}{r^{2}}\overline{{\it\theta}\frac{\partial w}{\partial {\it\varphi}}}\;\right]}_{M_{v{\it\theta}}}\nonumber\\ \displaystyle & & \displaystyle -\;\underbrace{({\it\nu}+{\it\alpha})\left[\,\overline{\frac{\partial v}{\partial x}\hspace{2.22198pt}\frac{\partial {\it\theta}}{\partial x}}+\overline{\frac{\partial v}{\partial r}\frac{\partial {\it\theta}}{\partial r}}+\frac{1}{r^{2}}\overline{\frac{\partial v}{\partial {\it\varphi}}\frac{\partial {\it\theta}}{\partial {\it\varphi}}}\,\right]}_{{\it\epsilon}_{u{\it\theta}}}.\end{eqnarray}$$
A.2. Normalized and self-preserving forms of the different budget equations
Normalization of the
 $k$
and
 $\overline{u_{i}u_{j}}$
budgets is done by dividing (5.2) and (5.7)–(5.10) by
 $U_{0}^{3}/R_{U}$
; normalization of the
 $\overline{{\it\theta}^{2}}/2$
budget is done by dividing (5.19) by
 $(U_{0}{\it\Theta}_{0}^{2})/R_{U}$
; and normalization of the
 $\overline{u_{i}{\it\theta}}$
budgets is done by dividing (A 11) and (A 12) by
 $(U_{0}^{2}{\it\Theta}_{0})/R_{U}$
. Before presenting the normalized forms of the budget equations, expressions for the streamwise gradients of the self-preserving quantities need to be established.
A.2.1. Procedure used to evaluate streamwise gradients of self-preserving quantities
To demonstrate this procedure, let us consider the normalized form of the streamwise gradient of the
 $n$
th-order moment of axial velocity,
 $$\begin{eqnarray}\displaystyle \frac{R_{U}}{{U_{0}}^{n}}\hspace{2.22198pt}\frac{\partial \overline{u^{n}}}{\partial x} & = & \displaystyle \frac{R_{U}}{{U_{0}}^{n}}\hspace{2.22198pt}\frac{\partial }{\partial x}\left({U_{0}}^{n}\hspace{2.22198pt}\frac{\overline{u^{n}}}{{U_{0}}^{n}}\right)\nonumber\\ \displaystyle & = & \displaystyle \frac{R_{U}}{{U_{0}}^{n}}\hspace{2.22198pt}\left[\frac{\overline{u^{n}}}{{U_{0}}^{n}}\hspace{2.22198pt}n\hspace{2.22198pt}{U_{0}}^{(n-1)}\frac{\text{d}U_{0}}{\text{d}x}+{U_{0}}^{n}\frac{\text{d}}{\text{d}{\it\xi}}\left(\frac{\overline{u^{n}}}{{U_{0}}^{n}}\right)\hspace{2.22198pt}\frac{\partial {\it\xi}}{\partial x}\right],\end{eqnarray}$$
where the self-preserving form of the
 $n$
th-order moment of the axial velocity,
 $\overline{u^{n}}/{U_{0}}^{n}=f({\it\xi})$
, is a function of the normalized radial coordinate
 ${\it\xi}=r/R_{U}$
. For a centreline velocity and half-radius behaving as
 $$\begin{eqnarray}\frac{U_{j}}{U_{0}}=\frac{1}{B_{U}}\left(\frac{x-x_{0_{U}}}{D}\right)\quad \text{and}\quad \frac{R_{U}}{D}=B_{R_{U}}\hspace{2.22198pt}{\it\beta}_{U}\left(\frac{x-x_{0_{U}}}{D}\right),\end{eqnarray}$$
 $$\begin{eqnarray}\text{where}\quad {\it\beta}_{U}=\frac{x-x_{0_{R_{U}}}}{x-x_{0_{U}}},\end{eqnarray}$$
it is easily shown that
 $\text{d}U_{0}/\text{d}x=-{\it\beta}_{U}\hspace{2.22198pt}U_{0}\hspace{2.22198pt}B_{R_{U}}/R_{U}$
and
 $\partial {\it\xi}/\partial x=-{\it\xi}\hspace{2.22198pt}B_{R_{U}}/R_{U}$
. Upon substituting these expressions into (A 13), the equation simplifies to
 $$\begin{eqnarray}\frac{R_{U}}{{U_{0}}^{n}}\hspace{2.22198pt}\frac{\partial \overline{u^{n}}}{\partial x}=-B_{R_{U}}\left[{\it\beta}_{U}\hspace{2.22198pt}n\hspace{2.22198pt}\frac{\overline{u^{n}}}{{U_{0}}^{n}}+{\it\xi}\hspace{2.22198pt}\frac{\text{d}}{\text{d}{\it\xi}}\left(\frac{\overline{u^{n}}}{{U_{0}}^{n}}\right)\right].\end{eqnarray}$$
The term denoted by
 ${\it\beta}_{U}$
accounts for the fact that the virtual origins of the
 $R_{U}/D$
and
 $U_{j}/U_{0}$
distributions in the self-similar region can differ. In the present experiment, these parameters are
 $x_{0_{R_{U}}}/D=1.236$
and
 $x_{0_{U}}/D=1.624$
, respectively, leading to
 ${\it\beta}_{U}=1.014$
at
 $x/D=30$
.
Applying the same procedure to the temperature field yields
 $$\begin{eqnarray}\displaystyle & \displaystyle \frac{R_{U}}{{{\it\Theta}_{0}}^{n}}\hspace{2.22198pt}\frac{\partial \overline{{\it\theta}^{n}}}{\partial x}=-B_{R_{U}}\left[{\it\beta}_{{\it\theta}}\hspace{2.22198pt}n\hspace{2.22198pt}\frac{\overline{{\it\theta}^{n}}}{{{\it\Theta}_{0}}^{n}}+{\it\xi}\hspace{2.22198pt}\frac{\text{d}}{\text{d}{\it\xi}}\left(\frac{\overline{{\it\theta}^{n}}}{{{\it\Theta}_{0}}^{n}}\right)\right], & \displaystyle\end{eqnarray}$$
 $$\begin{eqnarray}\displaystyle & \displaystyle \text{where}\quad {\it\beta}_{{\it\theta}}=\frac{x-x_{0_{R_{U}}}}{x-x_{0_{{\it\theta}}}}. & \displaystyle\end{eqnarray}$$
For the mixed velocity–temperature components, the procedure yields
 $$\begin{eqnarray}\frac{R_{U}}{U_{0}^{n}{\it\Theta}_{0}}\hspace{2.22198pt}\frac{\partial \overline{u_{i}^{n}{\it\theta}}}{\partial x}=-B_{R_{U}}\left[(n{\it\beta}_{U}+{\it\beta}_{{\it\Theta}})\frac{\overline{u_{i}^{n}{\it\theta}}}{U_{0}^{n}{\it\Theta}_{0}}+{\it\xi}\frac{\text{d}\left(\;\overline{u_{i}^{n}{\it\theta}}/U_{0}^{n}{\it\Theta}_{0}\;\right)}{\text{d}{\it\xi}}\right].\end{eqnarray}$$
In the present experiment, the distribution of
 ${\it\Theta}_{j}/{\it\Theta}_{0}$
in the self-similar region has virtual origin
 $x_{0_{{\it\theta}}}/D=1.649$
, leading to
 ${\it\beta}_{{\it\theta}}=1.015$
at
 $x/D=30$
.
The parameters
 ${\it\beta}_{U}$
and
 ${\it\beta}_{{\it\theta}}$
are dependent on the streamwise location considered. For large
 $x/D$
values, these parameters both converge towards unity and full self-similarity can be considered. For example, in the present experiment, at
 $x/D=100$
,
 ${\it\beta}_{U}$
and
 ${\it\beta}_{{\it\theta}}$
differ from unity by less than 0.5 %, and at these locations their consideration is no longer needed (as in Wygnanski & Fiedler Reference Wygnanski and Fiedler1969; Panchapakesan & Lumley Reference Panchapakesan and Lumley1993a
; Hussein et al.
Reference Hussein, Capp and George1994). When only the velocity field is under investigation, measurements are usually performed far downstream. However, as pointed out by Chevray & Tutu (Reference Chevray and Tutu1978), when temperature has to be measured, it is necessary to consider streamwise locations closer to the nozzle exit. This is due to the fact that temperature excess at the nozzle exit is limited (in order to consider temperature as a passive contaminant) and that a reasonable signal-to-noise ratio cannot be obtained too far downstream. Similar to the present case, AM made their measurements at
 $x/D=30$
. Had they used the present terminology, their parameters would have been
 ${\it\beta}_{U}=1.026$
and
 ${\it\beta}_{{\it\theta}}=1.034$
. Thus, the present terminology should be used for the purpose of evaluating streamwise gradients if one aims to take into account the effects of initial conditions. It is clear from what is reported in the literature (see e.g. Malmström et al.
Reference Malmström, Kirkpatrick, Christensen and Knappmiller1997; Mi et al.
Reference Mi, Nobes and Nathan2001) that initial conditions do affect the values of the virtual origin observed in the distributions of different quantities such as
 $U_{0}$
,
 ${\it\Theta}_{0}$
and
 $R_{U}$
. In the present case, the parameters
 ${\it\beta}_{U}$
and
 ${\it\beta}_{{\it\theta}}$
only differ from unity by less than 2 % and their effects are almost negligible. However, all the streamwise derivatives presented in this paper are estimated using this terminology and the results obtained in this way are considered as being self-similar quantities.
A.2.2. Normalized and self-preserving form of the
$k$
budget

The dimensional form of the
 $k$
budget presented in (5.2) is normalized by dividing the terms
 $C_{k}$
,
 $P_{k}$
,
 $D_{k}$
,
 ${\it\Pi}_{k}$
and
 ${\it\epsilon}_{k}$
by
 $U_{0}^{3}/R_{U}$
. Using the terminology from § A.2.1, these terms can be written as
 $$\begin{eqnarray}\displaystyle C_{k}\hspace{2.22198pt}\frac{R_{U}}{U_{0}^{3}} & = & \displaystyle B_{R_{U}}\frac{\overline{U}}{U_{0}}\left[2{\it\beta}_{U}\hspace{2.22198pt}\frac{k}{U_{0}^{2}}+{\it\xi}\frac{\text{d}}{\text{d}{\it\xi}}\left(\frac{k}{U_{0}^{2}}\right)\right]-\frac{\overline{V}}{U_{0}}\hspace{2.22198pt}\frac{\text{d}}{\text{d}{\it\xi}}\left(\frac{k}{U_{0}^{2}}\right),\end{eqnarray}$$
 $$\begin{eqnarray}\displaystyle P_{k}\hspace{2.22198pt}\frac{R_{U}}{U_{0}^{3}} & = & \displaystyle B_{R_{U}}\frac{\overline{u^{2}}}{U_{0}^{2}}\left[{\it\beta}_{U}\hspace{2.22198pt}\frac{\overline{U}}{U_{0}}+{\it\xi}\frac{\text{d}}{\text{d}{\it\xi}}\left(\frac{\overline{U}}{U_{0}}\right)\right]-\frac{\overline{v^{2}}}{U_{0}^{2}}\hspace{2.22198pt}\frac{\text{d}}{\text{d}{\it\xi}}\left(\frac{\overline{V}}{U_{0}}\right)-\frac{1}{{\it\xi}}\frac{\overline{V}}{U_{0}}\hspace{2.22198pt}\frac{\overline{w^{2}}}{U_{0}^{2}}\nonumber\\ \displaystyle & & \displaystyle -\,\frac{\overline{uv}}{U_{0}^{2}}\left[\frac{\text{d}}{\text{d}{\it\xi}}\left(\frac{\overline{U}}{U_{0}}\right)-B_{R_{U}}\left({\it\beta}_{U}\hspace{2.22198pt}\frac{\overline{V}}{U_{0}}+{\it\xi}\frac{\text{d}}{\text{d}{\it\xi}}\left(\frac{\overline{V}}{U_{0}}\right)\right)\right],\end{eqnarray}$$
 $$\begin{eqnarray}\displaystyle D_{k}\hspace{2.22198pt}\frac{R_{U}}{U_{0}^{3}} & = & \displaystyle B_{R_{U}}\left[3{\it\beta}_{U}\hspace{2.22198pt}\frac{\overline{ku}}{U_{0}^{3}}+{\it\xi}\frac{\text{d}}{\text{d}{\it\xi}}\left(\frac{\overline{ku}}{U_{0}^{3}}\right)\right]-\frac{1}{{\it\xi}}\hspace{2.22198pt}\frac{\text{d}}{\text{d}{\it\xi}}\left({\it\xi}\hspace{2.22198pt}\frac{\overline{kv}}{U_{0}^{3}}\right),\end{eqnarray}$$
 $$\begin{eqnarray}\displaystyle {\it\Pi}_{k}\hspace{2.22198pt}\frac{R_{U}}{U_{0}^{3}} & = & \displaystyle -\frac{2}{5}\hspace{2.22198pt}D_{k}\hspace{2.22198pt}\frac{R_{U}}{U_{0}^{3}}\quad \text{(Lumley's model)},\end{eqnarray}$$
 $$\begin{eqnarray}\displaystyle {\it\epsilon}_{k}\hspace{2.22198pt}\frac{R_{U}}{U_{0}^{3}} & = & \displaystyle (C_{k}+P_{k}+D_{k}+{\it\Pi}_{k})\hspace{2.22198pt}\frac{R_{U}}{U_{0}^{3}}\quad \text{(inferred from balance)}.\end{eqnarray}$$
 $\overline{u_{i}u_{j}}$
budgets are derived the same way.
A.2.3. Normalized and self-preserving form of the
$\overline{{\it\theta}^{2}}/2$
budget

The dimensional form of the
 $\overline{{\it\theta}^{2}}/2$
budget presented in (5.19) is normalized by dividing the terms
 $C_{{\it\theta}}$
,
 $P_{{\it\theta}}$
,
 $D_{{\it\theta}}$
and
 ${\it\epsilon}_{{\it\theta}}$
by
 $(U_{0}{\it\Theta}_{0}^{2})/R_{U}$
. Using the terminology from § A.2.1, these terms can be written as
 $$\begin{eqnarray}\displaystyle & \displaystyle C_{{\it\theta}}\hspace{2.22198pt}\frac{R_{U}}{U_{0}{\it\Theta}_{0}^{2}}=\frac{1}{2}\hspace{2.22198pt}B_{R_{U}}\frac{\overline{U}}{U_{0}}\left[2{\it\beta}_{{\it\theta}}\hspace{2.22198pt}\frac{\overline{{\it\theta}^{2}}}{{\it\Theta}_{0}^{2}}+{\it\xi}\frac{\text{d}}{\text{d}{\it\xi}}\left(\frac{\overline{{\it\theta}^{2}}}{{\it\Theta}_{0}^{2}}\right)\right]-\frac{1}{2}\hspace{2.22198pt}\frac{\overline{V}}{U_{0}}\hspace{2.22198pt}\frac{\text{d}}{\text{d}{\it\xi}}\left(\frac{\overline{{\it\theta}^{2}}}{{\it\Theta}_{0}^{2}}\right), & \displaystyle\end{eqnarray}$$
 $$\begin{eqnarray}\displaystyle & \displaystyle P_{{\it\theta}}\hspace{2.22198pt}\frac{R_{U}}{U_{0}{\it\Theta}_{0}^{2}}=B_{R_{U}}\frac{\overline{u{\it\theta}}}{U_{0}{\it\Theta}_{0}}\left[{\it\beta}_{{\it\theta}}\hspace{2.22198pt}\frac{\overline{{\it\Theta}}}{{\it\Theta}_{0}}+{\it\xi}\frac{\text{d}}{\text{d}{\it\xi}}\left(\frac{\overline{{\it\Theta}}}{{\it\Theta}_{0}}\right)\right]-\frac{\overline{v{\it\theta}}}{U_{0}{\it\Theta}_{0}}\hspace{2.22198pt}\frac{\text{d}}{\text{d}{\it\xi}}\left(\frac{\overline{{\it\Theta}}}{{\it\Theta}_{0}}\right), & \displaystyle\end{eqnarray}$$
 $$\begin{eqnarray}\displaystyle & \displaystyle D_{{\it\theta}}\hspace{2.22198pt}\frac{R_{U}}{U_{0}{\it\Theta}_{0}^{2}}=\frac{1}{2}\hspace{2.22198pt}B_{R_{U}}\left[({\it\beta}_{U}+2{\it\beta}_{{\it\theta}})\hspace{2.22198pt}\frac{\overline{u{\it\theta}^{2}}}{U_{0}{\it\Theta}_{0}^{2}}+{\it\xi}\frac{\text{d}}{\text{d}{\it\xi}}\left(\frac{\overline{u{\it\theta}^{2}}}{U_{0}{\it\Theta}_{0}^{2}}\right)\right]-\frac{1}{2}\hspace{2.22198pt}\frac{1}{{\it\xi}}\hspace{2.22198pt}\frac{\text{d}}{\text{d}{\it\xi}}\left({\it\xi}\hspace{2.22198pt}\frac{\overline{v{\it\theta}^{2}}}{U_{0}{\it\Theta}_{0}^{2}}\right), & \displaystyle \nonumber\\ \displaystyle & & \displaystyle\end{eqnarray}$$
 $$\begin{eqnarray}\displaystyle & \displaystyle {\it\epsilon}_{{\it\theta}}\hspace{2.22198pt}\frac{R_{U}}{U_{0}{\it\Theta}_{0}^{2}}=(C_{{\it\theta}}+P_{{\it\theta}}+D_{{\it\theta}})\hspace{2.22198pt}\frac{R_{U}}{U_{0}{\it\Theta}_{0}^{2}}\quad \text{(inferred from balance)}. & \displaystyle\end{eqnarray}$$
A.2.4. Normalized and self-preserving forms of the turbulent heat flux budgets
The dimensional forms of the turbulent heat flux budgets in (5.22) and (5.23) are normalized by dividing the terms
 $C_{u_{i}{\it\theta}}$
,
 $P_{u_{i}{\it\theta}}$
,
 $D_{u_{i}{\it\theta}}$
and
 ${\it\epsilon}_{u_{i}{\it\theta}}$
by
 $(U_{0}^{2}{\it\Theta}_{0})/R_{U}$
. Using the terminology from § A.2.1, these terms can be written as
 $$\begin{eqnarray}\displaystyle C_{u{\it\theta}}\hspace{2.22198pt}\frac{R_{U}}{U_{0}^{2}{\it\Theta}_{0}} & = & \displaystyle B_{R_{U}}\frac{\overline{U}}{U_{0}}\left[\left[{\it\beta}_{U}+{\it\beta}_{{\it\Theta}}\right]\hspace{2.22198pt}\frac{\overline{u{\it\theta}}}{U_{0}{\it\Theta}_{0}}+{\it\xi}\frac{\text{d}}{\text{d}{\it\xi}}\left(\frac{\overline{u{\it\theta}}}{U_{0}{\it\Theta}_{0}}\right)\right]-\frac{\overline{V}}{U_{0}}\hspace{2.22198pt}\frac{\text{d}}{\text{d}{\it\xi}}\left(\frac{\overline{u{\it\theta}}}{U_{0}{\it\Theta}_{0}}\right),\nonumber\\ \displaystyle & & \displaystyle\end{eqnarray}$$
 $$\begin{eqnarray}\displaystyle P_{u{\it\theta}}\hspace{2.22198pt}\frac{R_{U}}{U_{0}^{2}{\it\Theta}_{0}} & = & \displaystyle B_{R_{U}}\frac{\overline{u{\it\theta}}}{U_{0}{\it\Theta}_{0}}\left[{\it\beta}_{U}\hspace{2.22198pt}\frac{\overline{U}}{U_{0}}+{\it\xi}\frac{\text{d}}{\text{d}{\it\xi}}\left(\frac{\overline{U}}{U_{0}}\right)\right]-\frac{\overline{v{\it\theta}}}{U_{0}{\it\Theta}_{0}}\hspace{2.22198pt}\frac{\text{d}}{\text{d}{\it\xi}}\left(\frac{\overline{U}}{U_{0}}\right)\nonumber\\ \displaystyle & & \displaystyle +\,B_{R_{U}}\frac{\overline{u^{2}}}{U_{0}^{2}}\left[{\it\beta}_{{\it\Theta}}\hspace{2.22198pt}\frac{\overline{{\it\Theta}}}{{\it\Theta}_{0}}+{\it\xi}\frac{\text{d}}{\text{d}{\it\xi}}\left(\frac{\overline{{\it\Theta}}}{{\it\Theta}_{0}}\right)\right]-\frac{\overline{uv}}{U_{0}^{2}}\hspace{2.22198pt}\frac{\text{d}}{\text{d}{\it\xi}}\left(\frac{\overline{{\it\Theta}}}{{\it\Theta}_{0}}\right),\end{eqnarray}$$
 $$\begin{eqnarray}\displaystyle D_{u{\it\theta}}\hspace{2.22198pt}\frac{R_{U}}{U_{0}^{2}{\it\Theta}_{0}} & = & \displaystyle B_{R_{U}}\left[\left(2{\it\beta}_{U}+{\it\beta}_{{\it\Theta}}\right)\frac{\overline{u^{2}{\it\theta}}}{U_{0}^{2}{\it\Theta}_{0}}+{\it\xi}\frac{\text{d}}{\text{d}{\it\xi}}\left(\frac{\overline{u^{2}{\it\theta}}}{U_{0}^{2}{\it\Theta}_{0}}\right)\right]-\frac{1}{{\it\xi}}\hspace{2.22198pt}\frac{\text{d}}{\text{d}{\it\xi}}\left({\it\xi}\hspace{2.22198pt}\frac{\overline{u^{2}{\it\theta}}}{U_{0}^{2}{\it\Theta}_{0}}\right),\qquad\end{eqnarray}$$
 $$\begin{eqnarray}\displaystyle {\it\Pi}_{u{\it\theta}}\hspace{2.22198pt}\frac{R_{U}}{U_{0}^{2}{\it\Theta}_{0}} & = & \displaystyle -\frac{2}{5}B_{R_{U}}\left[(2{\it\beta}_{U}+{\it\beta}_{{\it\Theta}})\frac{\overline{k{\it\theta}}}{U_{0}^{2}{\it\Theta}_{0}}+{\it\xi}\frac{\text{d}}{\text{d}{\it\xi}}\left(\frac{\overline{k{\it\theta}}}{U_{0}^{2}{\it\Theta}_{0}}\right)\right]\quad \text{(Lumley's model)},\nonumber\\ \displaystyle & & \displaystyle\end{eqnarray}$$
 $$\begin{eqnarray}\displaystyle {\it\Phi}_{u{\it\theta}}\frac{R_{U}}{U_{0}^{2}{\it\Theta}_{0}} & = & \displaystyle -(C_{u{\it\theta}}+P_{u{\it\theta}}+D_{u{\it\theta}}+{\it\Pi}_{u{\it\theta}})\hspace{2.22198pt}\frac{R_{U}}{U_{0}^{2}{\it\Theta}_{0}}\quad \text{(inferred from balance)},\end{eqnarray}$$
 $$\begin{eqnarray}\displaystyle C_{v{\it\theta}}\hspace{2.22198pt}\frac{R_{U}}{U_{0}^{2}{\it\Theta}_{0}} & = & \displaystyle B_{R_{U}}\frac{\overline{U}}{U_{0}}\left[[{\it\beta}_{U}+{\it\beta}_{{\it\Theta}}]\hspace{2.22198pt}\frac{\overline{v{\it\theta}}}{U_{0}{\it\Theta}_{0}}+{\it\xi}\frac{\text{d}}{\text{d}{\it\xi}}\left(\frac{\overline{v{\it\theta}}}{U_{0}{\it\Theta}_{0}}\right)\right]-\frac{\overline{V}}{U_{0}}\hspace{2.22198pt}\frac{\text{d}}{\text{d}{\it\xi}}\left(\frac{\overline{v{\it\theta}}}{U_{0}{\it\Theta}_{0}}\right)\!,\end{eqnarray}$$
 $$\begin{eqnarray}\displaystyle P_{v{\it\theta}}\hspace{2.22198pt}\frac{R_{U}}{U_{0}^{2}{\it\Theta}_{0}} & = & \displaystyle B_{R_{U}}\frac{\overline{u{\it\theta}}}{U_{0}{\it\Theta}_{0}}\left[{\it\beta}_{U}\hspace{2.22198pt}\frac{\overline{V}}{U_{0}}+{\it\xi}\frac{\text{d}}{\text{d}{\it\xi}}\left(\frac{\overline{V}}{U_{0}}\right)\right]-\frac{\overline{v{\it\theta}}}{U_{0}{\it\Theta}_{0}}\hspace{2.22198pt}\frac{\text{d}}{\text{d}{\it\xi}}\left(\frac{\overline{V}}{U_{0}}\right)\nonumber\\ \displaystyle & & \displaystyle +\,B_{R_{U}}\frac{\overline{uv}}{U_{0}^{2}}\left[{\it\beta}_{{\it\Theta}}\hspace{2.22198pt}\frac{\overline{{\it\Theta}}}{{\it\Theta}_{0}}+{\it\xi}\frac{\text{d}}{\text{d}{\it\xi}}\left(\frac{\overline{{\it\Theta}}}{{\it\Theta}_{0}}\right)\right]-\frac{\overline{v^{2}}}{U_{0}^{2}}\hspace{2.22198pt}\frac{\text{d}}{\text{d}{\it\xi}}\left(\frac{\overline{{\it\Theta}}}{{\it\Theta}_{0}}\right),\end{eqnarray}$$
 $$\begin{eqnarray}\displaystyle D_{v{\it\theta}}\hspace{2.22198pt}\frac{R_{U}}{U_{0}^{2}{\it\Theta}_{0}} & = & \displaystyle B_{R_{U}}\left[(2{\it\beta}_{U}+{\it\beta}_{{\it\Theta}})\frac{\overline{uv{\it\theta}}}{U_{0}^{2}{\it\Theta}_{0}}+{\it\xi}\frac{\text{d}}{\text{d}{\it\xi}}\left(\frac{\overline{uv{\it\theta}}}{U_{0}^{2}{\it\Theta}_{0}}\right)\right]\nonumber\\ \displaystyle & & \displaystyle -\,\frac{1}{{\it\xi}}\hspace{2.22198pt}\frac{\text{d}}{\text{d}{\it\xi}}\left({\it\xi}\hspace{2.22198pt}\frac{\overline{v^{2}{\it\theta}}}{U_{0}^{2}{\it\Theta}_{0}}\right)+\frac{1}{{\it\xi}}\left(\frac{\overline{w^{2}{\it\theta}}}{U_{0}^{2}{\it\Theta}_{0}}\right),\end{eqnarray}$$
 $$\begin{eqnarray}\displaystyle {\it\Pi}_{v{\it\theta}}\hspace{2.22198pt}\frac{R_{U}}{U_{0}^{2}{\it\Theta}_{0}} & = & \displaystyle \frac{2}{5}\frac{\text{d}}{\text{d}{\it\xi}}\left(\frac{\overline{k{\it\theta}}}{U_{0}^{2}{\it\Theta}_{0}}\right)\quad \text{(Lumley's model)},\end{eqnarray}$$
 $$\begin{eqnarray}\displaystyle {\it\Phi}_{v{\it\theta}}\frac{R_{U}}{U_{0}^{2}{\it\Theta}_{0}} & = & \displaystyle -(C_{v{\it\theta}}+P_{v{\it\theta}}+D_{v{\it\theta}}+{\it\Pi}_{v{\it\theta}})\hspace{2.22198pt}\frac{R_{U}}{U_{0}^{2}{\it\Theta}_{0}}\quad \text{(inferred from balance)}.\end{eqnarray}$$