I. INTRODUCTION
High efficiency thermoelectric (TE) materials have recently received much attention due to their potential applications in power generation and refrigeration.Reference Rowe and Bhandari1,Reference Snyder and Toberer2 The performance of thermoelectric materials is represented by the dimensionless figure of merit defined as ZT = (α2/ρκ)T, where α is the Seebeck coefficient, ρ is the electrical resistivity, κ is the thermal conductivity (sum of the lattice part κL and the electronic part κe), and T is the absolute temperature. Therefore, a high Seebeck coefficient, a low resistivity, and a low thermal conductivity are required for achieving a high ZT. Some compounds, such as Bi2Te3-based alloys, PbTe and filled skutterudites have maximum ZT > 1.Reference Hu, Gao, Liu, Xie, Shen, Zhu and Zhao3–Reference Shi, Yang, Salvador, Chi, Cho, Wang, Bai, Yang, Zhang and Chen5
As a paradigm of III–V compounds, InSb crystallizes in a zinc blende structure and has a direct band gap of 0.18 eV at 300 K and 0.23 eV at 80 K. With the highest mobility among III–V compounds (∼7 × 105 cm2/Vs at 77 KReference Trifonov and Yaremenko6 and ∼7 × 104 cm2/Vs at 300 KReference Hrostowski, Morin, Geballe and Wheatley7,Reference Volokobinskaya, Galavanov and Nasledov8 ), InSb materials feature good electrical transport properties and have been widely used in commercialized optical devicesReference Hishiki, Kanno, Sugiura, Xiang, Nakamura and Katagiri9–Reference Nesher, Elkind, Adin, Nevo, Yaakov, Raichshtain, Marhasev, Magner, Katz, Markovitz, Chen, Kenan, Ganany, Schlesinger and Calahorra11 and fast transistors.Reference Liu, Lee, Liu, Sun and Yang12–Reference Orr, Buckle, Fearn, Wilding, Bartlett, Emeny, Buckle and Ashley14 As proposed by Bowers et al.Reference Bowers, Ure, Bauerle and Cornish15 InSb materials have great potential in thermoelectric applications due to their high quality factor B defined as B = μ/κL(m n/m 0)3/2, which is an important parameter in searching for promising thermoelectric materials,Reference Heikes and Ure16 where μ is the mobility of carriers, κL is the lattice thermal conductivity, m n is the density of state effective mass, and m 0 is the free electron mass.
The highest ZT of 0.5 has been obtained in Te-doped n-type InSb with a carrier concentration of 5 × 1017 cm−3,Reference Yamaguchi, Matsumoto, Yamazaki, Kaiwa and Yamamoto17 however, which is still far below the criteria for a practice use. In this regard, new routes are required to develop high efficiency InSb-based materials. Recently, nanostructuring as an effective approach, has broken the “ZT ∼ 1” barrier for traditional TE materials. As demonstrated by previous work,Reference Zhang, He, Zhu, Zhang, Zhao and Tritt18–Reference Androulakis, Lin, Kong, Uher, Wu, Hogan, Cook, Caillat, Paraskevopoulos and Kanatzidis21 thermoelectric nanocomposites are believed to be a promising route in improving thermoelectric performance by scattering phonons more effectively than electrons.Reference Sharp, Poon and Goldsmid22
Previous results demonstrate that NiSb forms a nonsoluble second phase in the InSb matrix, and the morphology of composites by directional solidification varies with the fraction of the second phase.Reference Umehara and Koda23–Reference Paul and Weiss25 The eutectic composition of InSb–NiSb pseudobinary alloys lies at 1.8 wt% NiSb (∼2.5 at.% NiSb).Reference Walter, Cline and Koch26 In this paper, we choose (InSb)100−x(NiSb)x (x = 0, 1, 2.5, and 10) composites from hypoeutectic to hypereutectic compositions with different sizes and morphologies of the second phase for investigation. Microstructural characterizations show that in water-quenched (WQ) samples, the NiSb second phase distributes evenly in the InSb matrix, in the form of dendrites or fibers with the size changing from several hundreds of micrometers to several nanometers. Additionally, the melt spinning (MS) technique with higher cooling speed, followed by spark plasma sintering (SPS) processing, is applied to the WQ eutectic ingot. The NiSb second phase is characteristic of sphere-like nanoparticles with a diameter of ∼200 nm. The transport properties, α, ρ, and κ, for the samples are presented from 80 to 630 K, and the effect of the microstructure on thermoelectric properties is studied.
II. EXPERIMENTAL
Stoichiometric amounts of single element In, Sb, and Ni with 99.999% purity were weighed, mixed, and then sealed in quartz tubes for the (InSb)100−x(NiSb)x (x = 0, 1, 2.5, and 10) compositions. The admixture was melted and water was quenched to room temperature. To gain a larger cooling rate, part of the quenched eutectic ingot (x = 2.5) was rapidly solidified by MS at a speed of 30 m/s. The melt spinning (MS) eutectic sample was then grinded to fine powder and spark plasma sintered at 723 K for 30 min to form a  $\phi$12.6-mm pellet.
The phase structure of the powders and sintered samples was studied by x-ray diffraction (XRD) on a Rigaku D/MAX-2550PC diffractometer using Cu Kα radiation (λ = 1.5406 Å), and the composition identification was conducted by electron probe microanalysis (EPMA; Rigaku, Tokyo, Japan) on a JEOL JXA-8100 microscope (JEOL Ltd., Tokyo, Japan). Scanning electron microscopy (SEM) images were taken using a ZEISS Ultra 55 system (Carl Zeiss Microscopy GmbH, Jena, Germany).
The samples for transport measurements were cut into parallelepipeds of 2 × 2 × 8 mm from the ingots in the radial direction using a diamond saw. The electrical properties (n, S, and ρ) (80–620 K) and low temperature (80–200 K) thermal conductivity κ were simultaneously measured in a liquid nitrogen-cooled conventional flow cryostat as described in Ref. Reference Heremans, Thrush and Morelli27. Hall coefficient R H was measured and the carrier concentration n was calculated by  $n = - {\textstyle{1 \over {e{R_{\rm{H}}}}}}$. The measurement inaccuracies mainly come from the sample dimensions, such as the distance between the longitudinal voltage probes and the sample cross section. The errors on ρ, S, and R H are about 7, 3, and 5%, respectively. The error of thermal conductivity below 200 K depends on the ratio of the actual thermal conductivity and the radiation loss in the measurement. In the case of InSb, the actual thermal conductivity below 200 K is much above 10 W/m/K and the error of measurement is below 10%. The thermal conductivity κhigh from room temperature to 623 K was calculated by using κhigh = DρDC P, where ρD is the sample density estimated by an ordinary dimensional and weight measurement procedure, and C P is calculated by Dulong–Petit law. Disks of samples were cut from the ingots in the radial direction. Thermal diffusivity was measured on 10/12.6-mm-diameter disks with a thickness of 1.5–2 mm in a Netzsch LFA 457 system (Netzsch Instruments Ltd., Selb, Germany). Error in κhigh measurement is dominated by both thermal diffusivity error (5%) and uncertainties in the determination of density (3%), and the overall error is about 8% over the entire temperature range. All the thermoelectric properties are measured on the same sample, and no anisotropy is observed in the measurements.
III. RESULTS AND DISCUSSION
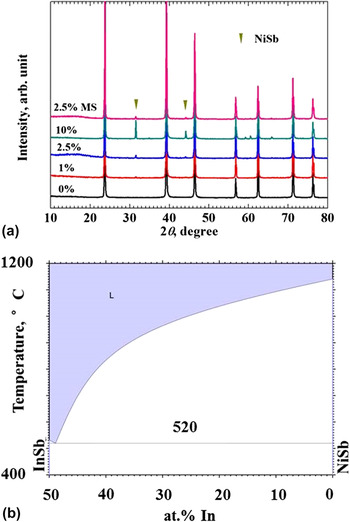
The XRD patterns of the WQ and MS samples in Fig. 1(a) show distinct InSb (space group F-43m) and NiSb (space group P63/mmc) peaks. The intensities of NiSb phase peaks increase with increasing content of NiSb in the nominal compositions, which is in accordance with the phase diagram in which these two phases are nonsoluble in Fig. 1(b).Reference Aliev, Aliev and Abdinova28 This is further verified by the EPMA composition and microstructure analysis.
(a) XRD patterns of WQ and MS samples, and (b) phase diagram of InSb–NiSb.
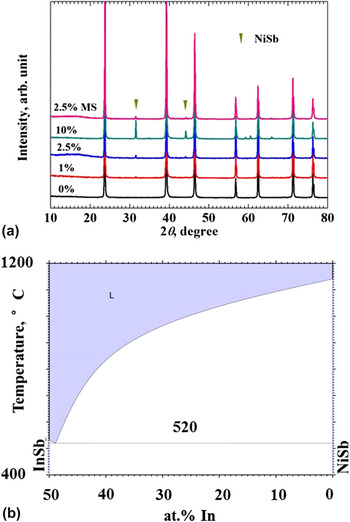
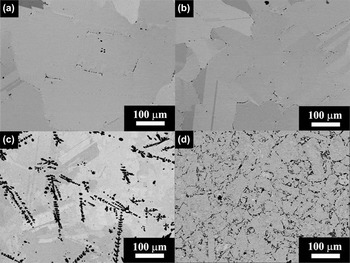
Figure 2 shows the distribution and morphology of the NiSb second phase in water-cooled and MS samples. No obvious second phase was observed in hypoeutectic and eutectic samples (x = 1 and 2.5), as shown in Figs. 2(a) and 2(b), while dendritic NiSb with no preferred orientation was identified in hypereutectic samples (x = 10) in the backscattering electron image [Fig. 2(c)]. On the other hand, the particle sizes of MS + SPS processing are ∼30 to 100 μm, smaller than that of the WQ counterpart.
EPMA backscattering images of WQ cooled samples from hypoeutectic to hypereutectic compositions with (a) 1%, (b) 2.5%, and (c) 10% NiSb, and (d) MS + SPS sample (x = 2.5).

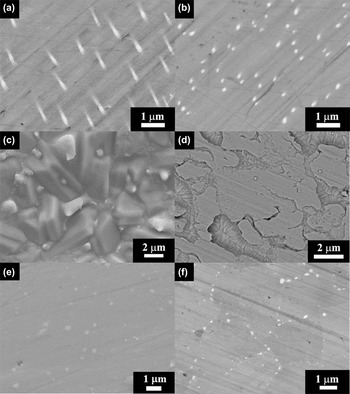
The SEM observation was used to further identify the micromorphology of the sample with InSb–NiSb eutectic composition (x = 2.5), as shown in Fig. 3. The NiSb second phase was observed in both WQ and MS samples, but the morphology and the distribution were significantly different, as shown in Figs. 2(b), 3(a), and 3(b). At the edge part of the WQ sample (x = 2.5), NiSb distributes as the nanofiber of about 100 nm in diameter and 1 μm in length, in Fig. 3(a). While at the center, the second phase is spherical. Compared with the undirectionally solidified eutectic composition by the Bridgman method,Reference Ahn and Moon29 the WQ sample preserves a similar morphology at the edge, but the nanofibers observed are much finer and the morphology changes to sphere-like at the center. This can be explained by the difference in the temperature gradient from outside to inside in WQ processing. When the melt is dropped into water vertically, the melt adjacent to the quartz ampoule is cooled down first and the gradient of temperature difference is along the radial direction. But for the center part of melt, the temperature difference is much smaller and nearly isotropic as the NiSb phase precipitates. The grain size of the MS + SPS sample is ∼5 μm [Fig. 3(f)], which is much smaller than that by the WQ method, as shown in Fig. 2(b), demonstrating MS processing is effective in reducing the grain size.
Back scattering images (BSI) images of (InSb)97.5(NiSb)2.5 eutectic composition prepared by WQ and MS + SPS methods. (a) The border and (b) center of the WQ sample. SEM images of MS cooled samples on (c) free surface and (d) contact surface of the MS ribbon. (e) SEM and (f) BSI of MS + SPS sample.

On the other hand, no NiSb second phase was observed on the free surface or contact surface of the MS ribbon of eutectic composition, as shown in Figs. 3(c) and 3(d). The cooling rate of MS is so high that no NiSb precipitates and even thermodynamically stable single phases can be formed. During the SPS process, the NiSb second phase precipitates out of the unstable matrix as sphere-like particles ∼200 nm instead of fiber shape and evenly distributes on the grain boundary of InSb, as shown in Figs. 3(e) and 3(f). The phenomenon may be caused by the low melting point of InSb. Due to the large current applied in SPS processing, the grain boundary of InSb easily remelts and migrates. The melting point of NiSb (1413 K) is much higher than that of InSb (798 K).Reference Aliev, Aliev and Abdinova28 During the grain growth of InSb, NiSb nanoparticles act as potential barriers and the grain boundary is pinned by the NiSb nanoparticles. Thus the NiSb nanoparticles are mainly distributed on the grain boundaries.
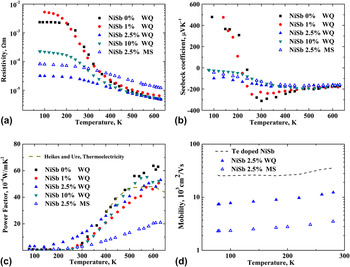
Temperature-dependent electrical properties are presented in Fig. 4. For WQ hypoeutectic samples (x = 0 and 1), α is positive at low temperatures, and with increasing temperature, a p- to n-type transition happens at ∼250 K, indicating that electrons dominate the electrical conduction at high temperatures. For eutectic and hypereutectic samples (x = 2.5 and 10), α is negative and increases with increasing temperature. The maximum α decreases with increasing NiSb content. It has been suggested that the metallic/semimetallic second phase in a semiconductor host can contribute electrons to the matrix.Reference Heremans, Thrush and Morelli20,Reference Driscoll, Hanson, Kadow and Gossard31–Reference Zide, Klenov, Stemmer, Gossard, Zeng, Bowers, Vashaee and Shakouri33 So, although the NiSb second phase is not a dopant in InSb, it still increases the carrier concentration. As shown in Fig. 4(a), the electrical resistivity ρ decreases with increasing NiSb content, which is in conjunction with the associated change of the α behavior in Fig. 4(b).
(a) Electrical resistivity, (b) Seebeck coefficient, and (c) power factor of the WQ and MS + SPS samples. (d) Mobility of the eutectic samples prepared by the WQ and MS + SPS methods. The dashed line is the mobility of Te-doped InSb.Reference Rupprecht, Weber and Weiss30

The power factor α2/ρ of InSb–NiSb composites is plotted in Fig. 4(c), which is compared with that of pure InSb reported by Driscoll et al.Reference Driscoll, Hanson, Kadow and Gossard31 With increasing NiSb content, the power factor increases at low temperatures, especially for the eutectic samples. But in the range of ∼600 K, the NiSb second phase results in a reduction in the electrical power factor due to the degraded Seebeck coefficient.
Compared with the WQ eutectic composition, the resistivity of the MS sample has a notable increase. The carrier concentrations of the WQ and MS eutectic samples (x = 2.5) are 2.2 × 10¹⁷ and 2.8 × 1017 cm−3 at room temperature, respectively, indicating a slight increase in the defect content during the MS process. The increase in the carrier concentration reduces the Seebeck coefficient. The mobility of eutectic composition prepared by both WQ and MS methods is compared with that of the Te-doped InSb with a carrier concentration of 2 × 1017 cm−3 prepared by furnace cooling.Reference Rupprecht, Weber and Weiss30 The mobility is decreased dramatically for the eutectic samples. The reduction has two origins. One is that by fast cooling, the grain size of the InSb matrix is significantly reduced. On the other hand, the fine dispersion of the NiSb phase in the boundary of the InSb matrix would also scatter both electrons and phonons. The reduction in the mobility results in the increase in the electrical resistivity of the MS sample.
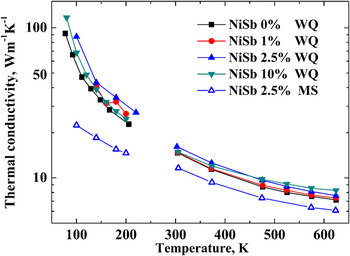
An estimate by Wiedemann–Franz law shows that electronic thermal conductivity is negligibly small, and therefore, the total thermal conductivity may be considered to be mainly due to the lattice contribution. The low and high temperature thermal conductivity, κcryo and κhigh, of all samples are presented in Fig. 5. The two sets of data fit with each other very well and demonstrate that the thermal conductivity first increases with the composition up to the eutectic point and decreases as NiSb content increases further. The gap between low and high temperature thermal conductivity data is caused by the instrumental limits. For the eutectic composition (x = 2.5), the thermal conductivity of the MS sample is significantly lower than that of the WQ one. As shown in Fig. 3, the MS + SPS eutectic sample (x = 2.5) has much smaller grain sizes. The finer grain sizes can enhance phonon scattering at the grain boundaries. On the other hand, in the MS + SPS sample, NiSb nanoparticles (<100 nm) are evenly distributed on the grain boundaries. This kind of microstructure can provide an additional scattering for the mid-wave length to long-wave length phonons at the interfaces between InSb matrix and NiSb nanoparticles,Reference Kanatzidis34,Reference Sootsman, Chung and Kanatzidis35 contributing to the marked reduction in thermal conductivity κ.
Thermal conductivity of the WQ and MS + SPS samples from 80 to 625 K. The thermal conductivities at low and high temperatures were measured by cryostat and LFA 457, respectively.

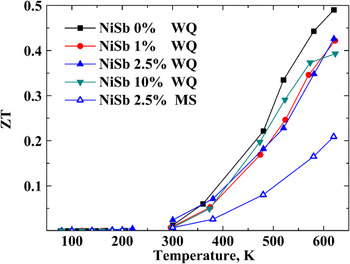
Figure 6 shows the figure of merit ZT of the all the samples. ZT values of all the samples are very low below 300 K but increase remarkably at higher temperatures. Compared to the InSb matrix, the ZT of the samples with the NiSb second phase is lower. For the eutectic samples, ZT is significantly reduced after the MS process because of the loss in mobility.
Figure of merit ZT of the samples with compositions ranging from hypoeutectic to hypereutectic.

IV. CONCLUSIONS
The morphology and TE properties of (InSb)100−x(NiSb)x (x = 0, 1, 2.5, and 10) samples from hypoeutectic to hypereutectic compositions are reported in this paper. NiSb second phases of different morphologies and scales are observed in the samples. The NiSb second phase in hypereutectic samples is dendritic, whereas NiSb in eutectic WQ samples is in the shape of nanofibers at the edge part of the sample and sphere at the center. The grain sizes of the eutectic composition are reduced significantly by MS, and the NiSb second phase is characteristic of sphere-like nanoparticles of ∼200 nm in diameter. Compared to the WQ eutectic sample, the MS process results in a slight increase in carrier concentration and a remarkable reduction in mobility. The MS process also results in a significant reduction in the thermal conductivity due to the enhancement in the phonon scattering at the grain boundaries and InSb–NiSb interfaces. However, ZT is significantly reduced after the MS process because of the loss in mobility. And ZT of the InSb matrix is the highest of all the samples, ∼0.5 at 600 K.
ACKNOWLEDGMENTS
We would like to thank Prof. J.P. Heremans from Ohio State University for the measurement of low temperature thermoelectric properties. This work is supported by the Nature Science Foundation of China (Grant Nos. 51061120455 and 51171171), the Ph.D. program Foundation of Ministry of Education of China (Grant Nos. 20120101110082 and 20110101110024), and the Program for New Century Excellent Talents in University (Grant No. NCET-12-0495).