INTRODUCTION
Much research on the evolutionary ecology of host-parasite interactions has been driven by considering how host and parasite behaviours will influence lifetime reproductive success. For parasites this research has focused on trade-offs associated with patterns of virulence and transmission (e.g. Anderson and May, Reference Anderson and May1982; May and Anderson, Reference May and Anderson1983). For hosts, the research has focused on life-history trade-offs that maximize future reproductive success by minimizing the effects of parasitism on fitness components such as survival, growth and currrent reproduction. The majority of such studies have focused on unitary, exclusively sexually-reproducing animal hosts such as Drosophila (e.g. Fellowes et al. Reference Fellowes, Kraaijeveld and Godfray1998), other non-social insects (e.g. Bradley and Altizer, Reference Bradley and Altizer2005; Jacot et al. Reference Jacot, Scheuber, Kurtz and Brinkhof2005; Ahmed and Hurd, Reference Ahmed and Hurd2006), snails (e.g. Webster and Woolhouse, Reference Webster and Woolhouse1999, Fredensborg and Poulin, Reference Fredensborg and Poulin2006) and vertebrates (e.g. Norris and Evans, Reference Norris and Evans2000; Fox and Hudson, Reference Fox and Hudson2001). However, to achieve a general overview of the evolutionary ecology of hosts and parasites, it is important to study a range of systems. Trade-offs associated with parasitism in hosts that incorporate parthenogenesis in their life-histories have been investigated in bumble bees (Moret and Schmid-Hempel, Reference Moret and Schmid-Hempel2001; Brown et al. Reference Brown, Schmid-Hempel and Schmid-Hempel2003) and Daphnia clones (Decaestecker et al. Reference Decaestecker, De Meester and Ebert2002). To date, however, there is a notable lack of studies on life-history strategies and trade-offs driven by parasitism in colonial animals.
Coloniality is achieved by the iteration of budded modules which remain physiologically connected. It is a major reproductive mode, occurring in numerous aquatic taxa, including corals, ascidians, sponges, and bryozoans. The spreading vegetative growth achieved by coloniality can result in potentially long-lived and genetically-uniform colonies that may themselves undergo replication through, for example, fragmentation or fission (Jackson and Coates, Reference Jackson and Coates1986). The lack of studies of parasitism in colonial animals is surprising since the dynamics of colony growth and replication can result in a genetically homogeneous host resource available for exploitation by parasites and because parasites transmitted between close relatives are expected to evolve lower virulence than parasites transmitted between non-related individuals (May and Anderson, Reference May and Anderson1983; Herre, Reference Herre1995). The patterns and processes of parasitism in populations of colonial organisms are therefore of general interest.
This study begins to redress the lack of knowledge about life-history strategies and trade-offs driven by parasitism in colonial hosts by focusing on a novel host-parasite system, the freshwater bryozoan Lophopus crystallinus (Phylum Bryozoa; Class Phylactolaemata) and its currently undescribed malacosporean parasite belonging to the genus Buddenbrockia (Phylum Myxozoa; Class Malacosporea) (Tops et al. Reference Tops, Lockwood and Okamura2006), henceforth referred to as Buddenbrockia sp. The questions we address are (1) what are the patterns of host exploitation over space and time? (2) what are the effects of parasitism on hosts? (3) can we identify life-history strategies of colonial hosts and their endoparasites? and (4) do colonial hosts offer unique opportunities for exploitation by parasites?
MATERIALS AND METHODS
The host-parasite system
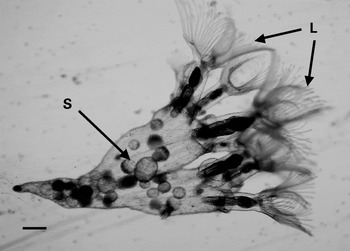
Lophopus crystallinus is a rare freshwater bryozoan (see Fig. 1) and is listed in the British Red Data Book of Invertebrates Other than Insects (Bratton, Reference Bratton1991). The life history entails extensive asexual reproduction through: the budding of modules (zooids) which increases colony size; colony fission; and the production of dormant seed-like stages (statoblasts). Dispersal is achieved locally through the movement of daughter colonies (in the order of cms) following fission and over larger spatial scales through the release of floating statoblasts. Sexual reproduction is brief and entails the release of short-lived swimming larvae in early summer. It is apparently rare in many phylactolaemate populations (Wood and Okamura, Reference Wood and Okamura2005), and this may be the case for L. crystallinus since larvae have never been observed during seasonal monitoring of the 2 UK populations (Barton Blow Wells and the Chil Brook; see below) (S. Hill, unpublished data).
Numerous parasitic sacs (S) of Buddenbrockia sp. n. within the coelomic cavity of Lophopus crystallinus. The extended lophophores (L) are used for suspension feeding. Scale bar=200 μm.

Malacosporeans (Phylum Myxozoa, Class Malacosporea) are a group of microscopic endoparasites of freshwater bryozoans that have only recently been described (see Canning and Okamura, Reference Canning and Okamura2004 for review). During covert infection they occur as cryptic stages (single cells) associated with the bryozoan body wall (Tops and Okamura, Reference Tops and Okamura2003; Tops et al. Reference Tops, Lockwood and Okamura2006). Overt infection entails the proliferation of multicellular, spore-producing stages in the bryozoan body cavity which are sac-like, as in the parasite here, or worm-like (Okamura and Canning, Reference Okamura and Canning2003; Tops et al. Reference Tops, Lockwood and Okamura2006). The gelatinous, semi-transparent nature of L. crystallinus colonies allows the direct detection of overt infections by stereomicroscopical examination using transmitted light. The sac-like parasitic stages are readily identified as their sizes range up to 300 μm and they tumble about in the general ciliary-driven circulation of the host coelomic fluid (see Fig. 1). The single cells that cause covert infections are not visible by standard stereomicroscopical examination and thus require special detection by, for example, histology or PCR. Spores escape from sacs within the bryozoan hosts and are then released into the water column. Transmission studies of the related malacosporean Tetracapsuloides bryosalmonae, confirm that spores are infective to salmonid fish and cause proliferative kidney disease (Feist et al. Reference Feist, Longshaw, Canning and Okamura2001) and provide no evidence for direct spore-mediated transmission of infection from bryozoan-to-bryozoan (Tops et al. Reference Tops, Baxa, McDowell, Hedrick and Okamura2004). The fate of spores released by the parasite studied here is unknown.
Study material
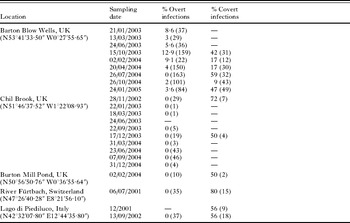
Colonies of L. crystallinus were sampled from 3 sites in the UK (Barton Blow Wells, the Chil Brook and Burton Mill Pond) and from the River Fürtbach in Switzerland and the Lago di Piediluco in Italy (see Table 1). Colonies are loosely attached to surfaces and can therefore be collected without damage by gently prising them off the substratum. The previously known populations at Barton Blow Wells and the Chil Brook (Bratton, Reference Bratton1991) were regularly sampled (approximately every 90 days) over a 2-year period. In view of the rarity status of L. crystallinus in the UK, colonies were collected at each UK site in numbers proportional to the numbers encountered on different substrata. At Barton Blow Wells substrata include submerged logs, branches, twigs and fallen leaves. At the Chil Brook substrata include hollows on the undersides of rocks, and submerged branches, twigs and litter. Collections from other sites were opportunistic. At Burton Mill Pond colonies were collected from a single rock and a submerged log, in the River Fürtbach they were sampled from the undersides of rocks, and in the Lago di Piediluco they were gathered from stems of Phragmites sp., other macrophytes, floating vegetative debris, and plastic rubbish. At these European sites single colonies were collected from separate substrata.
Field sampling data describing locations, dates and prevalences (%) of overt and covert infections (and the number of colonies assessed)
(Overt infection status was assessed by microscopical examination of colonies and covert infection status by undertaking PCR analysis.)

Patterns of prevalence
Following collection, colonies were placed in Petri dishes along with source water and examined using a stereomicroscope to identify overt infections (the presence of parasitic sacs in the body cavity), with the exception of the colonies from the first of the 2 collections from Lago di Piediluco when no microscope was available. The entire colony was carefully examined for the presence of parasitic sacs using 12× magnification (25× when closer inspection was merited). In general, the tumbling movements of numerous sacs circulating in the host's body cavity makes overt infection immediately obvious (see Fig. 1). However, colonies were always examined for up to 1 min to ensure detection of cases where sac development was sparse. It is possible that very early sac stages or the presence of low numbers of spores could occasionally have been overlooked.
Subsets of colonies which showed no overt infections were randomly selected for polymerase chain reaction (PCR) analysis to assess prevalence of covert infections. We particularly focused our investigations on colonies from Barton Blow Wells as this population provided material for our mesocosm-based investigations of effects of infection. For this site we undertook PCR assays of material collected over a 15-month period (see Table 1). We conducted more limited PCR assays of material from all other sites (see Table 1). The selected colonies were placed individually in distilled water for at least 24 h and then rinsed in distilled water. This treatment minimized the possibility of contamination by parasite spores due to exposure to colonies with overt infections just prior to or following collection. (Spores produced by the closely related malacosporean, Tetracapsuloides bryosalmonae, degenerate in water in less than 24 h; de Kinkelin et al. Reference de Kinkelin, Gay and Forman2002.) Note that such contamination is improbable since spores are only likely to attach to appropriate hosts. The colonies were then placed in 100% EtOH and stored at −20°C. The procedure to minimize spore contamination was not conducted for selected colonies from the River Fürtbach and Lago di Piediluco prior to PCR analysis (see Table 1). However, as no overt infections were observed in colonies from the River Fürtbach or from Lago di Piediluco (on 13/09/02) this material may not have been exposed to contamination.
DNA was extracted using the modified CTAB method as described by Tops and Okamura (Reference Okamura and Canning2003). We designed primers that specifically amplified a 550 bp portion of the 18S rDNA sequence of the L. crystallinus parasite that was first sequenced by Tops et al. (Reference Tops, Curry and Okamura2005) (LP3, forward: 5′-ATC GCT ACC ACA TCT AAG GAA GG-3′ and LP4, reverse: 5′-CAA ATG CTT TCG CTT TAG TTC GAC-3′). While the primers we used will be diagnostic of malacosporeans (Tops et al. Reference Tops, Curry and Okamura2005) we did not test whether they are species-specific. PCR amplifications were carried out in 10 μl reactions containing: ∼100 ng of genomic DNA, 1X Buffer (Bioline), 2·5 mm MgCl2, 0·2 mm of each dNTP, 1 μm of each primer, and 1 U of Taq polymerase (Bioline). The cycling scheme was: 94°C for 4 min, 30 cycles at 94°C for 45 s, 60°C for 45 s, 72°C for 45 s, and a final extension step of 72°C for 10 min. DNA collected from visually infected colonies was employed for positive controls, and deionized water was used for negative controls. Bands of amplified parasite DNA were visualized using 2% TAE agarose gels stained with ethidium bromide. The presence of a band is indicative of infection by cryptic parasite stages.
To determine whether parasite stages can be incorporated in statoblasts, 10 statoblasts collected from cultured colonies (see next section) were tested for the presence of parasite DNA. Seven statoblasts were obtained from 5 colonies that were descendants of material collected from Barton Blow Wells (1 colony collected on 26/10/2004, 4 colonies collected on 15/10/2003), and 3 were produced by 2 colonies that were descendants of material from the Chil Brook (collected on 22/09/2003). All statoblasts were collected after their natural release from cultured colonies in which overt infections had never been observed by microscopical examination. The statoblasts were stored in distilled water at 4°C for between 5 and 17 months and were then germinated by immersion in artificial pond water (Wood, Reference Wood1996) in a Petri dish under ambient laboratory conditions. Once a single zooid was fully developed (when the lophophore [tentacular feeding crown] was fully extended after approximately 12 days), the small colonies were removed from statoblast valves, placed in 100% EtOH and stored at −20°C.
To confirm that PCR amplified products were representative of myxozoan parasites, 15 amplified products were randomly selected for cloning and sequencing (5 colonies from Barton Blow Wells, 3 colonies from Chil Brook, 1 colony from Burton Mill Pond, 3 colonies from the River Fürtbach, 2 statoblast-hatched colonies from Barton Blow Wells; 1 statoblast-hatched colony from the Chil Brook). Amplified products were inserted into T-Easy vector (Promega) and forward and reverse sequences were produced using fluorescently labelled universal primer M13 within a standard reaction on an ABI 3100 automated sequencer. Sequences were viewed by BioEdit and aligned by hand.
Effects of parasitism
Microscopical examination of colonies combined with PCR assays allowed us to determine the numbers of zooids and statoblasts per colony for overtly-infected, covertly-infected and uninfected colonies collected from the Barton Blow Wells population.
To further assess the effects of parasitism on the growth and reproduction of bryozoan hosts we studied subsets of L. crystallinus colonies that had been collected from Barton Blow Wells on a number of sampling dates. The colonies were allowed to attach over a 48 h period to Petri dishes filled with source water, and the dishes with attached colonies were then inverted and placed in a laboratory mesocosm system subject to constant temperature (21°C) and light (described by Tops et al. Reference Tops, Baxa, McDowell, Hedrick and Okamura2004). Each dish contained a single attached colony at the outset of the study, thus the subsequent growth and reproduction per dish are attributable to this original colony.
Material on Petri dishes deriving from original colonies with overt infections and from apparently uninfected original colonies (collected from Barton Blow Wells on 02/02/2004, 20/04/2004, 26/10/2004, 24/01/2005) was monitored weekly, using a stereomicroscope, for 13 weeks. The exceptions were for material collected in February and April 2004 which was monitored for 10 and 9 weeks, respectively, due to unbiased mortality perhaps as a result of inappropriate mesocosm conditions. Data collected during monitoring included: the number of colonies per dish, the number of zooids per colony, the presence of myxozoan spores and sacs in each colony, and the number of statoblasts per colony.
To assess the effects of intensity and maturity of infection on colony growth, the number of myxozoan sacs and the presence of released spores were determined per colony for material placed in culture in October 2004 (3 original colonies) and January 2005 (1 original colony). We then analysed the relationships between (1) the per capita growth rates of parasites and hosts (measured, respectively, as the number of sacs at successive time intervals minus the number of sacs at the previous time interval/the number of colonies at each successive time interval per dish and the number of zooids at successive time intervals minus the number of zooids at the previous time interval/the number of zooids at each successive time interval per dish), and (2) per capita growth rate of host and the presence or absence of spores released from sacs and resident in the body cavity. Data collected in this study also informed on the development of the parasite over time.
To assess the effects of parasitism on zooid production and turnover, 6 overtly infected colonies were randomly selected from material originating from Barton Blow Wells that had been maintained in culture for over 6 months. Six apparently uninfected colonies were matched by size (number of zooids) with 6 infected colonies. These colonies were allowed to attach singly to Petri dishes, placed in a mesocosm system, and monitored every 2–3 days over a 12-day period. This short time-period allowed monitoring of individual zooids during colony growth and fission by creating schematic illustrations of colonies during each sampling period. The following data were collected at each monitoring date (1) the number of newly formed zooids per colony since the last monitoring date; (2) the number of zooids that had died per colony since the last monitoring date; (3) the number of colonies per dish and (4) the number of zooids per colony. A new zooid was counted once the lophophore was extended and the zooid was feeding. A zooid was counted as dead once the tentacles of the inverted lophophore had started to disintegrate.
RESULTS
Patterns of prevalence
Overt infections were never observed in colonies collected from the Chil Brook throughout the 2-year period of sampling, nor were they detected in colonies from Burton Mill Pond, the River Fürtbach or on the one sampling date for the Lago di Piediluco when colonies were observed microscopically (Table 1). In contrast, overt infections were observed throughout the 2-year sampling period in colonies from Barton Blow Wells, with prevalences ranging from 0 to 13% (Table 1).
Covert infections were detected in every population of L. crystallinus, ranging from 9 to 80% in prevalence (Table 1). At Barton Blow Wells covert infections were present over consecutive sampling dates spanning 15 months (15/10/03–24/01/05) and occurred at consistently higher prevalences than those of overt infections, ranging from 9 to 59% of colonies (Table 1). There were no apparent seasonal trends in prevalence of either overt or covert infections (Table 1) at Barton Blow Wells, and the prevalences of overt and covert infections were not correlated (Pearson correlation=−0·112, P=0·833).
Nine out of the 10 colonies hatched from statoblasts contained parasite DNA, the exception being 1 statoblast-hatched colony originating from Barton Blow Wells.
All 15 sequences that were obtained from the statoblast-derived and representative field-collected colonies were diagnostic of the myxozoan parasite of L. crystallinus (Tops et al. Reference Tops, Curry and Okamura2005), exhibiting minor sequence variation (<2%) amongst pairwise comparisons using BLASTN that was unrelated to site. Sequences have been deposited in GenBank (Accession numbers DQ839521–DQ839535).
Effects of parasitism
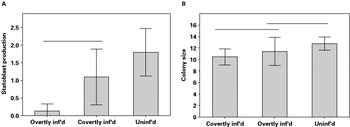
Overtly infected colonies sampled from Barton Blow Wells had significantly fewer statoblasts than uninfected colonies (Fig. 2A; Mann-Whitney U test: overt vs uninfected U=896·0, P=0·004). Although the differences were not significant, there was a trend towards covertly infected colonies having fewer statoblasts than uninfected colonies and a greater number of statoblasts than overtly infected colonies (Fig. 2A; Mann-Whitney tests: covert vs overt U=389·5, P=0·13; covert vs uninfected U=1959·5, P=0·10). Infection also appeared to influence colony size: covertly infected colonies were significantly smaller than uninfected colonies (Fig. 2B; Mann-Whitney test: covert vs uninfected U=1783·0, P=0·03), but the sizes of overtly infected and uninfected colonies, and of overtly infected and covertly infected colonies were not significantly different (Fig. 2B; Mann-Whitney tests: covert vs overt U=414·5, P=0·51; overt vs uninfected U=1145·5, P=0·31).
(A) Statoblast production (the mean number of statoblasts per colony) for overtly infected, covertly infected and uninfected colonies. (B) Colony size (the mean number of zooids per colony) for covertly, overtly and uninfected colonies. Data are pooled across time for material collected from Barton Blow Wells approximately every 90 days from 21 January 2003 until 24 January 2005 (see Table 1); n=23 for overtly infected colonies; n=40 for covertly infected colonies; n=115 for uninfected colonies. Error bars=95% confidence intervals. Lines above columns signify no significant differences in pairwise comparisons.

We were able to investigate the effects of parasitism on the subsequent growth and development of 12 overtly infected and 45 apparently uninfected colonies obtained from 4 sampling dates in our laboratory mesocosm system. Note that for practical reasons we were unable to determine the infection status of the ‘apparently uninfected’ colonies, thus this material could have been comprised of both uninfected and covertly-infected colonies.
There was no significant effect of collection date upon mean sizes of colonies collected from the field (GLM one-way ANOVA F52, 2=0·23, P=0·80). Collection date did, however, significantly influence the mean colony sizes attained once colonies were placed into the mesocosm, although no seasonal pattern of influence was evident (GLM repeated measures ANOVA F52, 2=30·76, P<0·005). For each collection period infection did not significantly influence colony size (mean number of zooids/colony) over time in the culture system (GLM repeated measures ANOVA for collection dates 02/2004: F1, 0=50·85, P=0·09; 04/2004: F15, 1=1·01, P=0·33; 10/2004: F25, 1=1·04, P=0·32; and 01/2005: F9, 1=0·37, P=0·56).
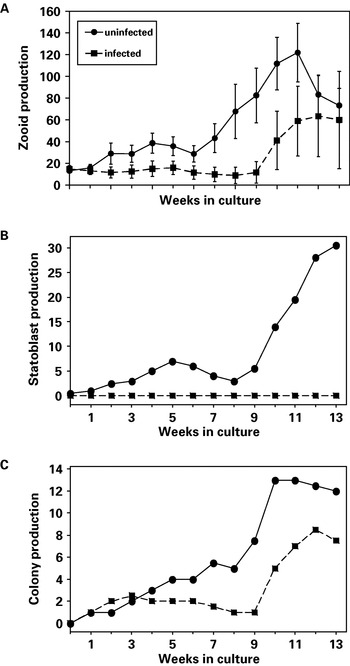
Infection status had no influence on mortality: all material proliferated on dishes in the mesocosms regardless of whether it derived initially from overtly infected or apparently uninfected colonies. However, analyses of data pooled over the original collection dates revealed that overt infection influenced zooid production, statoblast production and the generation of new colonies (Fig. 3). Growth assessed by the production of zooids (the mean number of zooids per dish) was significantly decreased with overt infection (Fig. 3A) (GLM repeated measures ANOVA, weeks 0 to 6: F50, 1=8·33, P=0·006). There was a significant difference in the production of zooids deriving from material collected at different dates after the 6th week of culturing; therefore only the first 6 weeks across all sampling dates were included in the analysis. The production of statoblasts (the median number of statoblasts per dish on each sampling date) was also significantly decreased in colonies with overt infections (Fig. 3B) (Friedman, median total statoblasts versus infected blocked by week: S1=14·00, P<0·005). Finally, the number of colonies produced through colony fission (the median number of colonies per dish on each sampling date) was significantly decreased with infection (Friedman, median number of colonies versus infected blocked by week: S1=5·33, P=0·02) (Fig. 3C). In 64 out of 65 (98·5%) observed fission events, parasite stages (sacs) were transferred to both daughter colonies. In one instance, a fission event occurred where parasitic stages were observed in 1 daughter colony only. The lack of infection in the other colony was confirmed by PCR analysis.
Growth and reproduction of overtly infected (n=12 Petri dishes) and apparently uninfected (n=45 Petri dishes) bryozoans growing on Petri dishes over time (weeks in culture) in mesocosms. (A) Zooid production (mean number of zooids/dish and 2 s.e.). (B) Statoblast production (median number of statoblasts/dish). (C) Colony production (median number of colonies/dish). Material originated from 12 overtly-infected and 45 apparently uninfected colonies from Barton Blow Wells (collected from 2 February 2004 to 24 January 2005) that were attached singly to Petri dishes and then placed in laboratory mesocosm.

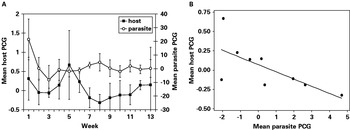
Analyses of the per capita growth rates of hosts and parasites were not straightforward. If the entire sampling period is considered, there was no relationship between the mean per capita growth of the parasites and colonies (Pearson correlation: r 50,1=0·05, P=0·72) (Fig. 4A). This is because during the first 4 weeks in culture the growth of hosts and parasites showed similar behaviours, both decreasing at first and then increasing. Over the last 9 weeks there was a significant negative relationship between per capita growth of parasites and colonies (R28,1=47·6, P=0·04) (Fig. 4B) indicating that infection intensity significantly depressed growth. There was no relationship between the per capita growth of colonies and the presence or absence of released spores (Mann-Whitney U on spore presence or absence: U=93·5, P=0·23).
(A) Mean parasite and host per capita growth (as Mean parasite PCG and Mean host PCG, respectively; see description in Results section) over time (weeks in culture). (B) Regression of mean per capita growth of bryozoan hosts vs mean per capita growth of parasites from week 4 for material derived from 4 overtly infected colonies collected in October 2004 and January 2005 and placed in laboratory mesocosm.

Finally, the number of newly created zooids and the number of zooids that died over the 12-day period were not dependent on the presence or absence of overt infections (the number of zooids created=20 and that died=35 for uninfected colonies; the number of zooids created=28 and that died=42 for infected colonies; χ2=0·172, d.f.=1, P=0·678) and the total recruitment of zooids during this period was similar for infected (n=14 zooids) and uninfected (n=15 zooids) colonies.
Parasite development
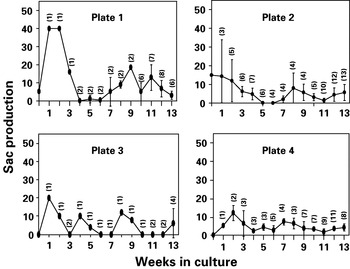
Sac production during the 13 weeks of our infection intensity study was variable amongst replicates (Fig. 5) and showed no consistent periodicity within or between dishes. Nevertheless, a degree of synchrony in sac proliferation for material of common origin is suggested by periods when no sacs were observed amongst all the daughter colonies on Petri dishes (Plate 2, Week 6; Plate 3, Weeks 3, 11 and 12; see Fig. 5) and patterns revealing a waxing and waning in sac production. We observed up to 40 sacs per colony (Plate 1 during the first 2 weeks; Fig. 5) while the mean number of sacs/colony/plate ranged from 0 to 18·5 over the 13 weeks of the study (Fig. 5).
Production of sacs over time in the mesocosm system for material resulting from 4 known infected colonies placed individually on Plates 1–4. Values are plotted as mean sac production/colony/plate (±2 s.e.) and as the total number of sacs when single colonies were present. Original colonies established on Plates 1–3 collected in October 2004 and on Plate 4 in January 2005. Values in parentheses are the number of colonies.

Regression analysis suggested that an increase in colony size was associated with an increase in the number of sacs per colony although this was not significant at the 5% level (R2=8·6, P=0·08, d.f.=1,34; analysis on data collected during last week of study).
Overt infections were never observed to develop de novo despite apparently uninfected material being in close proximity to colonies that released thousands of spores over the 13-week culturing period. This result is in keeping with the lack of evidence for horizontal transmission of other malacosporeans from bryozoan to bryozoan (Tops et al. Reference Tops, Baxa, McDowell, Hedrick and Okamura2004).
DISCUSSION
Patterns of parasitism over space and time
Our results reveal that the undescribed species of Buddenbrockia can attain high prevalences in populations of L. crystallinus. In view of the apparent rarity of L. crystallinus, the parasite would appear to be widespread since covert infections characterized all populations. At Barton Blow Wells overt infections were relatively persistent, being observed in 8 of the 9 sampling dates over the course of 2 years. Covert infections were detected at this site throughout the 15-month period when material was subject to PCR analysis, and at higher prevalences (range=9–59%) than those observed for overt infections (range=0–13%). At the other sites, covert infection prevalences were very high (50–80%) although the data are based on low sample sizes. The absence of overt infections in the population at the Chil Brook over the sustained 2-year sampling period suggests that the cue for the development of overt infection is lacking at this site or that this L. crystallinus population is able to suppress such development. The absence of overt infections at other sites may simply reflect the single dates when colonies were examined microscopically.
Weekly monitoring of colonies from Barton Blow Wells maintained in constant culture conditions showed that overt infection intensity varies over time. McGurk et al. (Reference McGurk, Morris, Auchinachie and Adams2006) similarly observed overt infections to develop following apparent absence of infection by T. bryosalmonae in bryozoans. It is unclear whether the waxing and waning of parasitic sacs in colonies maintained in constant and favourable conditions in laboratory mesocosms reflects an endogenous pattern of parasite growth and proliferation or is mediated by host defences. The latter is conceivable since freely-circulating coelomocytes in the body cavity appear to be involved in immune responses of freshwater bryozoans (Mano, Reference Mano1964). The variation in levels of sac production amongst the colonies developing on replicate Petri dishes suggests variation in host susceptibility to overt infection or in parasite ability to exploit hosts.
It should be noted that because we did not sequence all material, it remains a possibility that we may, on occasion, have sampled infections by different malacosporean species (e.g. in Italy). However, we are relatively confident that the parasite is the same throughout our populations for the following reasons (1) high sequence similarity amongst representatives from British and Swiss populations; (2) consistent observations of sacs that are typical of the species of Buddenbrockia that infects L. crystallinus (Canning et al. manuscript in preparation) and (3) temporal persistence in many populations.
Effects of parasitism
Examination of field-collected material provided evidence that overt infections compromise statoblast production. On average, the production of statoblasts was reduced by 93% relative to uninfected colonies. In addition, we found that colonies with covert infections were significantly smaller than uninfected colonies, with an average reduction in size of 18% relative to uninfected colonies, possibly as a result of increased fission rates (see next section). These results demonstrate that parasitism influences both size class structure and reproduction in L. crystallinus populations. Similar effects have been observed in sea fan populations with fungal infections (Kim and Harvell, Reference Kim and Harvell2004).
Our mesocosm studies clearly demonstrated that the production of zooids, statoblasts and colonies was markedly reduced in material with overt infections relative to apparently uninfected material over the course of 13 weeks. These results strengthen the above inferences derived from patterns based on static sampling of field collected material. Mesocosm studies also provided evidence that infection has no influence on mortality but that infection intensity decreases host fitness. This is reflected by the inverse relationship between intensity of overt infection and host per capita growth, following a period of initial adjustment to laboratory conditions. Since these results were obtained under favourable laboratory conditions these effects might be exacerbated under less favourable conditions (e.g. Brown et al. Reference Brown, Schmid-Hempel and Schmid-Hempel2003; Bedhomme et al. Reference Bedhomme, Agnew, Sidobre and Michalakis2004). However, persistence as more benign covert stages in bryozoan hosts during unfavourable field conditions is apparent in T. bryosalmonae (Tops, Reference Tops2004). We found no evidence that overt infection influences zooid production and turnover, but the study was conducted on a small number of infected colonies over a short time-period. Further investigation of this issue is merited given the increased numbers of zooids that were produced and that died in overtly infected colonies.
It should be pointed out that as the development of overt infection is a continuum of the infection process and is contingent on prior covert infection, gradients in effects can be expected. The gradient suggested by the relative levels of statoblast production in uninfected (highest), covertly-infected (intermediate) and overtly-infected (lowest) colonies may indeed illustrate this point.
Life-history strategies of colonial hosts and endoparasites
A complex set of potential drivers involving both host and parasite strategies can be postulated to explain the patterns we have observed. The responses of both covertly- and overtly-infected colonies suggest a host strategy of investment in longevity of clonal genotypes. The smaller sizes of covertly infected colonies may be explained by increased fission rates. If fission provides a potential means of escaping from parasites by daughter colonies, increased fission rates may represent an adaptive host response to parasitism. This could be particularly effective in cases where covert infections have not spread throughout the body of the colony. However, we observed that escape from parasitism is even possible for colonies with overt infections, albeit apparently with a low level of success (1/65 fission events or 1·5% of the time). It is relevant that other bryozoans show similar responses to parasitism by malacosporeans. Thus, bryozoans with branching morphologies pinch off the epidermis within branches in response to infection (Canning et al. Reference Canning, Tops, Curry, Wood and Okamura2002) thus effecting separation of the infected portions of colonies from uninfected portions. The former undergoes continued growth while the latter dies in the case of highly virulent infections with Buddenbrockia worms (Canning et al. Reference Canning, Tops, Curry, Wood and Okamura2002).
Conversely, from the point of view of the parasite, increased colony fission rates will effectively achieve both transmission and dispersal within the microhabitat through the local movements of daughter colonies. If dispersal attained through high rates of colony fission results in greater parasite fitness, then manipulation of host fission rates by parasites may be a driver for the observed patterns in colony size. Indeed, recent modelling provides support for the possibility that parasites may manipulate their hosts’ dispersal in order to increase their own dispersal or transmission (Lion et al. Reference Lion, van Baalen and Wilson2006). A further mechanism by which parasites can achieve dispersal is via infection of the host's statoblasts. Our finding that 9 out of 10 colonies that hatched from statoblasts were infected implies that prevalences of statoblast infection may be substantial. Infection of statoblasts will achieve considerable spatial and temporal dispersal by parasites that would complement the predominantly local dispersal attained through colony fission. It also indicates that the physiology of the parasite must be intimately linked with that of the host, allowing it to undergo prolonged periods of quiescence during this dormant phase of the host's life-history.
Host or parasite strategies could also underly the similar sizes of overtly-infected and uninfected colonies. Thus, parasites may inhibit the high fission rates of covertly-infected colonies (see above) when overt infections develop. This could be adaptive for parasites if host resources are not being used to support the energetic costs of fission at a time when the parasite is developing infective spores to effect horizontal transmission. Alternatively, the development of numerous sacs may be supported by relatively larger host volumes as a result of scaling (fission would result in lower volumes relative to surface areas). However, under these arguments colonies should not divide, all else being equal. An alternate explanation for the similar sizes of overtly-infected and uninfected colonies is based on host responses. Thus, if the costs of increased fission and the maintenance of statoblast production during certain phases of infection exceed the costs of supporting parasites they may be avoided by bryozoan hosts. In other words, paying the costs of supporting actively proliferating parasitic stages in the short term might be advantageous if (a) the host later enters a phase of covert infection when growth and statoblast production may be less inhibited, (b) the development and release of infective stages results in an infection-free colony, or (c) there is a high enough probability of achieving future escape from infection by fission. The cycling between overt and covert infections in the progeny of all 4 overtly-infected colonies and the apparently high level of infection of statoblasts would suggest that infection-free status is not achieved frequently. Infections are thus likely to be maintained in both clonal genotypes and local populations indefinitely, a prediction in keeping with both our field data and other mesocosm-based studies.
Clearly there are multiple and complex potential drivers for both host and parasite strategies. We are inclined to put weight on the involvement of host strategies since isolation of parasitized regions of bryozoan colonies has been observed in more virulent malacosporean infections and this does not seem to have benefitted the parasite (Canning et al. Reference Canning, Tops, Curry, Wood and Okamura2002). However, the apparent longevity of infection and the ability of the parasite to gain access to statoblasts also imply a parasite strategy of long-term persistence in these colonial hosts as discussed further below. A combination of host and parasite strategies is thus likely involved in the patterns of growth and development that we have observed.
Do colonial hosts offer unique opportunities for exploitation by parasites?
Clonal animal hosts differ from exclusively sexually reproducing animals in offering additional routes for vertical transmission besides strict transmission through eggs. For instance, vertical transmission of symbiotic algae occurs when jellyfish polyps vegetatively reproduce via budding (Sachs and Wilcox, Reference Sachs and Wilcox2006). This study demonstrates that Buddenbrockia sp. achieves vertical transmission when parasite stages are passed to new host colonies through statoblasts and colony fission. We have observed vertical transmission of overt stages during colony fission and have PCR evidence and sequence confirmation for the transmission of covert infection through statoblasts. The vertical transmission of covert stages through colony fission is also supported by the development of overt infections in colonies that proliferated following periods of covert infection.
Vertical transmission provides a means for the parasite of achieving long-term persistence within clonal genotypes and demonstrates how parasite strategies can rely on the propensity of colonial hosts to undergo extensive fragmentation (Jackson and Coates, Reference Jackson and Coates1986). The latter is something unitary hosts do not offer. Instead, long-term persistent infections in unitary animals have been linked with the production of resistant spores that withstand extended periods of time in the environment (e.g. Burden et al. Reference Burden, Nixon, Hodgkinson, Possee, Sait, King and Hails2003; Vizoso et al. Reference Vizoso, Lass and Ebert2005).
The parasite's reliance on the covert stage for transmission is revealed by the high proportion of colonies with covert infections at all sites and the persistence of covert infections in populations over time. While the release of infective spores during overt infections will achieve horizontal transmission to as yet unidentified new hosts, the dependency of the parasite on this stage of the life-cycle may be only occasional given the opportunity for extensive vertical transmission in clonal bryozoan hosts. Nevertheless, the reduced host fitness associated with infection, suggests that uninfected hosts would eventually displace infected hosts. Thus, at least some horizontal transmission would be required to maintain the parasite (Vizoso and Ebert, Reference Vizoso and Ebert2005).
The related malacosporean, T. bryosalmonae, achieves a similar pattern of covert infection. T. bryosalmonae apparently also undergoes extensive vertical transmission, with evidence deriving from long-term persistence of infections in bryozoan populations (Tops, Reference Tops2004; Tops and Okamura, Reference Tops and Okamura2003; Tops et al. Reference Tops, Lockwood and Okamura2006), the presence of T. bryosalmonae infections following induced fragmentation of several bryozoan colonies (Morris and Adams, Reference Morris and Adams2006), and the development of overt infections in portions of colonies collected from the field and subsequently maintained in mesocosms (Tops, Reference Tops2004; Tops and Okamura, Reference Tops and Okamura2003). Nevertheless, the tendency of many freshwater bryozoan populations to undergo fluctuations in abundance and local extinction (for review see Okamura and Hatton-Ellis, Reference Okamura and Hatton-Ellis1995; Wood and Okamura, Reference Wood and Okamura2005) suggests that a parasite strategy of long-term local persistence as covert infections would be unsuitable. Infection of statoblasts may thus be critical, effecting introduction to new water bodies through waterfowl-mediated dispersal of statoblasts (Freeland et al. Reference Freeland, Noble and Okamura2000, Figuerola et al. Reference Figuerola, Green, Black and Okamura2003a, Reference Figuerola, Green and Santamaríab).
Conclusions
With regard to the 4 questions posed in the introduction our evidence indicates the following. (1) Buddenbrockia sp. achieves persistent infections in host populations over space and time and can attain high prevalence. (2) Under the environmental conditions studied, parasitism reduces growth and clonal reproduction in bryozoan hosts (but does not influence mortality) and the effect is stage-specific (overt infections influencing growth and statoblast production, covert infections influencing colony size). (3) Increased rates of colony fission during covert infection may be a strategy for bryozoans to achieve escape from parasites, while a parasite strategy of long-term persistence is implied by the high infection prevalences in (i) statoblasts, (ii) daughter colonies following fission, and (iii) all populations sampled. (4) Parasites of colonial animals can achieve extensive vertical transmission and long-term persistence by exploiting the propensity of colonial hosts to undergo fragmentation.
Many colonial animals offer a long-lived and genetically homogeneous resource for parasites. In such systems, lower virulence may be expected to evolve since parasites could be transmitted vertically and between close relatives (clonemates) (Herre et al. Reference Herre, Knowlton, Mueller and Rehner1999 and references therein). Our results suggesting that Buddenbrockia sp. has little to no influence on survivorship are therefore of interest. Furthermore, statoblast production is maintained in covertly-infected colonies. The high prevalence levels in populations also suggest that the parasite is relatively benign. While clearly this system entails negative influences on host fitness, overall virulence appears to be relatively low.
We are unaware of similar investigations of parasitism in other colonial animals. Perhaps this is unsurprising if many parasites occur as covert infections with little effect and are thus unlikely to be detected. This speculation begs the question of whether the evolution of lower virulence during exploitation via extensive vertical transmission in colonial hosts underlies many of the endosymbiotic relationships observed in cnidarians (e.g. Furla et al. Reference Furla, Allemand, Schick, Ferrier-Pagès, Richier, Plantivaux, Merle and Tambutté2005), sponges (e.g. Maldonaldo et al. Reference Maldonaldo, Cortadellas, Trillas and Rützler2005), ascidians (e.g. Hirose et al. Reference Hirose, Maruyama, Cheng and Lewin1996) and marine bryozoans (e.g McGovern and Hellberg, Reference McGovern and Hellberg2003). Sachs and Wilcox (Reference Sachs and Wilcox2006) present an elegant demonstration that supports this scenario by providing evidence that vertical transmission of the endosymbiont Symbiodinium microadriaticum selects for symbiont cooperation. These speculations suggest that there are opportunities and constraints associated with host-parasite coevolution that are dependent on body plans. We hope that our work will stimulate further investigation of the evolutionary ecology of parasites and their colonial hosts.
We thank D. Bucke, P. M. Hammond, A. Kownacki, I. Middlebrook, V. Rimmer and M. Taticchi for help in fieldwork, V. Rimmer for help in maintaining our mesocosm systems, A. O'Dea for first collection from Lago di Piediluco, and Action for Invertebrates, the Environment Agency and the University of Reading for funding.