I. INTRODUCTION
There is currently great interest in the nanotribological performance of graphene due to its lubricious behavior.Reference Berman, Erdemir and Sumant1 Such behavior can be proven highly beneficial in numerous applications. These range from contact-based microelectromechanical systems (MEMS),Reference Williams and Lee2,Reference Martin-Olmos, Imad Rasool, Weiller and Gimzewski3 where stiction and friction both need to be minimized, to oil lubricants, where graphene can be dispersed into for reducing the friction and wear of the engine.Reference Sarno, Senatore, Cirillo, Petrone and Ciambelli4,Reference Eswaraih, Sankaranarayanan and Ramaprabhu5 Furthermore, an ever-increasing trend for the integration of graphene-based components into energy harvesting, storage, and sensing devices has recently been observed. In these cases, the graphene surface may be in contact with a functional liquid (e.g., an electrolyte), and the tribological response of such interface can be a valuable tool toward understanding nanoscale interfacial characteristicsReference Robinson, Kay and Kolosov6 and thus improving the performance of the device.
The lubricious behavior of mechanically exfoliated graphene, along with other two-dimensional atomically thin sheets, on SiO2/Si substrates was experimentally investigated by Lee et al.Reference Lee, Li, Kalb, Liu, Berger, Carpick and Hone7 using atomic force microscopy (AFM). It was found that Si tip-sample adhesion measurements exhibited no resolvable difference for different numbers of layers. However, the authors reported a monotonic increase in friction with decreasing number of layers due to the low bending stiffness of the elastically deforming thinnest layers. This was identified, with the help of atomistic simulations, as the puckering effect results from wrinkle formation in front of the moving counterbody. Using molecular dynamics simulations DongReference Dong8 further investigated the puckering effect with respect to substrate roughness and graphene layer number. It was suggested that a relatively rough substrate leads to increased friction, as the number of layers decreases, due to the adhesive conformation of the graphene to the substrate, thus exacerbating the puckering effect. Liu et al.Reference Liu, Li, Egberts and Carpick9 revisited the nanoscale adhesive properties of Si tips and mechanically exfoliated few layer graphene (FLG) on SiO2/Si substrates using AFM. In particular, they studied the effect of sliding history on the resulting adhesion of the topmost layer and observed sliding-induced changes of the interfacial geometry of graphene due to interlayer delamination. Deng et al.Reference Deng, Klimov, Solares, Li, Xu and Cannara10 investigated the nanoscale friction and adhesion of suspended and SiO2-supported monolayer and multilayer graphene prepared by mechanical exfoliation of graphite. They reported a significantly lower friction of supported graphene as compared to the bare SiO2 surface, independent of AFM tip radius and material. They also noted larger Si tip-supported graphene adhesion forces relative to the bare SiO2 substrate. The latter was attributed to both higher atomic density of graphene near the sample surface, and thus increased short-range forces, and the enlarged contact area as a result of the enhanced surface compliance. The highest pull-off forces were measured for the supported graphene structures highlighting the combined effect of in-plane elasticity and van der Waals forces between the AFM tip, the sample surface, and the underlying substrate. Furthermore, Hunley et al.Reference Hunley, Flynn, Dodson, Sundarajan, Boland and Strachan11 focused on the investigation of the tribological and nanomechanical properties of, mechanically exfoliated, FLG edges using lateral force and AFM methods. A significant increase in friction was measured on the edge vicinity, whereas, for a single-layer, this phenomenon was not observed. The local adhesion forces were found to largely remain active normal to the surface as the tip slid across the edge of the sample. It was also reported that the graphene edges exhibited elastic, spring-like, stick-slip behavior.
Few layer mechanically exfoliated graphene on Si substrates was found to exhibit highly lubricious nanotribological behavior with a coefficient of friction (COF) of around 0.02 for a loading range from 3 to 30 nN as measured by AFM.Reference Lin, Kim and Jun12 Using AFM, Peng et al.Reference Peng, Wang and Li13 investigated the nanotribological properties of deionized (DI) water exfoliated multilayered graphene oxide and reduced graphene oxide, and they compared the results with mechanically exfoliated multilayered graphene on SiO2. They used a 20 nm Si tip as the counterface. It was observed that the mechanically exfoliated graphene surface exhibits the lowest friction and adhesion because of its defect-free planar lattice. Finally, a very recent work by Chen and FilleterReference Chen and Filleter14 focused on the study of the effects of surface structure on the nanotribology of mechanically exfoliated ultrathin graphene and graphene oxide films on SiO2/Si substrates. It was determined that graphene reduces friction by 6 times and graphene oxide by 2 times, respectively, as compared to that of SiO2. It was suggested that the differences in friction were mostly due to different interfacial strengths between the Si tip–sample interface and not the adhesion between them.
In addition to top-down preparation methods, such as mechanical and liquid-phase exfoliation, graphene may also be prepared using bottom-up synthesis techniques such as chemical vapor deposition (CVD) on various substrates as well as high temperature sublimation of silicon from the near surface layers of SiC. The nanotribological properties of these films have also been investigated and are of considerable interest.
Filleter et al.Reference Filleter, McChesney, Bostwick, Rotenberg, Emtsev, Seyller, Horn and Bennewitz15 used thermal sublimation to grow single and two-layer graphene on SiC and measured their frictional response using diamond-coated AFM tips. It was observed that the friction on SiC is significantly reduced when using a single layer of graphene on top and it is further reduced by a factor of two when utilizing a bilayer graphene. Such behavior was attributed to the substantial difference in electron–phonon coupling observed for the single layer and the bilayer surface, respectively. Egberts et al.Reference Egberts, Han, Lin, Johnson and Carpick16 studied the nanotribological response of graphene grown by CVD on polycrystalline Cu substrate. They reported that bilayer graphene exhibits lower friction than single layer graphene for the whole loading range used. They noted that this result is consistent with measurements on exfoliated and thermally grown graphene reported previously. Also, Ko and co-workersReference Ko, Kwon, Byun, Choi, Park, Kim and Park17 investigated the effect of surface modification (fluorination, hydrogenation, and oxidation) on the nanotribological properties of CVD grown graphene on Cu. Friction force microscopy measurements revealed that hydrogenated, fluorinated, and oxidized surfaces exhibit, 2-, 6-, and 7-fold enhanced nanoscale friction, respectively, with respect to nonmodified graphene. Such results were related to the adhesive and elastic properties of the chemically modified samples. Density-functional theory calculations suggest that, while the in-plane adhesive properties of chemically modified surfaces are marginally reduced by 30%, the out-of-plane elastic properties are significantly increased up to 800%. Finally, Berman and co-workersReference Berman, Erdemir, Zinovev and Sumant18 reported for the first time the CVD growth of single layer graphene on SiO2 with ultra low friction due to its stronger adhesion with the substrate as opposed to mechanically exfoliated, substrate-supported surfaces. They also reported dramatically increased nanoscale friction results for oxidized graphene layers as opposed to pristine samples.
Unlike the recent growth of “single” asperity nanotribological studies of graphene in ambient or ultrahigh vacuum conditions, frictional investigations of graphene in liquids are still very limited. Robinson et al.Reference Robinson, Kay and Kolosov6 recently reported on the nanoscale interfacial interactions of graphene with polar and nonpolar liquids using ultrasonic force microscopy. They suggested that dodecane forms a solid-like, ∼2 nm thick, “cushion,” on top of the graphene surface. However, for measurements in water environment, a notable similarity with the ambient environment is found. The latter confirms the presence of a water meniscus in air, suggesting an extremely thin water layer on the graphene surface. As mentioned earlier, studies in liquids are essential for determining interfacial characteristics important in optoelectronic and contact-based MEMS devices.
In this work, we investigate the nanoscale adhesion and frictional behavior of FLG structures, prepared by both top-down and bottom-up approaches, in ambient air and various liquid environments. In particular, we study the effect of the preparation method on the resulting nanotribological properties using Si AFM tips as the counterface. In addition, we study the frictional characteristics of FLG in DI water, ionic [iodine and 1-butyl-3-methylimidazolium hexafluorophosphate (BMIM PF6)], and silicone oil liquid environments to understand interfacial characteristics critical for the future development of energy harvesting and storage, sensing, and MEMS device applications.
II. MATERIALS AND EXPERIMENTAL METHODS
A. Specimen preparation methods
To investigate potential differences of the nanotribological properties of graphene surfaces, we used both top-down and bottom-up preparation methods. In particular, the top-down approach (referred to as T1) involved the liquid-phase exfoliation of expanded graphite. This approach is advantageous in terms of low-cost and scalability. A large number of organic liquids including organic solvents, ionic liquids, and water/surfactant solutions can be used as the exfoliation medium and are shown to display a range of exfoliation efficiencies.Reference Du, Jiang and Zhu19 In this work, FLG flakes were produced by dispersion and sonication of graphite in dimethylformamide (DMF) and 1-2-dichloroethene (DCE). During sonication, the energy required to disrupt the van der Waals forces holding the layers of graphene together in the graphite structure was balanced by the solvent–graphene interaction, for solvents whose surface energies match with that of graphene.Reference Hernandez, Nicolosi, Lotya, Blighe, Shun, De, McGovern, Holland, Burne, Gun'Ko, Boland, Niraj, Duesberg, Krishnamurthy, Goodhue, Hatchison, Scardaci, Ferrari and Coleman20 In our process, 2 mg of chemically expanded graphite flakes (Asbury Carbons, Inc., Asbury, New Jersey) were heated in a conventional microwave for 20 s. The thermally expanded graphite in the form of ribbons was then dispersed into a stock solution of either DCE or DMF. A glass vile containing equal parts of the stock solution and the dispersant was sonicated for 24 h in a Branson 2510 sonicator (Branson Ultrasonics Corp., Danbury, Connecticut) to exfoliate the expanded graphite flakes into FLG. This resulted in a homogeneous suspension consisting of a mixture of FLG and heavier graphite particles. To sort the mixture, the obtained solution was centrifuged at 3500 rpm for 30 min using a Fisher Scientific Centrific Model 228 centrifuge (Pittsburgh, Pennsylvania). The centrifugation step caused the heavier graphite to sediment at the bottom of the centrifuge tube while the lighter graphene flakes of few layer thicknesses rose to the top of the solution. The clear solution in the top was then pipetted into a glass vile. Finally, the pipetted solution containing FLG flakes was spin-coated on SiO2 wafers at 1000 rpm for 60 s using a Specialty Coating Systems Spin Coater Model P6700 (Indianapolis, Indiana). A number of T1-prepared surfaces were oxidized at 500 °C for 10 s to investigate the role of oxygen defects in the tribological response of FLG surfaces. These samples are referred to as T1-Ox.
The bottom-up approach (referred to as T2) involved the growth of 3-layer graphene films on SiC substrates. This approach has been described in detail elsewhere.Reference Chaudhari21,Reference Raghavan, Denig, Nelson and Stinespring22 Briefly, this synthesis method used either CF4 or Cl2 based inductively coupled plasma-reactive ion etching to selectively etch Si from the 6H–SiC (0001) surface to produce a halogenated C-rich surface layer. This was followed by rapid thermal annealing at 950 °C for 2 min in atmospheric pressure ultrapure Ar to nucleate and grow the graphene film from the carbon rich precursor. The thickness of the graphene film in this synthesis approach is controlled by the etching parameters.
B. Experimental measurements
The surface elemental analysis of the FLG specimens was conducted using x-ray photoelectron spectroscopy (XPS). These were performed using a Physical Electronics PHI 5700 VersaProbe (Eden Prairie, Minnesota). A monochromated, 25 W, 15 kV Al Kα x-ray source with photon energy of 1486.6 eV was used to produce photoelectrons which were analyzed using a hemispherical analyzer. The pass energies used for survey spectra and high resolution spectra are 117 and 23.50 eV, respectively. The pressure in the main chamber during the analysis was ∼5 × 10⁻¹⁰ Torr. The acquired spectra were collected using multiple scans, and the data were averaged and analyzed using MultiPak v9 software.
Adhesion and friction measurements were performed using a Molecular Imaging PicoScan 3000 AFM (Agilent Technologies, Inc., Tempe, Arizona). Si tips (CONTPt-20 POINTPROBE-Silicon SPM-Sensor by Nanoworld, Neuchâtel, Switzerland) nominal values of 0.2 N/m and 13 kHz for the force constant and resonant frequency, respectively, were used for scanning in contact mode. The nominal tip radius was less than 25 nm and the cantilever was coated with platinum iridium5 (PtIr5) coating on both sides. All measurements were conducted at 21 ± 2 °C and 45 ± 5% relative humidity (RH). To calibrate the spring constant of the cantilever, force–distance curves were obtained between the tip and a clean glass sample. Three curves were averaged with sweep times set to 1 s each. The slope of the contact portion of the force–distance curve gives the deflection sensitivity of the cantilever. A power spectral density plot was obtained, using Agilent's Thermal K option, and the spring constants were then calculated. For the frictional characterization, the scan angle of the cantilever beam was set to be perpendicular to the fast scanning direction. Friction measurements in air were conducted by applying loads in the range of 0–40 nN to the tip traveling at speeds of 5 µm/s unless otherwise mentioned. The friction force was then calculated by dividing the friction signal difference between the steady-state values in the forward and reverse scans by two. The obtained values were then converted into friction values by determining the torsional spring constant according to the Sader method.Reference Green, Lioe, Cleveland, Proksch, Mulvaney and Sader23
In addition, we performed, T2-prepared, FLG friction measurements, using a 6.25 μm/s tip speed, in various liquid environments including DI water, ionic liquids, and oils. Specifically, iodine solution (Fisher Scientific) of 3 wt% KI and 1.3 wt% iodine in water and BMIM-PF6 solution in isopropanol (0.5% v/v), from solvionic, were used. Also, silicone oil (Brookfield Engineering, Middleboro, Massachusetts) with a 4.2 cP viscosity was utilized in this work. All liquids were spin-coated on the FLG surface at a speed of 2500 rpm for 60 s to obtain a thin liquid layer.
III. RESULTS AND DISCUSSION
A. Surface chemical characterization
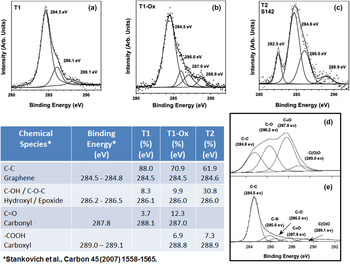
The surface composition of the different FLG specimens was characterized using XPS. Figures 1(a)–1(c) show representative C1s spectra for T1, T1-Ox, and T2 type surfaces, respectively. Each spectrum has been resolved into several components representative of different chemical species present on the surface and in the near surface layers. As also shown in Fig. 1, there is a table which indicates the relative concentrations and binding energies of these species. In addition, the table shows the chemical identity and binding energy for graphene and several oxygen-based graphene defects taken from reference spectra of graphene oxide [Fig. 1(d)] and reduced graphene oxide [Fig. 1(e)].Reference Stankovich, Dikin, Piner, Kohlhaas, Kleinhammes, Jia, Wu, Nguyen and Ruoff24 For each of T1, T1-Ox, and T2 type samples, the insulating nature of the substrates introduces a small amount of charging during the acquisition of the XPS spectra. To account for this, the T1 and T1-Ox spectra were shifted so that the graphene peak appeared at 284.5 eV in agreement with others.Reference Stankovich, Dikin, Piner, Kohlhaas, Kleinhammes, Jia, Wu, Nguyen and Ruoff24 For T2 samples, the spectra were aligned so that the C1s peak associated with the SiC substrate appeared at 282.5 eV, which is known from other work.Reference Chaudhari21,Reference Raghavan, Denig, Nelson and Stinespring22 Given the uncertainties of the deconvolution procedure, the values of binding energy are accurate to ±0.2 eV. Uncertainties in concentrations are typically on the order of ±2.5%.
[(a)–(c)] Representative C1s XPS spectra for T1, T1-Ox, and T2 type surfaces, [(d) and (e)] reference spectraReference Stankovich, Dikin, Piner, Kohlhaas, Kleinhammes, Jia, Wu, Nguyen and Ruoff24 for graphene oxide and reduced graphene oxide, respectively. The table shows relative concentrations and binding energies of different chemical species present on FLG surfaces.

For the exfoliated graphene surfaces (T1), Fig. 1(a) indicates that there are two primary defects present. These are hydroxide and epoxide species, whose XPS binding energies are virtually indistinguishable and carbonyl species. The former are thought to involve carbon species on the surface while the latter are thought to be formed at the edges of the graphene planes.Reference Stankovich, Dikin, Piner, Kohlhaas, Kleinhammes, Jia, Wu, Nguyen and Ruoff24 Overall the oxygen-based defect concentration on the T1 type surfaces is of the order of 12%.
For the oxidized T1 samples, Fig. 1(b) suggests a similar analysis with the introduction of a new defect associated with carboxyl species. Overall the oxygen based defect concentration has risen to ∼29% for these graphene surfaces. These are thought be formed primarily at edge sites of the graphene film. It may be argued that the binding energy for the carbonyl defect on the T1-Ox surface is outside the range of experimental uncertainty. While technically true, this is still a reasonable assignment for the peak at 287.0 eV since there is a spread in binding energies for carbonyl reference spectra within the graphene literature and elsewhere.
For the T2 graphene surfaces, the peak at 282.5 eV is due to carbon found in the SiC substrate. This peak is attenuated by the overlying graphene and oxygen defect species and, based on the magnitude of this attenuation, the thickness of the overlying graphene is four atomic layers.Reference Chaudhari21,Reference Raghavan, Denig, Nelson and Stinespring22 Overall the oxygen based defects are predominantly epoxide/hydroxide (∼31%) and carboxyl groups (∼7%). As noted, the epoxide/hydroxide groups are thought to be located on the surface, while the carboxyl groups which are thought to form predominately on edge sites. The oxygen-based defects may lead to greater hydrophilicity.
B. Si–graphene adhesion measurements in air
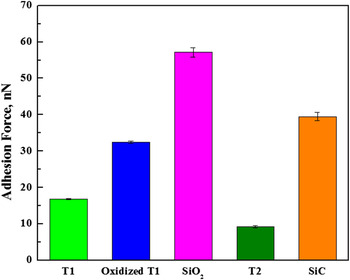
AFM pull-off force measurements between the Si tip and the prepared FLG surfaces are shown in Fig. 2. The adhesion force range measured for all samples, including the underlying bare substrates, is spanning between 9 and 57 nN and in agreement with previous reports.Reference Robinson, Kay and Kolosov6,Reference Peng, Wang and Li13,Reference Kim, Lee, Lee, Jang, Ahn, Kim and Lee25 In all cases, it is found that the FLG surfaces reduce the adhesion force of the SiO2 and SiC substrates, respectively. Specifically, the lowest adhesion (∼9 nN) was measured in the case of T2 sample with T1 being the second lowest. In this case, the observed behavior stems from the difference in both the preparation method and underlying substrate. In particular, the stronger bonding of the bottom-up prepared T2 sample to the SiC base substrate may limit its out-of-plane deformation as opposed to the top-down prepared T1 sample supported by a SiO2 substrate. In such case, the combined effect of in-plane elasticity and van der Waals forces between the tip, the sample surface/subsurface, and the substrate is more pronounced for less-constrained sample-substrate configurations.Reference Deng, Klimov, Solares, Li, Xu and Cannara10 When the T1 surface is oxidized, its adhesion response, against the Si tip counterface, increases by a factor of 2 as compared to its non-oxidized counterpart. Such increase may be attributed to the increased relative surface defect concentration during oxidation as quantified by the XPS measurements (Fig. 1). The increased concentration of oxygen-based defects on the FLG surface may lead to an enhanced hydrophilicity and thus to increased capillary forces between the tip and the oxidized sample. Also, density functional theory (DFT) calculations have suggested that out-of-plane elastic properties of chemically modified graphene surfaces are significantly increased when compared to their unmodified counterparts.Reference Ko, Kwon, Byun, Choi, Park, Kim and Park17
Adhesion force measurements for top-down (T1), bottom-up (T2), oxidized T1 FLG surfaces and their respective substrates.

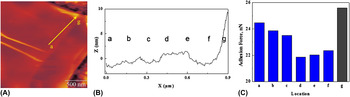
Although it has been reported in the past that graphene edges exhibit elastic, stick-slip behavior when interacting with sharp tips,Reference Hunley, Flynn, Dodson, Sundarajan, Boland and Strachan11 there is little study to date on the role that the measurement location plays in the resulting Si tip–graphene adhesion force. We investigate such effect by conducting pull-off measurements from FLG central areas to edges. In all cases, a general trend exhibiting a decreasing center-to-edge adhesion is noted. As shown in Fig. 3, for a relatively uniform thickness, center-to-edge [(a)–(g)] adhesion measurements show a decreasing trend from around 24 to 22 nN with the exception of point g (see increased topography) where the tip interacts with the FLG very edge and the adhesion increases above 25 nN. This behavior may be attributed to the density of atoms surrounding the Si tip. In particular, one may postulate that the central FLG region provides an extended domain of tip/surface interaction, which decreases as measurements are taken toward the edge of the flake. The densely packed atoms of the central flake region will exert large short-range forces on the tip compared to the less densely packed and more disordered, due to the presence of edge defects, edge atoms. On the other hand, the observed trend may be associated with changes in topography or a combination of both.
(A) Typical AFM image of T1 FLG surface, (B) corresponding height profile for center-to-edge (a–g), and (C) corresponding adhesion force measurements for center-to-edge (a–g).

C. Si–graphene COF investigations in air and liquid environments
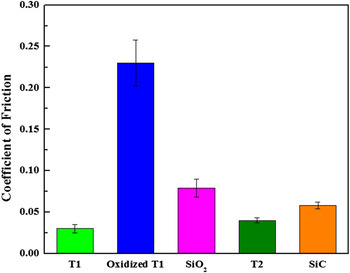
Lateral force microscopy (LFM) friction measurements on both T1 and T2 surfaces indicate highly lubricious nanotribological behavior between Si and graphene for a normal loading range between 5 and 40 nN, as shown in Fig. 4. In all measurements, the COF values measured for the FLG surfaces are lower than those measured for the bare underlying substrates confirming such lubricious behavior. The T1, liquid exfoliated, surfaces exhibit a COF of around 0.03 whereas the COF of the T2, bottom-up grown, surfaces is measured to be around 0.04. The slightly higher value observed for T2 may be attributed to the relatively larger concentration of defects compared to the T1 surface. The shearing effort of the sliding tip when in contact with such defects leads to an increased COF. It is worth noting that the obtained values—for both T1 and T2—are marginally higher, but in the same range, than previously reported COF values for mechanically exfoliated FLG.Reference Lin, Kim and Jun12 The lowest COF exhibited by mechanically exfoliated samples is attributed to their defect-free planar lattice.Reference Peng, Wang and Li13
LFM friction measurements in air for top-down (T1), bottom-up (T2), and oxidized T1 FLG surfaces and their respective substrates.

Furthermore, oxidized T1 surfaces are observed to exhibit an approximately 8-fold increase in the measured friction coefficient. This is due to the increased defect concentration on the modified FLG surface, which enhances its hydrophilicity and thus increases the tip-sample capillary interaction. Previous work using oxidized graphene, grown on Cu by CVD, reported a 7-fold COF increase compared to nonmodified surfaces.Reference Ko, Kwon, Byun, Choi, Park, Kim and Park17 Also, such a significant increase with respect to a pristine counterpart has been recently observed for oxidized graphene, which is grown by CVD on SiO2.Reference Berman, Erdemir, Zinovev and Sumant18
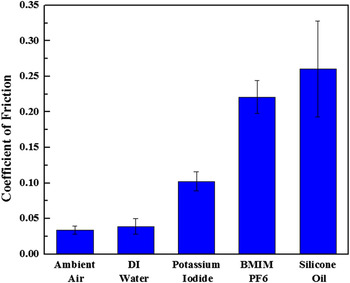
Figure 5 shows the frictional behavior of Si/FLG-T2 prepared-interfaces in the presence of various liquids. At first, we utilized a thin layer of DI water as the third body medium between Si and the graphene surface. The resulting COF value is very close to the one measured for the case of Si sliding on FLG in ambient air conditions. Water molecules condensing on both the graphene surface and the hydrophilic Si tip during ambient conditions lead to increased capillary actions during interfacial sliding. X-ray reflectivity measurements suggest layering, and not de-wetting, of water on hydrophobic graphene surfaces extending to about 1 nm from the surface.Reference Fenter and Lee26
LFM friction measurements in different liquids for bottom-up (T2) synthesized FLG.

When using ionic liquid environments such as iodine solution and BMIM-PF6 an increase in COF for Si/FLG interfaces is observed as compared to those measured for Si/water/FLG interfaces. The increase is more pronounced in the case of BMIM PF6 in 2-propanol which has a higher density than the iodine solution containing more than 95 wt% water. Frictional behavior in ionic liquids may depend on the solvent used and its respective polarity index. In particular, the significantly increased nanoscale friction measured for BMIM PF6/2-propanol solution can be due to aggregate formation driven by the less polar nature of 2-propanol compared to water.Reference Dorbitz, Ruth and Krag27 In such case, the reduced polarity leads to charge delocalization within the ions leading to anion–cation aggregates. Some fraction of these aggregates may be mobile which can lead to lubricant replenishment, and thus low friction, when utilizing thin lubricant layers and relatively high loads.Reference Bhushan, Palacio and Kinzig28 However, in our case, the hydrophilic PF6 anions may exhibit a greater tendency to react with the oxygen-based defects, and therefore anchor on the graphene surface. The latter can promote relatively high localized pressures between the tip and the aggregate formations resulting in increased shear stress fields and thus leading to increased friction. At this point, one should note that such hydrophilic anions might also attach to the moving tip counterface thus suggesting another friction increasing source in the nanoscale. Furthermore, the use of viscous synthetic lubricants such as silicone is observed to further increase the COF of the three-body interface. This is in accordance with the study of Robinson et al.Reference Robinson, Kay and Kolosov6 who reported that the friction coefficient is higher for FLG in nonpolar dodecane than in water. This increase was attributed to the formation of a 2 nm thick viscous dodecane layer on the FLG surface.
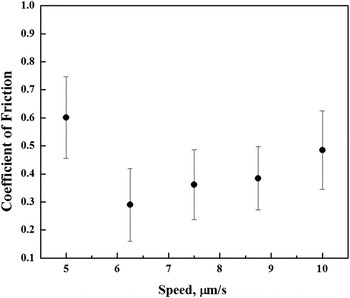
In our case, we further explore such potential layer formation dynamics by studying the effect of tip sliding speed on the resulting COF, for the available LFM speed range. As shown in Fig. 6, a Stribeck-like behavior is found on the small scale and may indicate a transition from the boundary to the elastohydrodynamic to the hydrodynamic regime.Reference Mate29 Such observed behavior has been also recently reported by Nalam et al.Reference Nalam, Ramakrishna, Espinosa-Marzal and Spencer30 for the case of silica surfaces with absorbed brush-like polyelectrolyte copolymers in viscous solvent mixtures of glycerol and ethylene glycol. Therefore, the observation of such Stribeck-like behavior may serve as an alternative approach to qualitatively monitor the thickness of the viscous lubricant layer on the FLG surface at different sliding speeds.
Typical Stribeck-like behavior of T2 FLG in silicone oil of 4.2 cP viscosity.

IV. CONCLUSIONS
This study focuses on the nanotribological characterization of bottom-up and top-down prepared FLG under air and in various liquid environments. It is observed that the T1-Ox adhesion against the Si tip increases by a factor of 2 as compared to T1 due to the increased concentration of oxygen-based defects on the T1-Ox surface. In addition, it is found that, for relatively uniform thicknesses, center-to-edge adhesion follows a decreasing trend that can be attributed to the varying density of the atoms surrounding the Si tip.
Furthermore, a highly lubricious nanotribological behavior of T1 and T2 FLG in air (0.03–0.04) is reported. A large difference (8-fold increase) in measured COF between T1 and T1-Ox is noted and can be attributed to increased sample-tip capillary interactions due to increased defect concentration. The frictional response of T2 samples in different liquid environments is consistent with the absence or presence of viscous aggregates, respectively and the role that viscosity plays. For viscous liquids, such as silicone, a Stribeck-like behavior is observed indicating transitions across different regimes at the nanoscale. The latter may be proven important for the qualitative monitoring of the thickness of viscous layers on graphene surfaces at the nanoscale.
ACKNOWLEDGMENTS
K.A.S. gratefully acknowledges the Mechanical and Aerospace Engineering Department, the Statler College of Engineering and Mineral Resources, and the Office of the Provost at West Virginia University for the provision of start-up funding. CDS thankfully acknowledges the Department of Energy under Award No. DE-FEOO11300. Finally, we acknowledge use of the WVU Shared Research Facilities.