Introduction
As income inequality in the United States continues to grow (Casselman Reference Casselman2018; Casselman and Flowers Reference Casselman and Flowers2014; Cassidy Reference Cassidy2018), many are asking why only the richest Americans appear to be benefiting from the current economic system. As we learn more about the causes of expanding income differences, it is becoming increasingly clear that politics and policy have an important influence on the trajectory of inequality. Recent studies suggest that the shared prosperity observed for over three decades in the mid-1900s deteriorated as a result of policy decisions made by the government (Bartels Reference Bartels2008; Hacker and Pierson Reference Hacker and Pierson2010; Kelly Reference Kelly2009; Volscho and Kelly Reference Volscho and Kelly2012). Changes in program spending, the tax code, monetary policy, and regulatory policy all have the potential to shape the distribution of income.
In addition to the relationship between national politics and inequality, there is also growing evidence demonstrating that the American states can affect the income distribution. Although the U.S. federal government certainly has the capacity and authority to influence economic outcomes, under certain circumstances, the states can have a substantial effect on their respective economies. Specifically, the states often have noticeable control over certain aspects of the economy when the federal government is relatively inactive in trying to influence those same areas of the economy, which some argue is our situation in the current era of rising inequality (Franko and Witko Reference Franko and Witko2017; Kelly and Witko Reference Kelly and Witko2012), creating a policy vacuum that states can step in and fill.
The research connecting state politics and inequality, however, has only begun to uncover the ways in which state policy affects the income gap. This project aims to expand our understanding of state government action and inequality by demonstrating the importance of state fiscal policy for the distribution of income, particularly during periods of economic crisis. This study focuses on how the states respond to poor economic conditions and how these policy decisions influence the financial situations of the rich and poor in different ways.
In addition to the amplified role of the states when the federal government is slow to act, state governments are vital actors in times of fiscal stress and economic downturn as nearly every state must make tough policy decisions related to taxes and spending to address budget deficits, both of which are policies that can shape the income distribution. Focusing on periods when states fall into economic decline is important for the study of subnational inequality as those with fewer economic resources are the most likely to experience the consequences of their state’s fiscal response during these times. For instance, states will almost certainly place additional strain on those with lower incomes if they choose to cut vital social spending programs as a way to balance the budget rather than increasing tax revenue to maintain or even increase spending levels.
To demonstrate the effect of state policy decisions on inequality when the economy is faltering, unique measures of unexpected state spending and revenue changes from 1987 to 2012, also referred to as fiscal policy shocks, are used to assess how these policy shocks influence state-level income inequality between the rich and the poor. Then, several nationally representative surveys fielded after the Great Recession are examined to test one implication of the proposed mechanisms connecting state policy decisions and inequality. That is, the analysis assesses whether those living in states that rely on spending cuts to address poor economic conditions are worse off financially as a result of the recession than those in states that avoid large budget cuts. Collectively, the results suggest that how the states respond to economic crisis can have long-term, lasting effects on inequality and the general well-being of the public.
Politics, Policy, and Income Inequality
Early studies of income inequality focused on how technological change and globalization were the main causes of the growing income gap.Footnote 1 Not only is this argument incomplete, but it also developed a narrative that inequality is inevitable. As more recent research has uncovered, this story of inevitable inequality appears to be misguided. Several influential studies show that political decision making plays a crucial role in shaping the income distribution (Bartels Reference Bartels2008; Hacker and Pierson Reference Hacker and Pierson2010; Kelly Reference Kelly2009; Piketty and Saez Reference Piketty and Saez2003; Smeeding Reference Smeeding2005). Broadly speaking, this work reasonably suggests that public policy shapes how the economy functions, the extent to which certain groups benefit more from economic outcomes than others, and how much income redistribution occurs via taxes and transfers.
While much of this research focuses on the relationship between national politics and inequality, there is also growing evidence showing that the American states can affect the income distribution. Although the U.S. federal government certainly has the capacity and authority to influence economic outcomes, the states can have a substantial effect on their respective economies. State and local elected officials account for 95% of all elected positions in the country and the combined spending of subnational governments exceeds overall levels of federal spending (Donovan et al. Reference Donovan, Smith, Osborn and Mooney2014). Moreover, the states often have noticeable control over certain aspects of the economy when the federal government does not actively try to influence those same areas of the economy, which some argue is our situation in the current era of rising inequality (Franko and Witko Reference Franko and Witko2017). In other words, federal inaction creates a policy void that states can step in and fill.
Importantly, a number of studies have found that income inequality can vary substantially across the states, with much of this variation occurring within states over time (e.g., Frank Reference Frank2009; Franko, Kelly, and Witko Reference Franko, Kelly and Witko2016; Langer Reference Langer1999). This suggests the possibility that state actions might influence the income distribution within their borders. Indeed, Kelly and Witko (Reference Kelly and Witko2012) show that those states where the working and lower classes have stronger political representation also have less skewed income distributions. Those with fewer resources tend to achieve better representation via electing more left-leaning governments and having stronger labor unions, leading to better economic outcomes for those with lower incomes.Footnote 2 Directly related to the fiscal policy decisions made by the states, Hayes and Vidal (Reference Hayes and Vidal2015) show that states relying on more progressive forms of tax revenue and that spend more on cash assistance programs and unemployment compensation have lower levels of economic inequality.Footnote 3
Overall, the recent work connecting state policy to economic inequality gives reason to believe that the states play an important role in shaping the income distribution in the United States. Given the tendency of the federal government to perpetuate policy inaction and the status quo (Enns et al. Reference Enns, Kelly, Morgan, Volscho and Witko2014; Franko and Witko Reference Franko and Witko2017; Hacker and Pierson Reference Hacker and Pierson2010), the importance of state policy making will likely persist, or even increase, in the near future.
State Responses to Fiscal Crisis
Of course, state policy decisions do not occur in a vacuum. Policy makers are often required to respond to external, sometimes unexpected changes to the environment. These changes typically involve shifts in the economy, the emergence of new social issues, or some combination of the two. The economic crisis of 2008–2012 provides a contemporary example of a situation where policy decisions were required by essentially every state government. During the Great Recession, gross domestic product (GDP) declined by 4.3% in less than two years and the unemployment rate reached a high of 10% (Rich Reference Rich2013). As a result, the states were tasked with making a number of difficult fiscal decisions. Similar to most economic downturns, weak economic growth and high unemployment typically leads to less tax revenue, and because nearly every state has some form of a balanced budget requirement, these revenue losses must be addressed in some fashion. For the most part, the states have two main policy options to work with when they lose revenue: tax increases and/or spending cuts.Footnote 4 This puts lawmakers into a particularly difficult situation as more people are in need of the social programs provided by the states during times of economic decline (e.g., unemployment compensation, health care, and cash assistance).
In general, many states tend to rely on public spending cuts rather than tax increases when they are faced with budget gaps. While a majority of states enacted modest tax hikes between 2008 and 2011, lost revenues were largely addressed by reducing expenditures. The areas of spending that were influenced the most during this time period were education, public welfare, health, and hospitals, which are also the highest spending categories in the states on average. Not only does the recession affect those who rely on state programs, but these budget cuts are also reflected in public sector employment. More than 500,000 state and local government jobs were lost between 2008 and 2012 (Gordon Reference Gordon2012).
Responses to economic crisis, however, do vary from state to state and from one recession to the next (Campbell and Sances Reference Campbell and Sances2013). These policy decisions can be driven by the magnitude of a given state’s economic difficulties, but they are also shaped by the political orientation of the government making the policy choices. Rigby and Hatch (Reference Rigby and Hatch2017) find, for instance, that Democratic state governments are more likely to rely on revenue increases during recessions while Republican governments are more dependent on program cuts. This literature shows that the states can differ in their approaches to addressing economic recessions, suggesting the possibility that these decisions can play a role in how well state residents are able to cope with their own financial difficulties.
Considering the influence of state policy on the income distribution discussed above, an important consequence of how states respond to economic crisis may be the effect of these decisions on inequality. In other words, while fiscal policy shapes income inequality regardless of a state’s economic health (Franko and Witko Reference Franko and Witko2017; Hatch and Rigby Reference Hatch and Rigby2015; Hayes and Vidal Reference Hayes and Vidal2015), the influence of state policy decisions on economic outcomes may be magnified during periods of economic distress. The possibility that policy changes have a more sizable effect on income inequality when the economy is in decline when compared with more typical conditions is likely due to the accumulation of obstacles faced by those at the bottom of the income ladder. These difficulties include a decline in wages, unemployment, debt accumulation, the loss of health insurance coverage, and limited personal savings, to name a few.
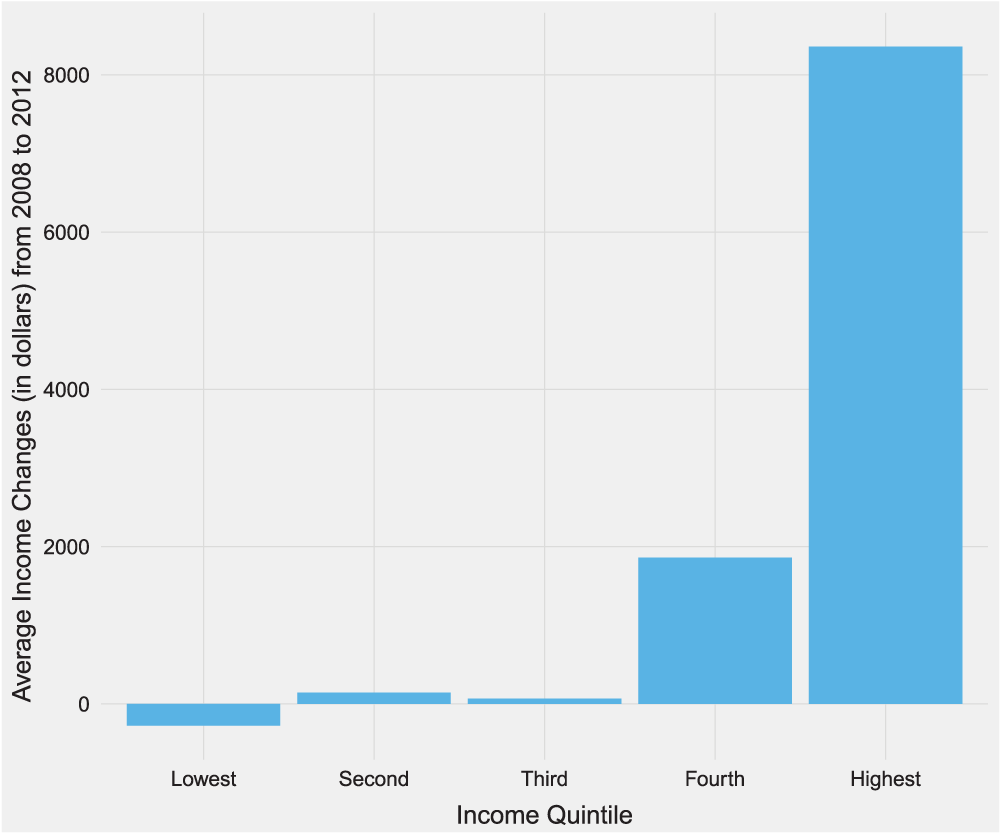
More broadly, differences in how the rich and the poor are able to manage financial shocks can be thought of in terms of economic insecurity. This concept refers to one’s income volatility, the availability of resources to protect against future financial loss, and confidence in one’s ability to guard against potential losses. Perhaps unsurprisingly, those with fewer resources are typically more economically insecure than other groups, and levels of economic insecurity in the United States have grown in recent decades (D’Ambrosio and Rohde Reference D’Ambrosio and Rohde2014; Hacker Reference Hacker2006). As a result, although nearly everyone is susceptible to financial loss during an economic crisis, the wealthy are much more resilient than others and can recover from economic shocks more easily. Again using the Great Recession as an example, Figure 1 shows the income changes by income quartiles in the United States between 2008 and 2012. As the plot demonstrates, those with the highest incomes managed an impressive recovery in the post-recession years while those at the bottom experienced income loss over the same time period.
Household income growth by income quartile, 2008–2012.
Source. Bureau of Labor Statistics, Cobet (Reference Cobet2014).

This discussion suggests that government responses to economic crisis may have an important effect on income inequality. On one hand, states that are able to maintain or even increase spending on essential programs during times of economic decline will likely be able to limit the extent to which there are disparities in how the rich and the poor are able to manage fiscal hardship. This has the potential to reduce the expansion of income differences that will occur due to the ability of the rich to recover from economic downturns. On the other hand, those states that decide to cut spending when many citizens are at their most vulnerable and most reliant on government support will likely exacerbate the income gap between the rich and the poor. In addition, these effects will likely have both short-term and long-term consequences for inequality. Without adequate support from government programs, lower-income groups will struggle financially in the immediate aftermath of an economic downturn, as well as have more difficulty recovering from these policy shocks. In other words, the decisions states make when faced with a faltering economy can have a lasting influence on the distribution of income.
Methods
To assess the influence of state responses to economic crisis on inequality, two types of analyses are conducted. The main analysis examines state time-series data from 1987 to 2012. This time period is used because appropriate measures of state income inequality and unexpected state government actions, referred to as “policy shocks,” are available during these years (data and measures are discussed in more detail below). The 1987–2012 period also includes three national recessions, during which many states were faced with difficult economic circumstances. Examining the differences in the fiscal decisions made by the states in response to poor economic conditions and whether these decisions are associated with changes in the income gap over a number of recent economic downturns will allow for a careful assessment of the argument that unexpected state policy shocks have important consequences for inequality.
The second analysis relies on several nationally representative surveys to study one implication of the proposed relationship between state responses to economic crisis and the income inequality: residents in those states that rely on spending cuts to address poor economic conditions will be worse off financially than those in states that avoid large budget cuts. The analysis focuses on state policy decisions in response to the Great Recession and post-recession survey questions that specifically ask individuals about how the Great Recession influenced their finances. For this portion of the study, state-level policy shocks measured during the Great Recession period are combined with the individual-level responses to survey questions following the economic crisis.
State Time Series: Data and Measures
State-level income inequality is measured as the ratio between income at 80th percentile and 20th percentile, and is referred to as the inequality ratio.Footnote 5 Although there are a number of ways to measure income inequality, the ratio measure is used for several reasons. First, the interpretation of the measure is straightforward—the value of the ratio indicates, in relative terms, how much more the rich earn than the poor in a given state and year. For instance, a value of 5 (i.e., the approximate average inequality ratio for all states and years under analysis) means that those in the 80th income percentile earn five times more than those in the 20th income percentile. Second, the discussion above suggests that those at the bottom of the income distribution are the most likely to be influenced by government action during economic crisis, and those with the most resources tend to withstand and recover from downturns with less difficulty than other groups. Thus, the inequality ratio provides a measure that focuses on how policy decisions affect these two groups (i.e., lower- and higher-income groups).Footnote 6 Finally, as the expansion of inequality over the last several decades appears to be largely driven by the rising incomes of the rich at the expense of those in bottom portion of the income distribution (Piketty and Saez Reference Piketty and Saez2003), it is essential that the measure of inequality being used can capture these changes. One advantage of using the inequality ratio described here is that it certainly accounts for these attributes of inequality while other measures do not. The widely used Gini coefficient, for instance, does a particularly poor job of detecting changes at the top and bottom of the income distribution (see Atkinson Reference Atkinson1970).Footnote 7 In addition to the inequality ratio, the percentage of state income held by those in the 80th and 20th percentiles (i.e., income shares) are also examined separately to assess how state policy decisions influence each group.Footnote 8
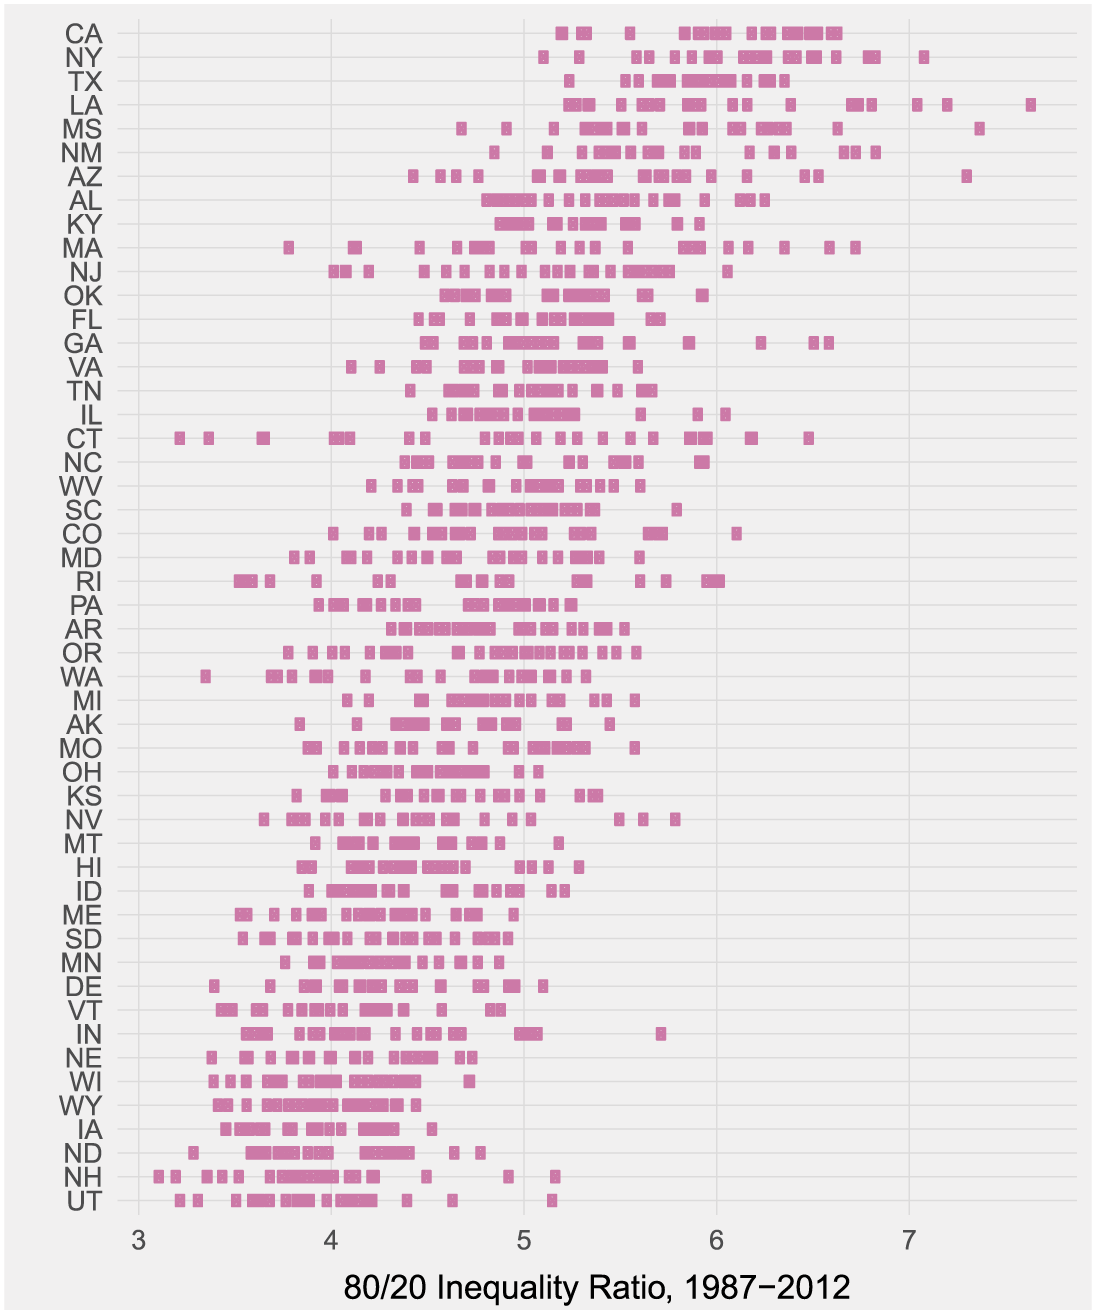
Figure 2 shows the 80/20 inequality ratio for each state over the 1987–2012 period—2012 is the most recent year the inequality measure is available. The plot reinforces the claim that income inequality can vary substantially across the states and within states over time. In some years, the top decile has earned as low as four times the income of those in the bottom decile while other states have seen their wealthiest residents earn more than 12 times as much as those with low incomes. More generally, the figure demonstrates that it is possible for the states to experience very different levels of inequality. The impending task is to determine whether this variation is at least partially a result of how state governments respond to economic downturns.
State income inequality ratio (80/20), 1987–2012.
Source. Voorheis (Reference Voorheis2014).
Note. Points represent the observed income inequality ratio (x-axis) for each year between 1987 and 2012.

Measures of unexpected state fiscal policy decisions—that is, policy shocks including both spending and revenue changes—are created using reports from the National Association of State Budget Officers (NASBO) Fiscal Survey of States. As part of the survey’s aim to assess state fiscal health, each year it collects information on any spending and tax changes that are made after a state’s budget was passed. In other words, these reports account for unexpected state spending and revenue decisions that are made as a result of gaps in state budgets. The NASBO budgeting data are ideal for measuring state policy decisions in the context of this study for several reasons. First, because the reported spending and revenue changes occur after state budgets have been passed, these changes capture unexpected fiscal policy shocks (see Poterba Reference Poterba1994). Second, these unexpected fiscal changes are reported during periods of economic decline. Together, these two characteristics of the data incorporate the central elements of this research: (1) unexpected state policy decisions (2) that occur during times of economic crisis.
The third benefit of using the NASBO reports is that these are explicit changes to spending and revenue being made by state governments, something that is not necessarily true when using total annual state fiscal data (e.g., from the U.S. Census Bureau). State spending and revenue figures often change without any government action at all. This mainly occurs when public need for some program increases (declines) and leads to more (less) spending, or when the economy shrinks (grows) and leads to less (more) tax revenue. Of course, economic downturns typically lead to higher levels of reliance on public programs and less tax revenue (particularly when wages and consumption decline), which makes a reliance on standard state fiscal data particularly problematic for the purposes of this study because they do not always represent explicit policy responses to unexpected economic troubles. Therefore, using basic state spending and revenue data would be an imprecise way of examining policy change while the NASBO data allow for a more accurate way to measure unexpected policy decisions made by state governments.
This is not to say that typical state tax and spending policy is of little consequence to income inequality. As mentioned earlier, the existing literature suggests that state fiscal policy does influence income differences. Instead, the goal of this analysis is to assess whether a specific type of policy making—that is, unexpected policy changes in response to economic crisis—can alter levels of inequality in the states. Although state governments are not regularly required to make these kinds of unexpected policy decisions, these policies may nonetheless have immediate and long-term effects on the financial situations of state residents for the reasons discussed in the previous section.
The NASBO reports include information on both state spending and revenue changes starting in 1987, which is the first year used in the time-series analyses below.Footnote 9 Using the data collected from the reports, three annual measures of unexpected state fiscal change are created from 1987 to 2012.Footnote 10 The first accounts for unexpected state budget cuts as a percentage of total state spending from the previous year.Footnote 11 The measure, referred to as negative budget shocks, is expected to have a positive relationship with the income inequality ratio as higher values on the measure indicates that a state is relying on budget cuts in response to economic decline, leading to more unequal outcomes. It should be noted that in this context, the term budget shocks is synonymous with spending shocks. The second measure, state revenue shocks, is the total unexpected revenue change as a percentage of total state revenue from the previous year.Footnote 12 Higher values on this measure suggests states are relying more heavily on increasing revenue and should lead to lower levels of inequality—that is, relative to states that rely very little on revenue increases when the economy is faltering.
While those states relying on budget cuts during poor economic periods are expected to create worse economic inequality than states that choose to increase revenues as a response to financial trouble, it is likely that a number of states will use some combination of budget cuts and revenue increases during tough economic times. The third measure, referred to as negative fiscal shocks, accounts for a combination of both unexpected spending cuts and revenue changes. The measure is created by subtracting revenue increases from budget cuts and using this value to calculate a percentage change in fiscal policy.Footnote 13 States that mostly rely on budget cuts will have larger positive values on the negative fiscal shock variable while states that rely more on revenue increases will have larger negative values on the measure. Larger negative fiscal shocks are expected to be associated with larger increases in state income inequality.
Each state’s economic health is accounted for using the state coincident index. The index was created by the Federal Reserve Bank of Philadelphia and uses several indicators to provide an overall assessment of the economic conditions in the states. The four state-level indicators used to produce the measure are (1) non-farm payroll employment, (2) average hours worked in manufacturing, (3) the unemployment rate, and (4) wage and salary disbursements. State GDP is used to make sure that the index trend for each state matches its GDP growth over time.Footnote 14 For the purposes of this analysis, the percentage change in the state index is used and is referred to as the state economic health index. On average, the states experience overall growth according to the index at a rate of more than 2% for the period under analysis (i.e., 1987–2012).
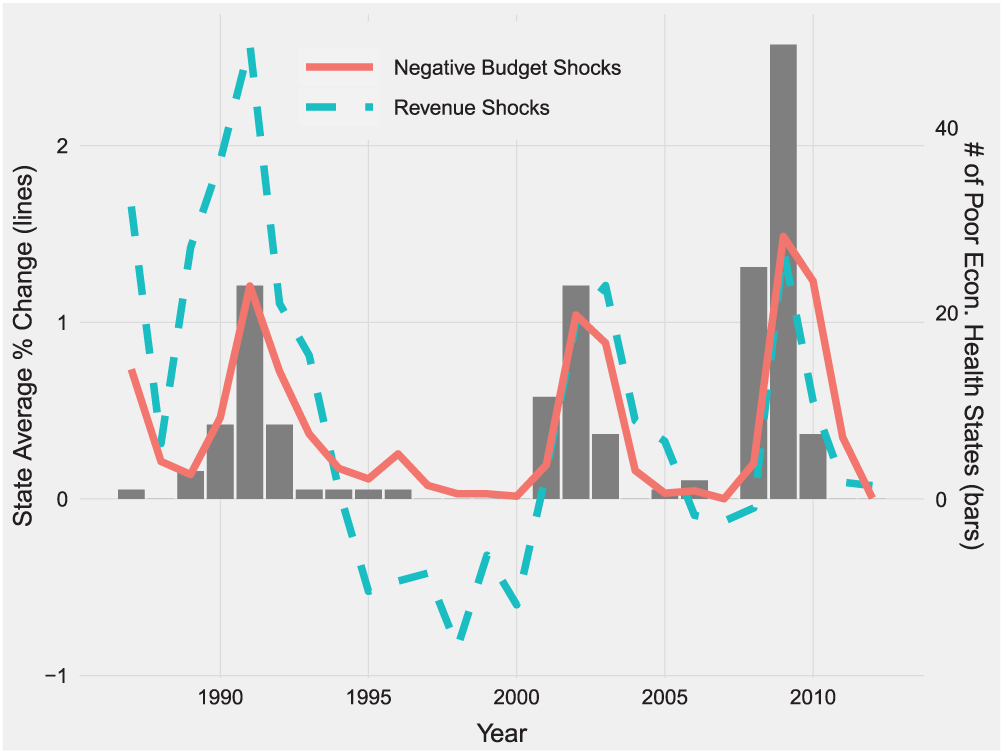
Focusing specifically on periods of economic decline, Figure 3 shows the number of states in each year that experience negative changes in the economic health index (bars), along with the overall average of the state negative budget shocks and revenue shocks (lines). The economic health index appears to align well with the three national economic recessions that occurred during this time period—that is, 1990–1991, 2001, and the Great Recession (2008–2009)Footnote 15—and the state fiscal shock variables described above. Consistent with the earlier overview of state responses to economic crisis, the plot demonstrates that states often make unexpected changes to spending and revenue when they experience slow economic growth.
Negative budget shocks, revenue shocks, and periods of poor economic health in the states.
Note. Poor economic health states (represented by the bars) are defined as those states experiencing negative growth on the economic health index in a given year.

In addition to the variables discussed above, several other state-level factors that might influence income inequality are also accounted for in the analyses presented below. State government liberalism (Berry et al. Reference Berry, Ringquist, Fording and Hanson1998) is used to control for state policies that are likely to shape the income distribution, and the percentage of state union membership is included to account for the influence of labor organization on economic outcomes. Changes in intergovernmental revenue to the states from the federal government is used to control for external program funding that may not be directly associated with state decision making. The percentage of the state population that is 60 years of age or older and the percentage of the population that is non-white are included to account for demographic trends in the states over time.Footnote 16 Additional analyses presented in the online appendix also consider the inclusion of variables accounting for overall state spending and revenue (i.e., not just fiscal shocks), as well as a measure of partisan control of state government. These results are discussed below.
State Time Series: Analysis and Results
As mentioned above, it is possible to observe the effects of state policy on income inequality both over time within states and through comparison across states. As the 80/20 inequality ratio is measured at the state level and over time, a model appropriate for time-series cross-sectional (TSCS) data is needed. An important first step when conducting any time-series analysis is to ensure that each variable used in the analyses are the same order of integration so that meaningful inferences can be made based on results of the models (Enders Reference Enders2015). Using Fisher augmented Dickey–Fuller stationarity tests (specifically designed for TSCS data), it was determined that the inequality ratio variable is trend stationary and the main explanatory variables—that is, the negative budget shock, revenue shock, and negative fiscal shock measures—are also stationary series. The tests demonstrate that government ideology and changes in intergovernmental revenue are also stationary, but that the percent union, percentage of the population that is 60 years or older, and percentage non-white have unit roots. The first difference versions of these variables, however, are stationary series and are therefore used in analyses.
To assess how income differences are shaped by state policy actions and the role of revenue changes on government spending, an autoregressive distributed lag (ADL) model is used to estimate these relationships. The following equation, which includes only a single independent variable for clarity, is used to model the dependent variables under analysis:
 $$ {Y}_{jt}={\alpha}_0+{\alpha}_1{Y}_{j(t-1)}+{\beta}_1{X}_{1jt}+{\beta}_2{X}_{1j(t-1)}+{u}_j+{e}_{jt}. $$
An ADL model is employed here as it is one of the most general time-series models—closely related to the error correction model—and allows researchers to account for both long- and short-term effects over time (Box-Steffensmeier et al. Reference Box-Steffensmeier, Freeman, Hitt and Pevehouse2014; De Boef and Keele Reference De Boef and Keele2008). In the above equation, each observation is a particular state  $ j $ in a given time period
 $ t $. Only one lag of
 $ Y $ and
 $ {X}_1 $ are shown in the equation, but additional lags are often included to produce the best overall model specification, which is typically determined by whether additional lags are statistically different from zero. The individual coefficients on
 $ {\beta}_1 $ and
 $ {\beta}_2 $ are referred to as the immediate (or short-term) effects at time
 $ t $ and
 $ t-1 $, respectively. The long-run effect is estimated as
 $ ({\beta}_1+{\beta}_2)/(1-{\alpha}_1) $, which gives the total effect of
 $ {X}_1 $ over all periods. Finally, the
 $ {u}_j $ term represents state-specific fixed effects. The fixed effects are used to account for any potential cross-sectional heterogeneity and to produce model estimates that are focused on within-state changes over time.
All of the TSCS models presented below include a time trend to account for any trending in the dependent variable. The model results were all examined for autocorrelation using several tests designed specifically for TSCS models with fixed effects. None of the tests for any of the models suggest the presence of autocorrelation.Footnote 17
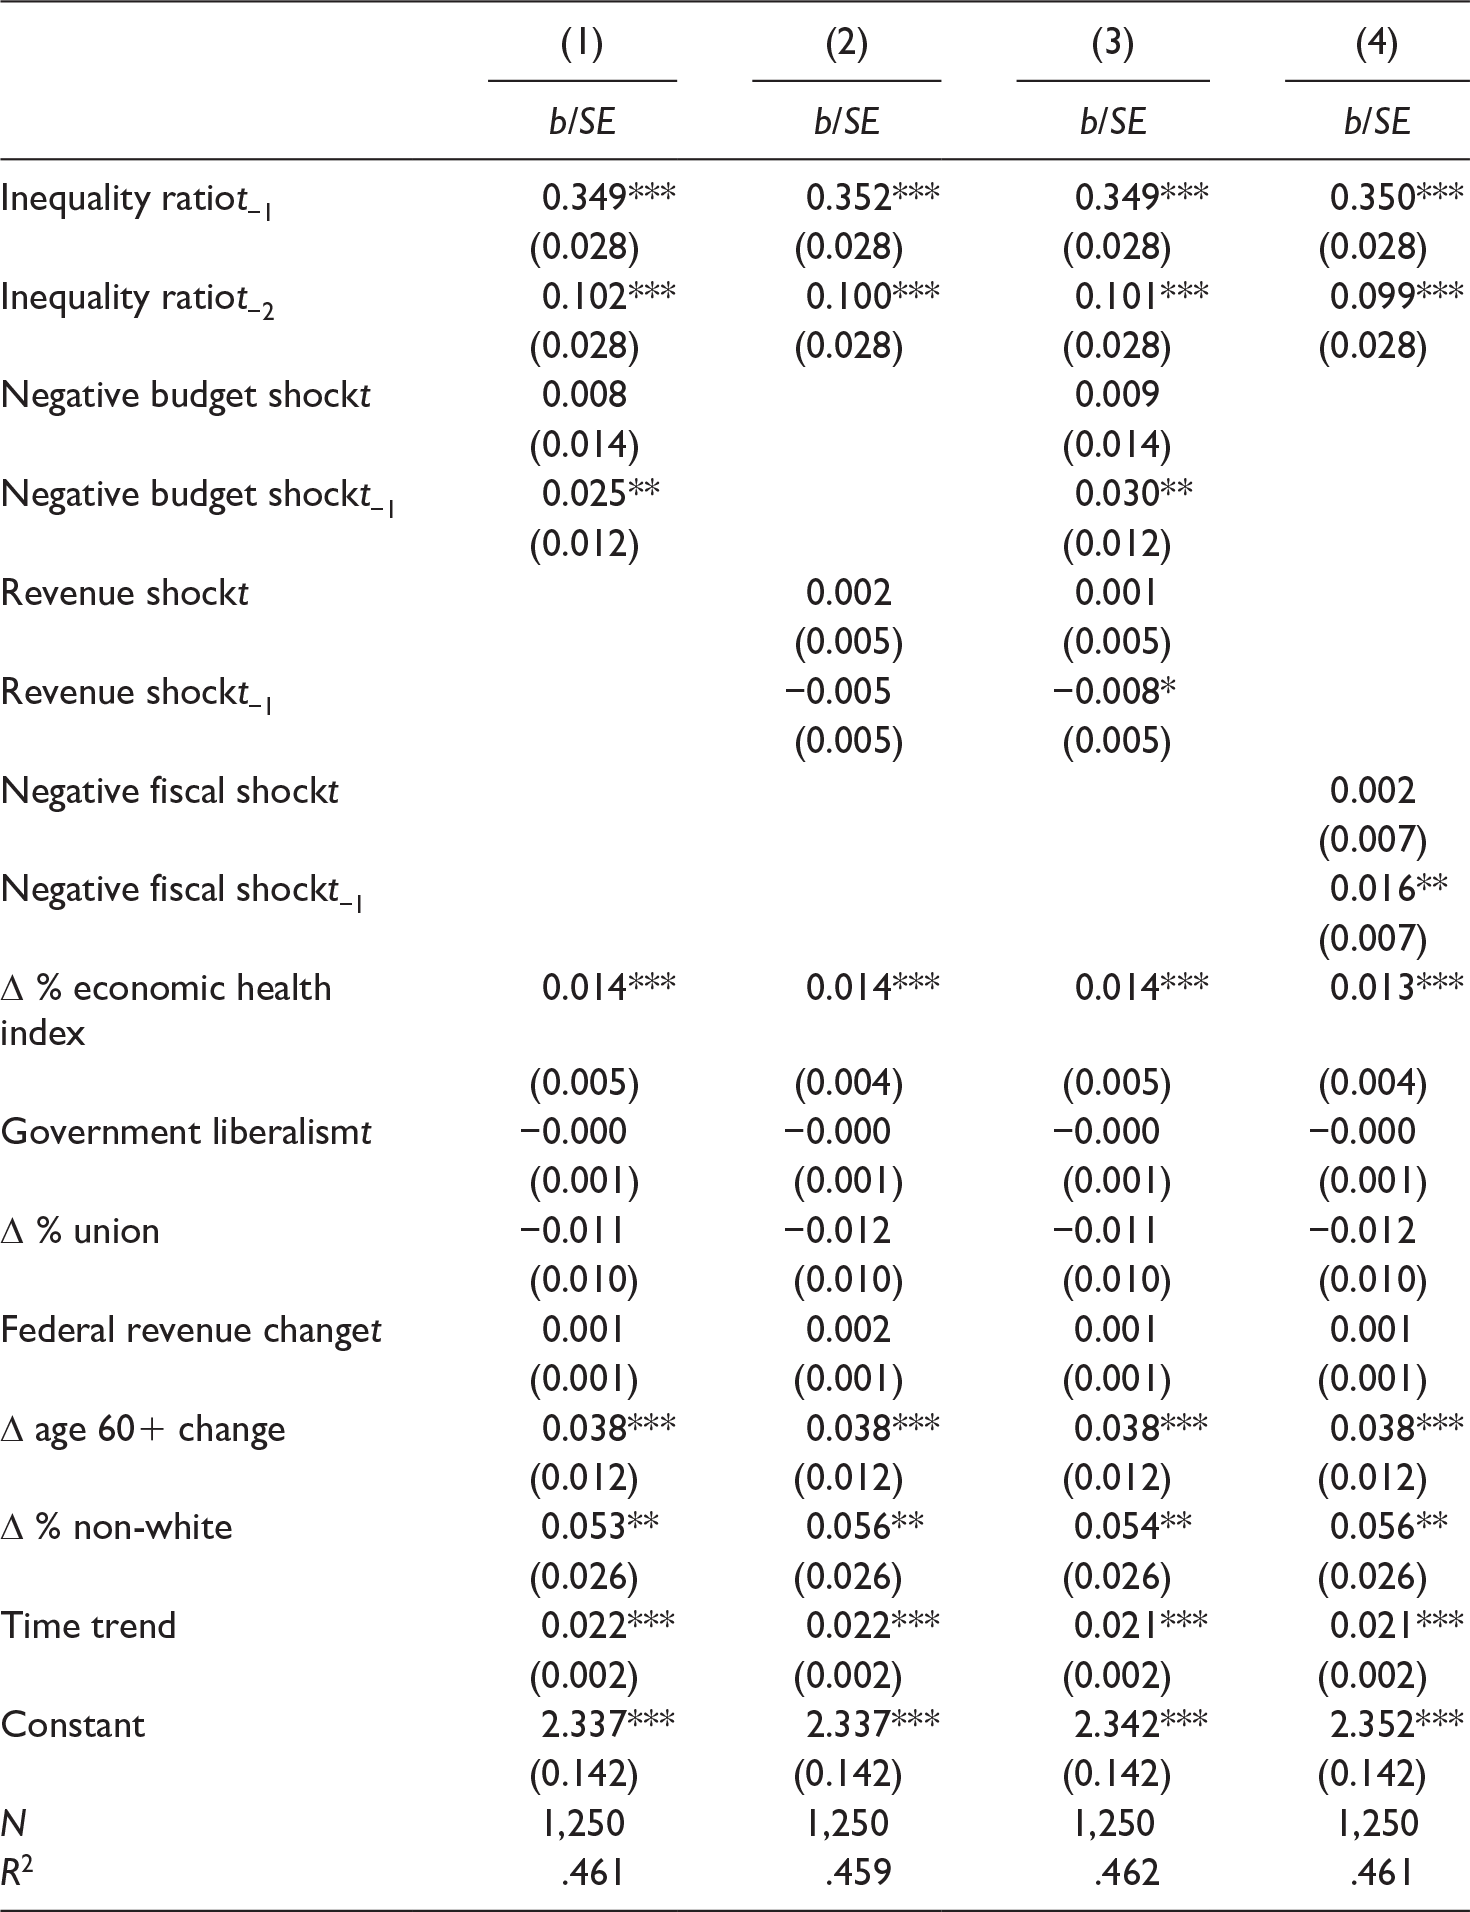
The first set of results are presented in Table 1. For each model in Table 1, the dependent variable is the income inequality ratio. The first model includes the negative budget shock measure, the second includes the revenue shock measure, the third model estimates the effects of both the budget shock and revenue shock variables in the same model, and the final model examines the influence of the negative fiscal shock measure (accounting for budget and revenue changes in a single measure) on state inequality. Examining the coefficients on the negative budget shock variable (Models 1 and 3), unexpected spending cuts during periods of economic decline are associated with higher levels of income inequality as expected. This is especially true when looking at the short-run effects of budget shocks in the previous year (i.e., the  $ t-1 $ coefficients) on the inequality ratio in Models 1 and 3, which are both positive and statistically different from zero. The effect of state revenue shocks appear to be less consequential for inequality, although the lagged version of the variable is negative in both Models 2 and 3 (as expected) and is marginally statistically significant in Model 3 (at the .10 level). Finally, the combined effect of state fiscal shocks is positive and statistically different from zero (see Model 4), demonstrating that income inequality grows in the short-run when states rely more on budget cuts than increasing revenue in response to difficult economic times.Footnote 18
The Effect of State Fiscal Shocks on Income Inequality (80/20 Ratio).

Note. Estimates are from autoregressive distributed lag (ADL) models with state fixed effects. All variables were examined to determine levels of integration using Fisher augmented Dickey–Fuller stationarity tests (specifically designed for TSCS data). A first difference (Δ) version of the variable is used when tests indicated that it is a non-stationary series. In all cases when non-stationarity was detected, the first difference version of the series was determined to be stationary. TSCS = time-series cross-sectional.
*p < .10. **p < .05. ***p < .01.
The importance of state policy decisions for economic inequality is also apparent when examining the long-run (or total) effects of negative budget shocks and negative fiscal shocks.Footnote 19 The long-run effect of state budget shocks (from Table 1, Model 3) is 0.070. In other words, an unexpected percentage point budget cut is estimated to increase the inequality ratio by 0.070. When considering the wide range of budget cuts made by the states over this period of time, this effect can be sizable. A state with an average income inequality ratio of 4.5, for instance, that unexpectedly cut its budget by 4% (i.e., the difference between the 1st and 99th percentile) would be expected to increase inequality by 6.2%.Footnote 20 The long-run effect of a state fiscal shock (from Table 1, Model 4) is 0.034, also a fairly substantial effect. Again considering an average inequality ratio of 4.5, the difference between a state that relies mostly on revenue increases in response to an economic downturn (–6%, or the 1st percentile) versus state that relies mostly on budget cuts (+4%, or the 99th percentile) is a fiscal shock of about 10 percentage points. This difference is expected to lead to a long-run increase in income inequality of 7.5%.Footnote 21
Although the measures of unexpected state spending and revenue changes largely occur in response to substantial declines in economic health, some states do make unexpected fiscal changes when the economy is generally doing well (see Figure 3). To ensure that the findings presented in Table 1 are similar when specifically considering periods of economic decline, Models 3 and 4 are replicated with the only difference being that the models are estimated using measures of the policy shock variables that only account for shocks when a state’s economic health is declining. The expectation is that unexpected policy changes will be particularly influential when a state’s economy is doing very poorly (i.e., experiencing negative growth).Footnote 22 To preserve space, the model results are included in Online Appendix Table A2. The long-run effects of each policy shock variable (and confidence intervals) from both sets of models is displayed in Online Appendix Table A3 so that the results can be easily compared. As expected, the size of the long-run policy shock effects are substantially larger when looking only at changes made during very poor economic situations. This is the case for all three state policy shock measures.
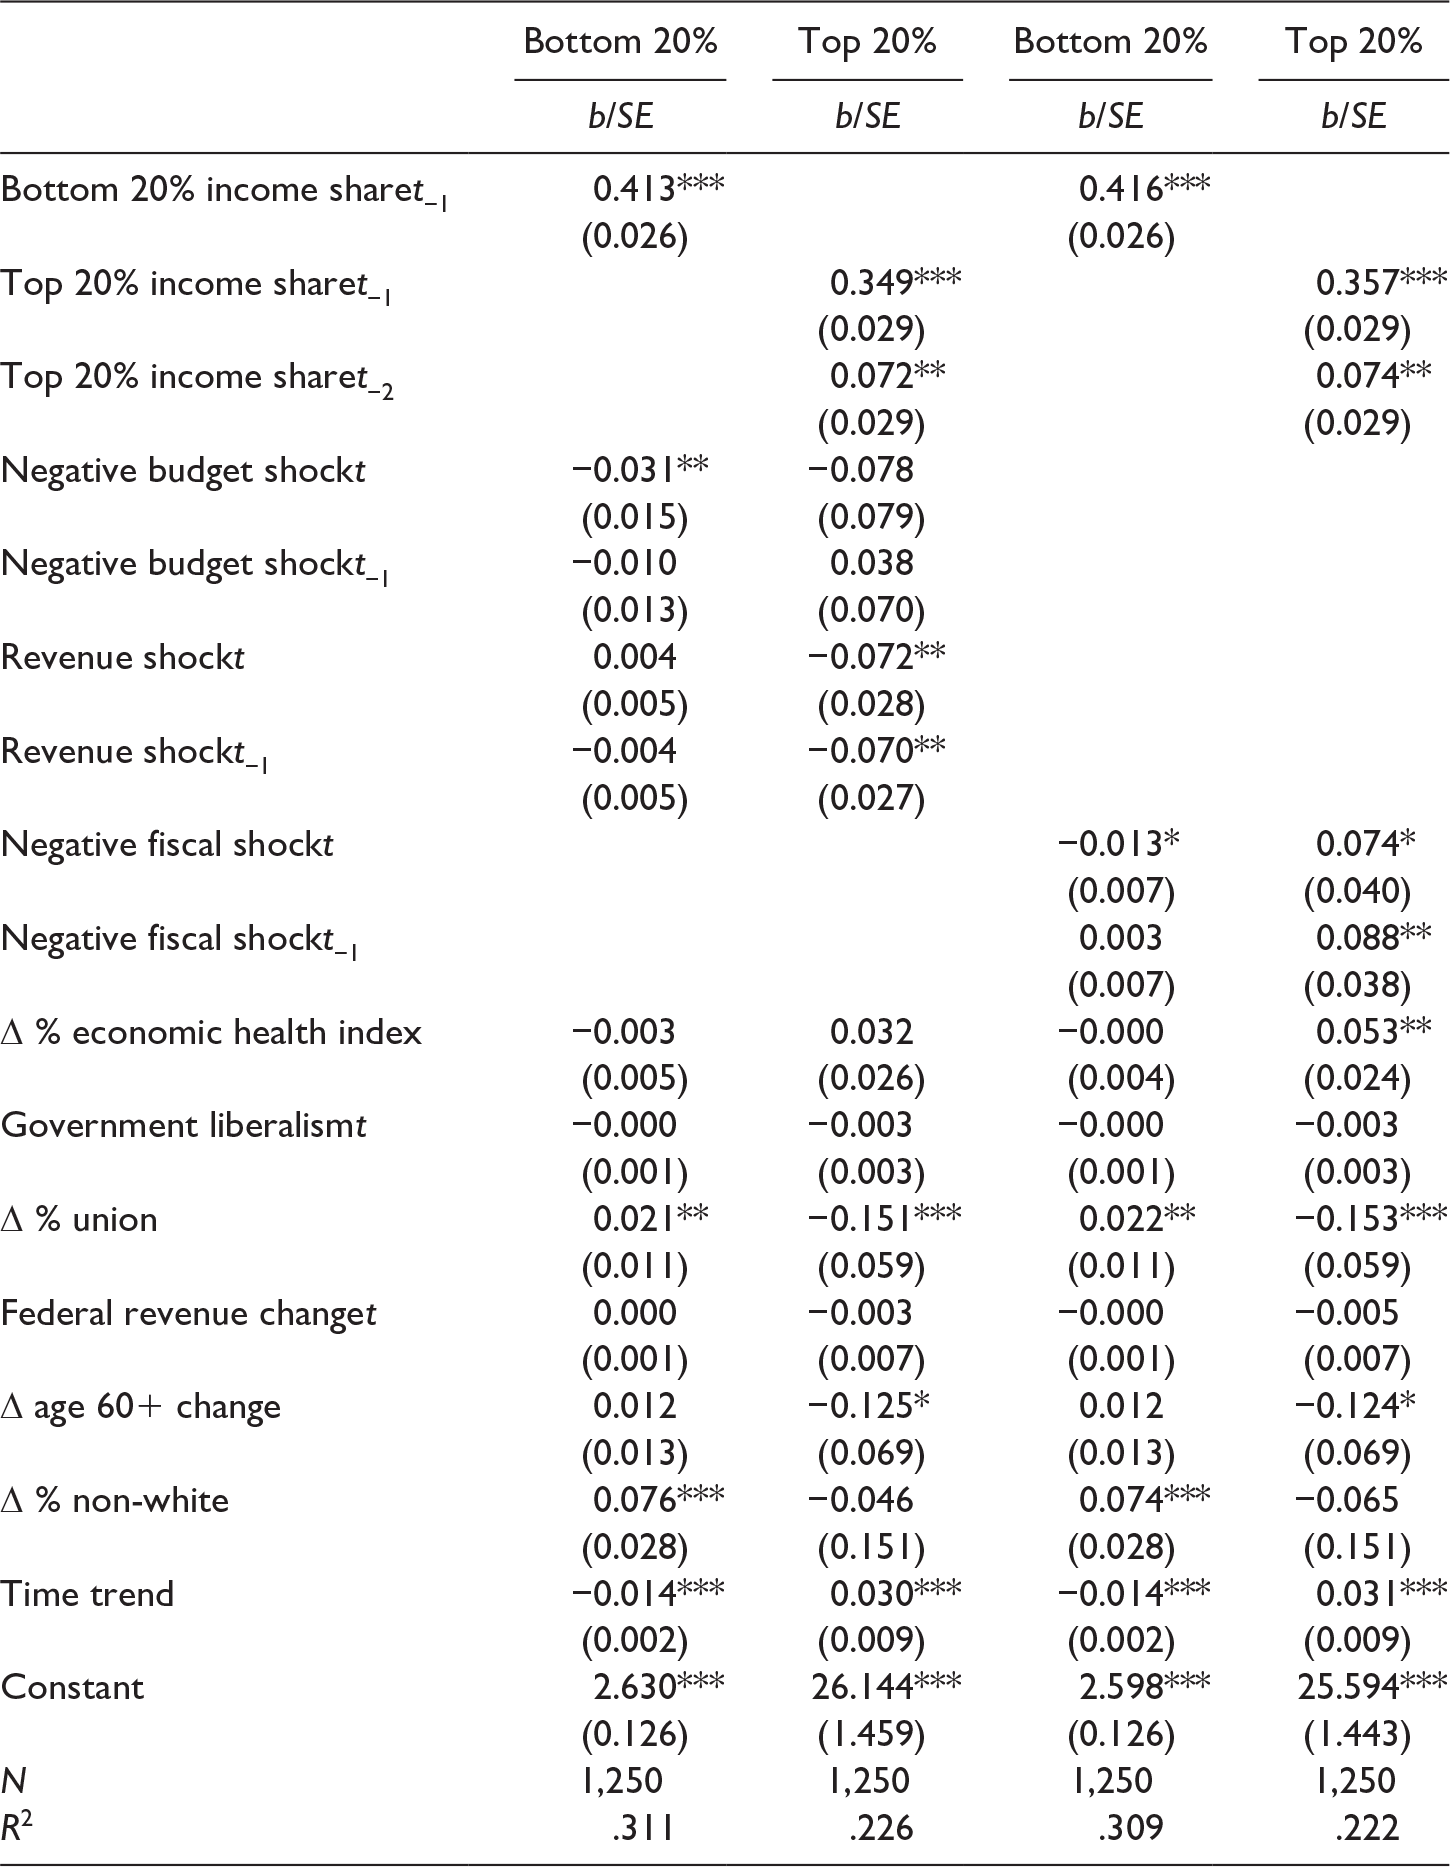
Although the income inequality ratio provides a measure of the relative distance between the rich and the poor, it does not allow for an assessment of which group is doing financially better or worse. To examine the influence of state policy shocks on those at the top and bottom of the income distribution, the analyses presented in models 3 and 4 from Table 1 are replicated after replacing the inequality ratio with income shares of the bottom and top income quintiles. The results, displayed in Table 2, are largely consistent with the findings discussed above. Mainly, negative fiscal shocks reduce the income shares of those in the bottom 20% of the income distribution and, interestingly, increase the income share of the affluent. The separate estimated effects of negative budget shocks and revenue shocks suggest that it is budget cuts (increases) that are most closely associated with lower (higher) income shares for the poor while revenue cuts (increases) are more closely related to higher (lower) income shares for the rich.
The Effect of State Fiscal Shocks on Bottom 20% and Top 20% Income Shares.

Note. Estimates are from autoregressive distributed lag (ADL) models with state fixed effects. All variables were examined to determine levels of integration using Fisher augmented Dickey–Fuller stationarity tests (specifically designed for TSCS data). A first difference (Δ) version of the variable is used when tests indicated that it is a non-stationary series. In all cases when non-stationarity was detected, the first difference version of the series was determined to be stationary. Although tests for the top 20% income share series cannot clearly reject that all panels contain unit roots, all post-estimation tests show no signs of serial correlation in any models. TSCS = time-series cross-sectional.
*p < .10. **p < .05. ***p < .01.
Additional analyses were also conducted that separately model the specific state program areas being cut (rather than overall budget shocks) and the particular sources of tax increases or decreases (rather than overall revenue changes) being made by the states. The specific revenue shock measures include changes to each state’s taxes on personal income, corporate income, sales, tobacco, fuel, and alcohol. Specific budget cut data are available for K-12, higher education, public assistance, Medicaid, corrections, and transportation. It is important to note that although NASBO provides specific revenue changes by tax area since 1987, the organization has only reported area-specific budget cuts since 2010. Therefore, the analysis of separate program area cuts can only gauge the influence of these policy decisions between states (i.e., cross-sectional) and cannot account for over time changes within states.
With these limitations in mind, the results of the tax-specific revenue shocks analysis are presented in Online Appendix Table A4 and the specific program cuts results can be found in Online Appendix Table A5. For both sets of models, the dependent variables include the inequality ratio, the bottom 20% income share, and the top 20% incomes share. The analysis of revenue shocks shows that it is mainly unexpected changes to the personal income tax that shape the income distribution. Increases in the personal income tax are associated with a lower inequality ratio, higher share of income for the bottom 20%, and lower income share for the top 20%.Footnote 23 The central takeaway from the program-specific budget cuts analysis is that inequality is mainly influenced by unexpected cuts to higher education and public assistance. For both programs, negative budget shocks lead to a higher inequality ratio and lower income share for those in the bottom 20%.
Finally, the estimated effects of state policy shocks on inequality are also consistent with those found in Models 3 and 4 from Table 1 when including measures of overall state spending and revenue (i.e., not just fiscal shocks; see Online Appendix Table A7), and when accounting for partisan control of state government (see Online Appendix Table A8).Footnote 24 Altogether, the results presented in this section suggest that how states respond to economic crisis can have a meaningful, long-term influence on economic inequality.
Great Recession Surveys: Data and Measures
The second approach to studying the consequences of state policy responses to economic crisis is to examine one potential individual-level implication of how policy shocks might influence the financial well-being of a state’s residents. The results presented above demonstrate that, in the aggregate, negative fiscal shocks during poor economic times lead to higher levels of state income inequality. The following analysis uses nationally representative survey data to assess whether there is an association between each state’s policy response to economic decline and the subsequent financial situation of the states’ residents following these policy decisions. Returning to a claim made earlier about state responses to economic challenges, the public tends to rely more on government programs when the economy is doing poorly. If states respond to poor economic conditions by reducing spending, the expectation is that those living in these states will be financially worse off relative to those residing in states that rely more on increasing revenues.
The analysis uses four surveys from the Pew Research Center that were conducted in the wake of the Great Recession. For these particular surveys asking about the recession, Pew contacted respondents in 2011, 2012, 2013, and 2015, interviewing approximately 1,500 people in each survey.Footnote 25 The four surveys are pooled for the analysis, which allows for greater precision in the inferences that can be made about the influence of state-level policy on individual-level financial well-being. After combining the surveys and accounting for missing data, a total of 5,080 respondents are included in the analyses.
These particular surveys were selected because they all have two characteristics in common. First, each survey asks the same question about the personal financial consequences experienced by individuals as a result of the recession. The questions asks, “Overall, which of the following best describes how the recession affected your own personal financial situation?” The three potential responses are that the recession (1) did not have a major effect on finances; (2) had a major effect, but finances mostly recovered; or (3) had a major effect, and finances have not recovered. The responses to this question are used as the dependent variable in the analyses below.
The second shared characteristic among the four surveys is that they all provide geographic identifiers that indicate the state of residence for each respondent. This is necessary for the analysis so that measures of state-level policy responses to the recession can be joined with the individual-level survey data. The same measures of unexpected state policy changes used in the time-series analysis are used in the analysis of how the recession affected the financial situation of individuals. That is, the measures of negative budget shocks, revenue shocks, and negative fiscal shocks are used to assess whether a state’s policy responses to the recession are associated with the individual financial well-being of the state’s residents. As the survey data are focused on the Great Recession, averages of each measure from 2008 to 2010 are used to account for state policy actions. This period of time includes the start of the recession up to the year prior to the first Pew survey being conducted in 2011. The economic condition in each state is accounted for by including the state’s average economic health during the 2008–2010 time period (recession economic health index) and the state’s economic health in the year the survey was conducted (economic health in survey year).
At the individual level, several factors are accounted for that are likely to be related to how well people fared financially as a result of the recession. These variables include income, education, party identification, age, gender, and race. The descriptive statistics for all of the measures used in the analysis can be found in Online Appendix Table A10.
Great Recession Surveys: Analysis and Results
As described above, the focus of this analysis assesses the relationship between state-level measures of fiscal policy shocks and survey data on individual-level financial circumstances. To account for the hierarchical nature of the data—that is, individuals nested within states—multilevel regression analysis is used with random intercepts modeled at the state level. As the dependent variable is being used has three categories ranging from the recession having little effect on a respondent’s finances to the recession having a major and lasting effect, multilevel ordered logistic regression is used. A series of dummy variables for each survey year are included in the models to account for any potential heterogeneity across surveys.
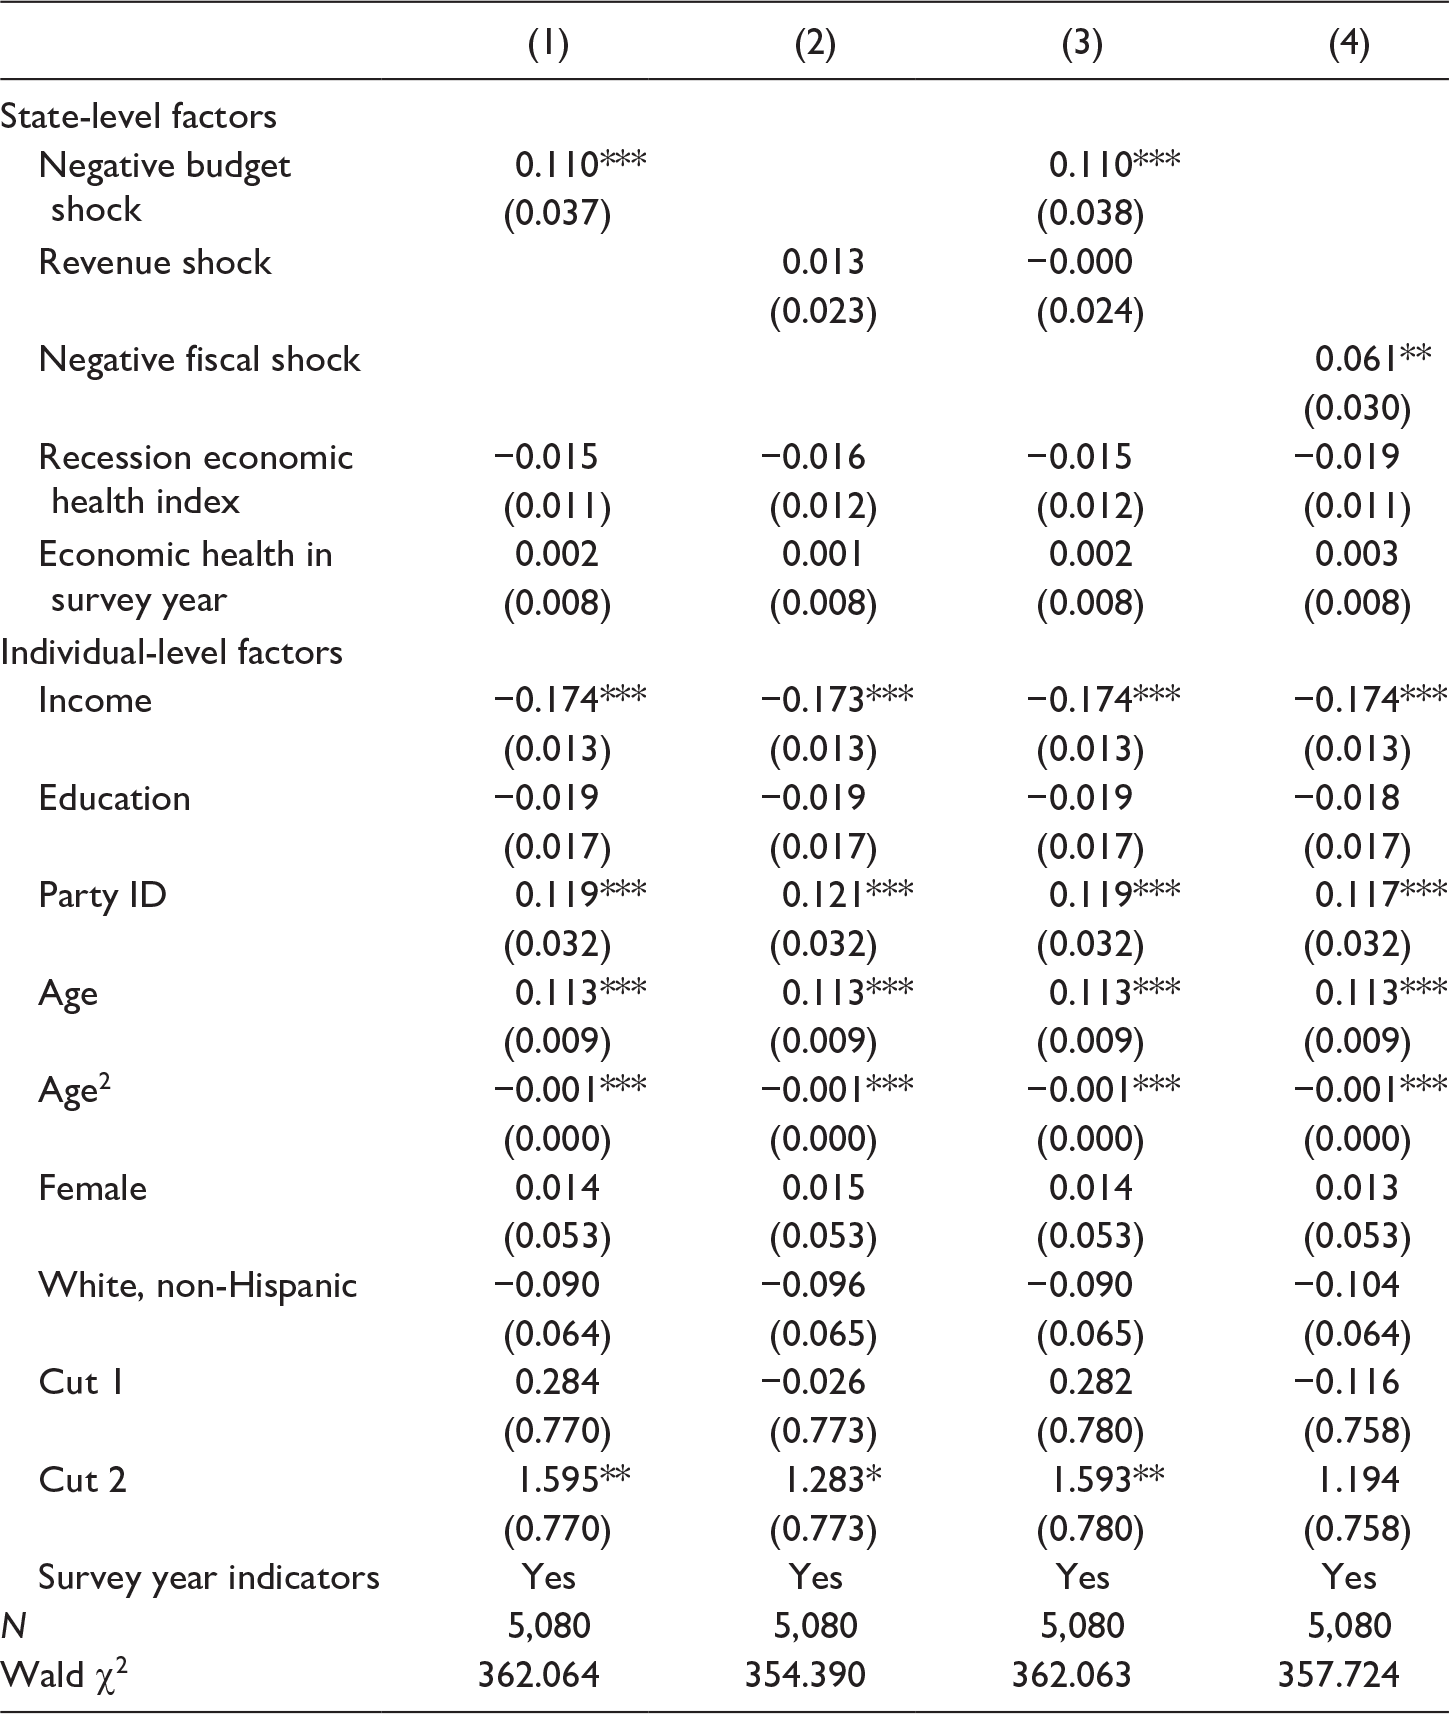
Table 3 presents the results of four models that examine reports of the extent to which the Great Recession affected their financial situation. The models are essentially the same, but do differ in which policy response measures are included. The first model includes the state-level negative budget shock variable; the revenue shock measure is used in the second model; the third model includes both the budget shock and revenue shock variables; and the final model uses the overall measure of negative fiscal shocks.
The Effect of State Fiscal Shocks on Individual Financial Situation.

Note. Estimates are from multilevel ordered logistic regression with random intercepts modeled at the state level. Dummy variables for each survey year are included in all models. State-level covariates are the same measures used in the time-series analysis. Negative budget shock, revenue shock, negative fiscal shock, and the recession economic health index are all averages of the 2008–2010 period. Economic health in survey year is the value of the economic health index in the year the survey was conducted.
*p < .10. **p < .05. ***p < .01.
The findings are largely consistent with the expectation that those living in states that rely on spending cuts during economic downturns will be worse off financially than those in states where a more revenue-based approach is used in response to budget difficulties. The estimated effect of the negative budget shock variable is positive and statistically significant in Models 1 and 3, indicating that when a state makes unexpected spending cuts, its residents are more likely to report having financial trouble as a result of the recession. Although the coefficients on the revenue shock variable are not statistically different from zero in Models 2 or 3, the effect of overall negative fiscal shocks (the measure accounting for both unexpected spending and tax changes) is positive and statistically significant (Model 4). This suggests that when states emphasize budget cuts over increasing their revenues in response to economic decline, those living in these states appear to experience greater financial harm as a result.
Several individual-level characteristics are also related to how the recession affected respondents’ financial situation. Those with higher incomes fared better financially in the aftermath of the recession while non-white respondents were more likely to experience permanent financial difficulties as a result of the economic downturn. The estimated effects for age suggest an inverse-U relationship between age and personal economic circumstances. Interestingly, party identification also influences how respondents view the effect of the recession on their financial situations. On average, Republicans are more likely to report having experienced negative financial outcomes as a result of the Great Recession. Taking into account that Barack Obama, a Democrat, was in the White House when the Pew data were collected, this finding is consistent with previous research demonstrating partisan biases in economic evaluations (e.g., see Bartels Reference Bartels2002; Gerber and Huber Reference Gerber and Huber2010).
Conclusion
As the gap between the rich and the poor has steadily expanded since the 1970s, scholars have become increasingly interested in explaining the factors that are driving this trend. While economists have mostly emphasized the role of technological change and globalization in shaping income inequality, there is now a growing line of research demonstrating that a variety of political forces can affect the distribution of income (Bartels Reference Bartels2008; Hacker and Pierson Reference Hacker and Pierson2010; Kelly Reference Kelly2009). More recently, several studies have shown that politics in the American states can determine who benefits most from the U.S. economic system (Franko and Witko Reference Franko and Witko2017; Hayes and Vidal Reference Hayes and Vidal2015). The growing role of the states in influencing economic outcomes is at least partially due to political developments that have been evolving for a number of years. As conservative groups and business interests have become more organized, a push for less government regulation and lower taxes has been successful for the most part. Not only have these changes largely benefited the wealthy, but they have also allowed the states to be more instrumental policy makers. In light of these developments, it is natural to expect state decision making to play a role in influencing inequality.
This study argues that one way the states are important when it comes to economic outcomes is through their ability to support public programs that are essential to many people with fewer resources, and that this state support is particularly consequential during periods of economic crisis. Very few scholars have studied the possibility that effect of policy decisions on income inequality may be magnified when these decisions are made in response to poor economic conditions. Of course, nearly everyone struggles financially to some extent when the economy is in decline, but those at the bottom of the income ladder are especially vulnerable. Research has demonstrated that this vulnerability, or economic insecurity, has grown over time and has become even worse for those with lower incomes (D’Ambrosio and Rohde Reference D’Ambrosio and Rohde2014; Hacker Reference Hacker2006). This suggests that government-funded social programs can provide the additional financial security and stability that these groups are in need of, and may prevent what would otherwise mean substantial economic loss. From this perspective, the policy decisions made by the states in reaction to a faltering economy may be even more impactful on the income distribution than under typical circumstances.
This possibility is tested by examining state-level income inequality and fiscal shock data over a 25-year period. Several time-series analyses demonstrate that state policy responses to economic decline can have both short- and long-term effects on the distribution of income. Unexpected budget cuts during economic downturns lead to higher levels of inequality while increasing state revenues has the opposite effect. Considering both spending and revenue decisions made when the economy is weak, the results show that income differences grow larger when states rely on budget cuts over increasing revenues in the years following these policy decisions. In addition, this evidence is bolstered by examining a micro-level implication of the argument that state policy responses to economic crisis can influence the income distribution. Using several post–Great Recession surveys to assess the effect of the economic crisis on individual-level finances, the findings indicate that respondents were more likely to experience permanent financial harm as a result of the recession when they lived in states that prioritized budget cuts over generating new revenue.
These findings suggest that how the states respond to economic crisis can have a lasting effect on inequality and the general well-being of the public. Although these policy decisions are not easy ones to make, particularly when most states have balanced budget requirements, the states have the tools to sustain or even increase spending when their residents are in greatest need of the programs they provide. One implication of the findings is that for decision makers who are concerned about the economically disadvantaged, addressing budget shortfalls by raising taxes and avoiding budget cuts may allow states to better support their residents and potentially restrain the growing gap between the rich and the poor. This research contributes to the existing literature by demonstrating the ability of state governments to shape income inequality and by showing that state decision making is particularly crucial when economic vulnerability is at its highest.
Declaration of Conflicting Interests
The author(s) declared no potential conflicts of interest with respect to the research, authorship, and/or publication of this article.
Funding
The author(s) received no financial support for the research, authorship, and/or publication of this article.
ORCID iD
William W. Franko https://orcid.org/0000-0002-2662-7827
Supplemental Material
Supplemental material for this article is available online.
Author Biography
William W. Franko is associate professor of political science at West Virginia University. His research focuses on the causes and consequences of political and economic inequality in the United States.