1. INTRODUCTION
Ruby (Al2O3:Cr3+) has a wide range of applications in the field of optics and photonics, ranging from the first solid state laser to photonic temperature, stress and acoustic sensor (Maiman et al., Reference Maiman1960; Powell et al., Reference Powell1998; Nelson et al., Reference Nelson and Sturge1965; Cronemeyer et al., Reference Cronemeyer1966; Ragan et al., Reference Ragan, Gustavsen and Schiferl1992; Duan et al., Reference Duan, Paiva, Wentzcovitch and Fazzio1997; Aizawa et al., Reference Aizawa, Ohishi, Ogawa, Katsumata and Komuro2002; Gibson et al., Reference Gibson and Chernuschenko1999). Recently, optical delay of light has also been demonstrated in ruby crystal and hence it can find application in quantum optics (Bigelow et al., Reference Bigelow, Lepeshkin and Boyd2003; Gao et al., Reference Gao, Xu, Zhang, Bo and Liu2008). In order to harness these properties of ruby in form of miniaturized device, the deposition of ruby thin film is reported by few researchers using solid phase epitaxy, electron beam deposition, and pulsed laser deposition (PLD) (Yu et al., Reference Yu, Wen, Clarke, Mclntyre, Kung, Nastasi, Simpson, Mitchell and Li1995; Wen et al., Reference Wen, Clarke, Yu and Nastasi1995; Aizawa et al., Reference Aizawa, Shibasaki, Komuro, Miyazaki and Katsumata2009; Kumari et al., Reference Kumari and Khare2013). Among various techniques, PLD was found to be the most promising technique for deposition of epitaxial ruby thin film (Kumari et al., Reference Kumari and Khare2013; Reference Kumari and Khare2011). Moreover, PLD technique is found to be successful for deposition of high quality thin films of ceramic, heavy metals, and alloys (Sankur et al., Reference Sankur1986; Lorusso et al., Reference Lorusso, Fasano, Perrone and Lovchinov2011; Cracium et al., Reference Cracium, Amirhaghi, Cracium, Elders, Gardeniers and Boyd1995; Mostako et al., Reference Mostako and Khare2012; Shukla et al., Reference Shukla and Khare2010). Also pulsed laser ablation is promising for nanoparticle synthesis (Wang et al., Reference Wang, Chen, Ding, Chu, Deng, Liang, Chen and FU2011), heavy ion generation and acceleration (Wolowski et al., Reference Wolowski, Badziak, Czarnecka, Parys, Pisarek, Rosinski and Yerci2007), and laser ablation lithography (Kamlesh et al., Reference Kamlesh and Khare2005; Reference Kamlesh and Khare2006). PLD is a versatile thin film deposition technique and it allows the control of thin film quality by varying various experimental parameters during deposition viz. laser fluence, gas pressure, etc. The quality of thin films deposited through PLD technique is governed by the properties of laser produced plasma. With the aim to investigate the properties of laser produced plasma as a function of laser fluence and gas pressure, a detailed study of the dynamics of the plasma species produced by laser ablation of ruby in oxygen environment during PLD is undertaken. The laser produced plasma parameters are investigated by recording ion and electron time of flight (TOF) signals using planar Langmuir probe. Further, an attempt is made to correlate the properties of the ruby thin films deposited by PLD to that of the laser induced plasma parameters.
2. EXPERIMENTAL SETUP
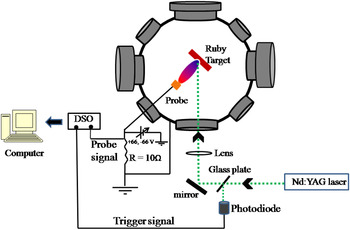
The experimental setup used for Langmuir probe study is shown in Figure 1. To produce the ruby plasma, second harmonic of a high power Nd:YAG Quanta Ray (model no: INDI-HG) (λ = 532 nm) laser was focused on to the ruby pellet using a plano convex lens of focal length 35 cm, placed inside a vacuum chamber. The Langmuir probe used in the experiment was in the form of a flat copper plate having dimension 4 mm × 4 mm, placed at a distance of 4 cm away from ruby target. The current-voltage I-V characteristics of Langmuir probe was recorded as a function of laser fluence and background gas pressure. To attend the I-V characteristics, the Langmuir probe biasing voltage was varied from +66 volt to −66 volt using the dual direct current regulated power supply (Testronix 93C). The electron and ion TOF signals were obtained by displaying the voltage drop across a 10 Ω ceramic resistor, connected toward the grounding end as shown in Figure 1, on a digital storage oscilloscope (DSO; Tektronix, DPO-3034) interfaced with a computer. The DSO was triggered with respect to the Nd:YAG laser pulse using a fast photodiode as shown in Figure 1. The signal pulses were averaged over 64 pulses. In order to deposit the thin films of ruby under the similar experimental conditions, the probe was replaced with the substrate holder assembly mounted at the same location. The PLD ruby thin film was deposited on quartz substrate, at a substrate temperature of 750°C for 1 hr. The ruby thin films were deposited at six different laser fluences ~6.2 J/cm2, ~16 J/cm2, ~23 J/cm2, ~27 J/cm2, and ~30 J/cm2. In order to study the effect of oxygen gas pressure, the ruby thin films were deposited at five different gas pressure; ~0.05 mbar, ~0.1 mbar, ~1 mbar, ~5 mbar and ~10 mbar at a laser fluence of ~23 J/cm2 for 1 hr.
(Color online) Schematic of experimental setup.

3. RESULTS AND DISCUSSION
3.1. Effect of Laser Fluence on Plasma Parameters
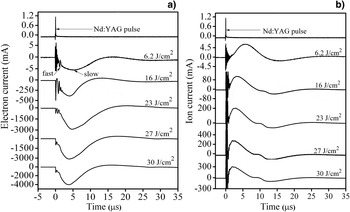
The electron and ion TOF signal as a function of laser fluence at a bias voltage of ±60 volts is shown in Figure 2. It can be observed from the electron and ion TOF signal that the signal initially shows oscillatory behavior during the beginning of nanosecond Nd:YAG pulse. The oscillatory behavior observed in the initial part of electron and ion signals are associated with the ion plasma frequency and electron-ion collision frequency. These oscillations are induced by thermal fluctuations that appear in the plasma cooling process. These oscillations are explained in detail using a hydrodynamic model in a non-differentiable space-time (Nica et al., Reference Nica, Agop, Gurlui and Focsa2010). The variation in oscillatory behavior with increase in laser fluence is due to increase in plasma density at higher laser fluences (Gurlui et al., Reference Gurlui, Agop, Nica, Ziskind and Focsa2008). After the termination of pulse a fast peak of duration ~0.5 µs is observed followed by a broad slow peak of duration ~5 µs. The fast peak is the fast component of plasma originated due to photoelectrons accelerated via inverse bremsstrahlung processes. On the other hand, the broad peak (slow peak) in TOF curve actually corresponds to the arrival time of optimum ions/electrons flux to the probe. The electron/ion signals were found to increase on increasing the laser fluence from ~6.2 J/cm2 to ~30 J/cm2. The peak of the signal corresponding to the arrival time of species and was found to decrease from 5.3 µs to 3.7 µs in case of electron estimated using Figure 2a. In case of ion signal, the arrival time has been decreased from 5.7 µs to 2.2 µs, calculated from TOF signal of Figure 2b. Thus, the plasma species are reaching the probe surface in shorter time duration when increasing the laser fluence, due to conversion of thermal energy into kinetic energy. The electron current is observed to be larger than that of ion current at every laser fluence as observed from Figure 2a. The electron and ion velocities have been estimated using Eq. (1), and are shown in Figure 3.
 $$v_{i}=d/t\comma \;$$
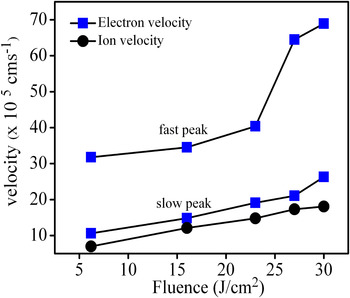
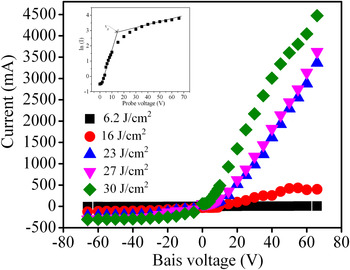
where v i is the velocity of ion, d is the distance from target to probe, and t is the time taken by maximum number of ion to reach the probe surface. The electron velocity was found to increase from 31 × 105 cms−1 to 68 ×105 cms−1 in case of fast peak, on increasing the fluence from ~6.2 J/cm2 to ~30 J/cm2. In case of slow peak, similar behavior was observed. The electron velocity was found to vary from 10.0 × 10⁵ cms−1 to 26 × 105 cms−1. The ion velocity was also found to increase with increase in laser fluence. The ion velocity was found to increase from 7.0 × 10⁵ cms−1 to 18 × 105 cms−1 on increasing the laser fluence from ~6.2 J/cm2 to ~30 J/cm2. The increase in electron/ion velocity with fluence is due to conversion of thermal energy into kinetic energy. The increase in velocities of both electrons as well as ions was slow up to ~23 J/cm2 but beyond that it has increased drastically. The I-V characteristics of Langmuir probe at various laser fluence are shown in Figure 4. The electron and ion current is clearly shown to increase with increase in laser fluence. The inset of Figure 4 shows a semi-logarithmic plot of the I-V curve for the laser fluence of ~30 J/cm2. The data points for bias voltage of 0 to 10 volts, taken at a step of 1 volt is linear fitted.
(a) Electron TOF signals as a function of laser fluence (b) corresponding ion TOF signals.

(Color online) Electron and ion velocities at various fluences.

(Color online) I-V characteristics at various laser fluences.

The slope of the curve ln (I p) vs. V, given by
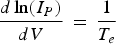 $$\displaystyle{{d\ln \lpar {I_P}\rpar } \over {dV}}\, = \, \displaystyle{1 \over {{T_e}}}$$
gives the value of electron temperature in eV. The ion density was calculated by
 $$I_{i}=Aenv_{i}$$
where I i is the saturation current for ion, A is the area of probe, and v i is the velocity of ion.
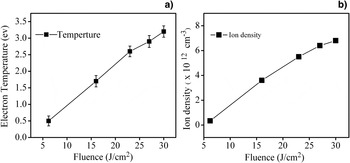
The electron temperature and ion density as a function of laser fluence is shown in Figure 5. The electron temperature was found to increase from 0.5 eV to 3.2 eV on increasing the laser fluence as shown in Figure 5a. The error in the estimation of electron temperature was in the range 0.15 eV to 0.18 eV as shown in the Figure 5a. The ion density was also found to increase from 3.6 × 1012 cm−3 to 6.8 × 1012 cm−3 with increase in fluence from ~6.2 J/cm2 to ~30 J/cm2. The plasma temperature and density was found to increase rapidly up to a laser fluence of ~23 J/cm2. Beyond ~23 J/cm2, the plasma temperature and density shows steady increase and almost close to saturation. This could be due to formation of self-regulating regime near the target surface at high laser fluence (Harilal et al., Reference Harilal, Bindhu, Issac, Nampoori and Vallabhan1997). If the absorption of the laser photons by the plasma becomes higher due to high plasma density, the evaporation of the species from the target becomes less, which in turn decreases density of the charged species. This consequently increases the absorption of the laser photons by the target, thus increasing the temperature of the plasma.
Variation of (a) plasma temperature and (b) ion density as a function of laser fluence.

3.2. Effect of Gas Pressure Variation
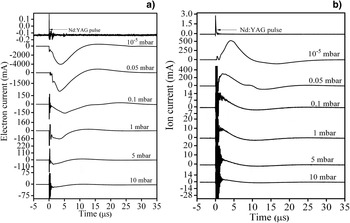
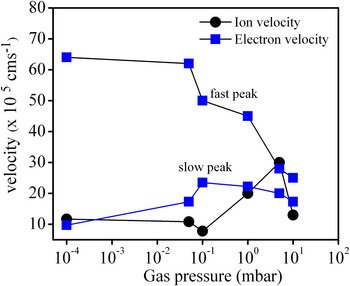
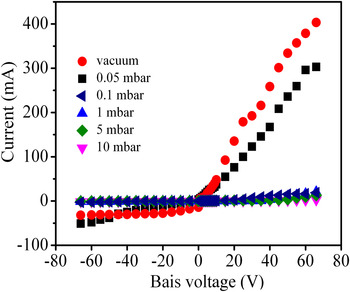
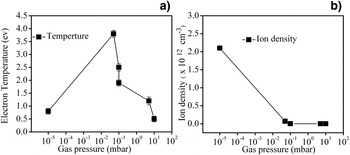
The gas pressure was varied from ~10−5 mbar to ~10 mbar. Figure 6 shows the electron and ion TOF signals, respectively, as a function of background gas pressure. With increase in gas pressure the electron current has been drastically reduced. The ion TOF signal also shows similar kind of behavior as shown in Figure 6b. The ion collection by the probe was very large in vacuum but with increase in gas pressure it has reduced drastically. The reduction in electron/ion current with increase in background gas pressure could be due to loss of charged species on collision with gas molecules. Moreover, the collision rate will further increase due to confinement of plasma with increase in gas pressure. This will further lead to reduction in electron/ion current. The electron and ion velocities estimated from the electron and ion TOF signals of Figure 6 using Eq. (1), is shown in Figure 7. The electron velocity for fast peak was found to decrease from 64 × 105 cms−1 to 25 × 105 cms−1 with increase in pressure from 10−5 mbar to 10 mbar. In case of slow peak, it is nearly constant up to 10−1 mbar of oxygen pressure and then it increased from 11.7 × 10⁵ cms−1 to 30.3 × 10⁵ cms−1 up to ~5 mbar, and then reduced to 13.2 × 10⁵ cms−1 at ~10 mbar. The ion velocity was increased from 9.7 × 10⁵ cms−1 to 22.2 × 10⁵ cms−1, with increase in oxygen pressure from ~10−5 mbar to ~10−1 mbar, and then decreased to 17.3 × 10⁵ cms−1 on further increasing the pressure to 10 mbar. The I − V characteristics as a function of gas pressure are shown in Figure 8. The electron temperature and ion density as a function of oxygen gas pressure is estimated using Eqs. (2) and (3), respectively, and is shown in Figure 9. The electron temperature initially increases from 0.8 eV to 3.8 eV, on increasing the pressure from ~10−5 mbar to ~0.05 mbar. On further increasing the pressure from 0.1 mbar to 10 mbar the electron temperature was found to reduce from 2.5 eV to 0.5 eV as shown in Figure 9a. The error in the estimation of electron temperature is in the range of 0.11 to 0.15 eV. The ion density has been found to reduce from 2.1 × 1012 cm−3 to 6.2 × 1010 cm−3, on increasing the gas pressure from 10−5 mbar to 10 mbar. The observed behavior in electron temperature and ion density as a function of gas pressure can be explained on the basis of plasma confinement. As the pressure increases, the confinement of the plasma takes place near the target surface (Harilal et al., Reference Harilal, Bindhu, Nampoori and Vallabhan1998) this results in the increase in the electron collision rate with the background gas atoms. Energy loss due to elastic collision supersedes the rate of growth of energy of free electrons via inverse bremsstrahlung processes. Thus the temperature & ion density reduces with increase in background gas pressure.
(a) Electron TOF signals as a function of gas pressure (b) corresponding ion TOF signals.

(Color online) Electron and ion velocities as a function of gas pressure.

(Color online) I-V characteristics as a function of gas pressure.

Variation of (a) plasma temperature and (b) ion density as a function of gas pressure.

3.3. PLD of Ruby Thin Film and Correlation with Plasma Parameters
3.3.1. Effect of Laser Fluence
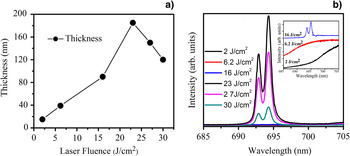
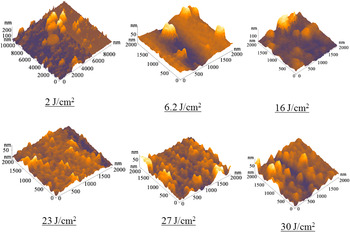
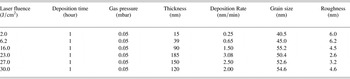
To monitor the effect of laser fluence onto the quality of PLD deposited ruby thin films the films were deposited at six laser fluences; ~2 J/cm2, ~6.2 J/cm2, ~16 J/cm2, ~23 J/cm2, and ~30 J/cm2. The thickness of the film was found to increase from 15 nm to 185 nm on increasing the laser fluence from ~2 J/cm2 to ~23 J/cm2 as shown in Figure 10a. On further increasing the laser fluence to ~27 J/cm2 and ~30 J/cm2 the thicknesses drops down to 150 nm and 120 nm, respectively. The photo-luminescence (PL) intensity of films also scales with the increase in laser fluences as shown in Figure 10b. At low laser energy ~2 J/cm2 and ~6.2 J/cm2 the PL spectra does not show any signature of ruby phase in the deposited film as shown in inset of Figure 10b. On increasing the laser fluence to ~16 J/cm2, distinct R 1 and R 2 lines at 692.8 nm and 694.2 nm is observed in the PL spectra, confirming the ruby phase in the film. On increasing the laser energy to ~23 J/cm2, drastic enhancement in PL intensity is observed. The atomic force microscopy (AFM) images of PLD ruby thin films are shown in Figure 11. The surface roughness and average grain size estimated using the micrographs of Figure 11 are listed in Table 1. It shows decrease in surface roughness from 6.0 nm to 3.0 nm on increasing the laser fluence from ~2 J/cm2 to ~23 J/cm2. The surface roughness is increased to 4.6 nm at a fluence of ~30 J/cm2. The grain size has been increased from 40.5 nm to 54.6 nm with increase in laser fluence. At higher laser fluence more particles are ejected from the target surface. Thus, the kinetic energy as well as amount of target species arriving onto the substrate surface increases with increases in laser fluence. On arriving the surface of the substrate these particles accumulates to form a larger grain in order to minimize their surface energy (Lorusso et al., Reference Lorusso, Fasano, Perrone and Lovchinov2011). Thus, higher laser fluence gives rise to a thicker film as shown in Figure 10a. At high laser fluence the kinetic energy of ablated material is high which results in good adhesion of the film onto the substrate as well as the formation of crystalline structure. The improved crystalline structure of the film promotes the better surface-atom mobility (Cracium et al., Reference Cracium, Amirhaghi, Cracium, Elders, Gardeniers and Boyd1995). Thus, the PL signal is improved at higher laser fluences as observed from Figure 10b. As the laser fluence was further increased to ~27 J/cm2 and ~30 J/cm2 the PL intensity was found to decrease. This could be due to sputtering from the film surface on impingement of highly energetic particle on substrate surface. The increase in surface roughness at these laser fluences further suggest that there could be sputtering from film surface.
(Color online) (a) Thickness and (b) photoluminescence of PLD deposited ruby thin film as a function of laser fluence.

(Color online) AFM images of PLD ruby thin film as a function of laser fluences.

List of PLD ruby thin films deposited at various laser fluences

Thus, the optimum laser fluence for deposition of ruby thin film is ~23 J/cm2. Above this laser fluence the ion and electron velocity has drastically increased, as observed from Figure 3. Due to rapid increase in the velocity of plasma species, sputtering from the film surface takes place on impingement of these highly energetic particles. Thus, the quality of film has been deteriorated as reflected from increase in the surface roughness and decrease in PL intensity of ruby thin films deposited at laser fluence of ~27 J/cm2 and ~30 J/cm2.
3.3.2. Effect of Gas Pressure
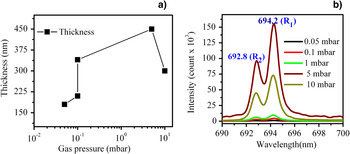
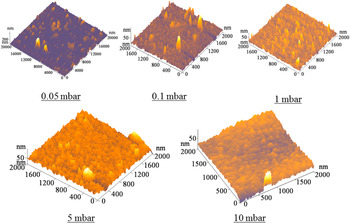
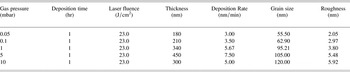
To attain the optimum oxygen pressure for deposition of PLD ruby thin films, the films were deposited at five different oxygen gas pressures ~0.05 mbar, ~0.1 mbar, ~1 mbar, ~5 mbar, and ~10 mbar. Figure 12a shows the thickness of PLD ruby thin film as a function of background gas pressure. The thickness of the film was found to increase from 180 nm to 450 nm on increasing the gas pressure from ~0.05 mbar to ~5 mbar, on further increasing the gas pressure to 10 mbar the thickness was found to decrease to a value of 300 nm. The PL spectra as shown in Figure 12b, shows increase in PL intensity up to ~5 mbar and then drastically fall at 10 mbar. Figure 13 shows the AFM micrographs of ruby thin film grown under various oxygen pressures and the estimated surface roughness and average grain size are listed in Table 2. With increase in oxygen pressure from 0.05 mbar to 10 mbar, the surface roughness was found to increase from 2.0 nm to 5.9 nm. Whereas, the grain size was found to increase from 55.5 nm to 120 nm, with increase in gas pressure from ~0.05 mbar to ~10 mbar. Initially, with the increase in gas pressure from ~0.05 mbar to ~5 mbar, expansion of plasma plume is confined. The losses of plasma species due to scattering is reduced and density increases and hence the thickness of the film increases as observed from Figure 12a. The increase in PL intensity is also in accordance with the thickness result. With further increase in pressure to ~10 mbar the plasma is confined in a very small region as well as due to increase in collisions forward movement of the plasma towards the substrate is curtailed leading to the decrease in deposition rate (Wang et al., Reference Wang, Cheng, Wang, Lu, Zhou, Chen and Yang2005). Thus, the thickness as well as PL intensity has been reduced as observed from Figure 12. Thus, the optimum gas pressure could be ~5 mbar for deposition of ruby thin film.
(Color online) (a) Thickness and (b) photoluminescence of PLD deposited ruby thin film as a function of gas pressure.

(Color online) AFM images of PLD ruby thin film as a function of gas pressure.

List of PLD ruby thin films deposited at various gas pressures

4. CONCLUSION
In this paper, Langmuir probe investigation of ruby plasma during pulsed laser deposition of ruby thin film in oxygen ambient is reported. The dependence of electron temperature and ion density as a function of laser fluence and oxygen pressure was studied. Structural and optical characterization of ruby thin films revealed that with increase in laser fluence the quality of film was improved. But at very high laser fluence the quality of film is degraded due to very high kinetic energy of ablated species supporting the Langmuir probe studies. The optimum laser fluence was found to be ~23 J/cm2. Increasing the gas pressure resulted in increase in film thickness due to plasma confinement as evident from plasma studies. At very high gas pressure over confinement of plasma curtailed the forward motion of species resulting in lower deposition rate. Oxygen pressure ~5 mbar was found to be optimum gas pressure for PLD deposition of ruby thin film.
ACKNOWLEDGEMENT
This work was supported in part by Department of science and technology Govt. of India Grant no. SR/S2/HEP-0019/2008.