I. INTRODUCTION
A steel plate with Goss texture (011)<001> (G-texture) is easy magnetized and has low magnetic loss when introduced in a magnetic field collinear with rolling direction.Reference Gheorghies and Doniga1 The G-texture may form from the deformed metal surface during subsequent annealing (i.e., recrystallization), depending on the presence or absence of surface energy advantage and the easiness of atom movement.Reference Heo2 The occurrence and development of G-texture influence the magnetic properties of the silicon steel strip. It is of significant importance to explore the evolution of G-texture for both theoretical and practical aspects.
Electropulsing treatment (EPT) has been found to be an effective process for improving the microstructures and the plastic behaviors of alloys.Reference Okazaki, Kagawa and Conrad3–Reference Zhu, To, Lee, Liu, Jiang and Tang7 In previous studies, it was found electropulsing tremendously enhanced recrystallization of the alloys.Reference Zhu, To, Lee, Liu, Jiang and Tang8, Reference Hu, Tang, Zhu, Shek and Xu9 However, our understanding of the detailed atomic mechanism pertaining to the effects of electropulsing on recrystallization and the properties of the alloys are still very rudimentary. The present study deals with electropulsing-induced G-texture evolution in the deformed silicon steel.
II. EXPERIMENTAL PROCEDURES
An Fe–Si alloy with a composition of Al (0.024 wt%), N (0.026 wt%), Cu (0.10 wt%), Si (3 wt%), and Fe in balance was chosen for the present study. The as-deformed Fe–Si alloy strip with width of 6 mm and thickness of 0.3 mm was obtained after 75% reduction of cold rolling. A custom-made electropulsing generator was used to supply the multipulses onto the Fe–Si alloy strip. An infrared thermoscope was applied for testing the surface temperature of the alloy strip. The parameters of EPT are listed in Table I. The texture (transfer direction, rolling direction) of the cold-rolled specimens was measured by x-ray diffraction (XRD) technique with Mo radiation using Siemens D-500 x-ray diffractometer at different layers (surface layer, subsurface layer in a depth of 0.08 mm from the surface, and the central layer of 0.15 mm in depth from surface). For electron backscattered diffraction (EBSD) measurement, longitudinal cross sections of the EPT specimens were well polished and examined by using scanning microscopy in the EBSD.
Operation parameters of the electropulsing on the Fe–3%Si strip.

jm is the amplitude of current density of electropulsing.
EPT, electropulsing treatment.
III. RESULTS AND DISCUSSION
A. Texture evolution during recrystallization
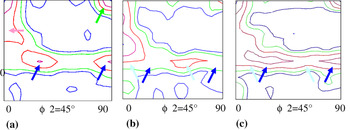
Three sections with ϕ2 = 45° of the orientation distribution function (ODF) were measured by using XRD at three different layers in the cold-rolled specimen, as shown in Fig. 1. It can be seen that the textures were different through the thickness, and the recrystallization took place inhomogeneously. The major texture components were the α-fibred (001)<110>, (112)<110>, γ (111)<110>, and (111)<112>. Two textures, the α (100)<110> and the γ (111)<110> were developed at the surface, as indicated by arrows of green and dark blue in color in Fig. 1(a), while the γ textures with orientations, (111)<110> (light blue in color) and (111)<112> (dark blue in color) were at the two lower layers, as shown in Figs. 1(b) and 1(c), respectively. So, in the as-received state, the major textures were the α (100)<110>, (112)<110>, γ (111)<110>, and (111)<112>.
Orientation distribution function (ODF) figures of as cold-rolled specimen examined by x-ray diffraction: (a) ODF figure for the surface; (b) ODF figure in depth 0.08 mm from the surface; (c) ODF figure in depth 0.15 mm from the surface.

B. Texture evolution under electropulsing
It was supposed that electropulsing accelerated dislocation movement. A large number of dislocations piled up and blocked at the grain boundaries and the structural defects, such as dislocations, vacancies, precipitates, etc., where a great deal of strain energy accumulated.Reference Okazaki, Kagawa and Conrad3, Reference Zhu, To, Lee, Liu, Jiang and Tang7 As well recognized, low-angle grain boundaries (2–10°) were favorable in accommodating dislocations and vacancies, with energy storage. At the grain boundaries, accumulation and annihilation of dislocation occurred at the same time. The energy storage at the grain boundaries and the defects varied in accordance with the dislocation movement mechanism.
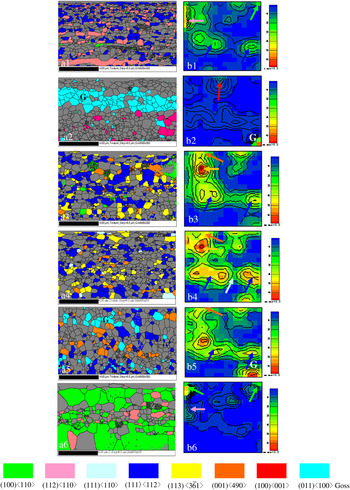
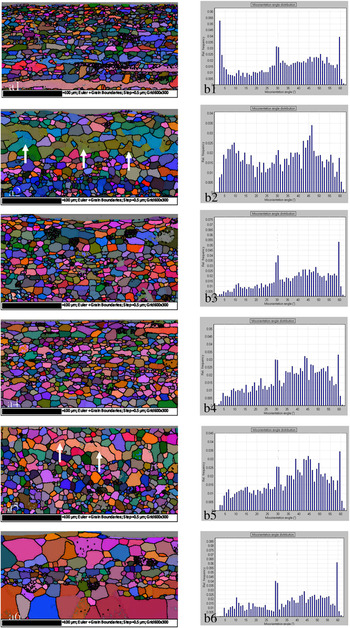
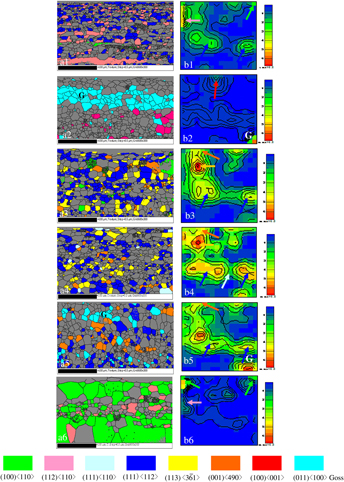
The texture evolution during recrystallization under electropulsing with a high frequency of 30,000 Hz was studied by EBSD. Shown in Figs. 2(a) and 2(b) are the EBSD mapping and ODF by EBSD of the EPT specimens with various durations of electropulsing, respectively. After 3000 Hz EPT at 7.2 V/520 °C for 3 s, the textures consisted mainly of α (112) <110> texture (pink in color) and γ (111) <112> (dark blue in color) together with a small amount of α (100) <110> (green in color), as shown in Fig. 2(a1). The electropulsing started to induce local strain concentration through accumulation of dislocations and the vacancies. The texture was similar to that of the as cold-rolled specimen. The ϕ2 = 45° section of ODF by EBSD is shown in Fig. 2(b1). The textures (112)<110>, γ (111)<112>, and α (100)<110> are indicated by arrows of pink, dark blue, and green in color, respectively. Shown in Figs. 3(a1) and 3(b1) are the Euler mapping and distribution of micro-orientation angles of specimens after EPT at 520 °C, respectively. The (112)<110> texture occurred in the residual shear bands of the deformed alloy strip with strong distributions of the grain boundary angles less than 2°, as shown in Figs. 3(a1) and 3(b1), respectively.
Euler mapping (a) and distribution of micro-orientation angles (b) of specimens after electropulsing treatment (EPT) at (1) 520 °C, (2) 680 °C, (3) 750 °C, (4) 850 °C, (5) 1000 °C, and (6) 1050 °C.

Euler mapping (a) and distribution of micro-orientation angles (b) of specimens after EPT at (1) 520 °C, (2) 680 °C, (3) 750 °C, (4) 850 °C, (5) 1000 °C, and (6) 1050 °C.

During 4 s of 30,000 Hz EPT at 7.2 V/680 °C, the low-angle distribution (2–10°) increased significantly. The low-angle grain boundaries favored accumulation of dislocations. The density of the dislocation increased considerably in EPT specimen. This facilitated the formation of the high energy stored textures. Both G-texture (011)<100> (blue in color) of a volume fraction of Fe[26.1%] and a cubic texture (100)<001> (red in color) were observed, as shown in Fig. 2(a2). The related ϕ2 = 45° section of ODF by EBSD is shown in Fig. 2(b2), where the G-texture (110)<100> and the cubic texture (100)<001> are indicated by arrows “G” and a red arrow, respectively. The Euler mapping and distribution of micro-orientation angles are shown in Figs. 3(a2) and 3(b2). It can be seen that the low-angle boundaries were mostly located in the grains of G-texture, as indicated by white arrows in Fig. 3(a2). This confirms that the G-texture was of high energy storage.
During 5 s of 30,000 Hz EPT at 7.2 V/750 °C, the low-angle distribution, i.e., dislocation density, decreased considerably as shown in Fig. 3(b3).
A new balance between the accumulation and the annihilation of the dislocations was established at the grain boundaries and the structural distorted sites. Accordingly, the energy storage decreased greatly. Those textures with high storage energies: the G-texture (110)<100> and the cubic texture (100)<001> vanished, while the textures: γ (111)<112> of a volume fraction of Fe[24.8] (dark blue in color), the (100)<490> of a fraction of Fe[4.7%] (orange in color), and a (113)< > of a volume fraction of Fe[12.1%] (yellow in color) formed together with a small amount of α (100)<110> (green in color), as shown in Fig. 2(a3). The related ϕ2 = 45° section of ODF by EBSD is shown in Fig. 2(b3). Accordingly, the low-angle boundary distribution considerably decreased, as shown in Figs. 3(a3) and 3(b3). This implies that the energy storages of the textures γ (111)<112>, (113)<
 >, and (100)<490> were lower than that of the textures G and the cubic(100)<001>.
Upon further increasing duration of EPT to 7 s at 850 °C, the dislocation accumulation gradually speeded up, more piled up to the grain boundaries, i.e., the low-angle grain boundaries developed. The α (100) <110> texture (green in color) with a low energy storage reduced greatly. A small amount of texture γ (111) <110> (light blue in color) is formed. The volume fractions of the textures: γ (111)<112> (dark blue in color), (100)<490> (orange in color), and the (113)< > (yellow in color) decreased to Fe[22.6], Fe[3.1%], and Fe[9.2%], respectively. The related ϕ2 = 45° section of ODF by EBSD of the 850 °C EPT specimen is shown in Fig. 2(b4). Accordingly, the low-angle boundary distribution increased gradually, as shown in Figs. 3(a4) and 3(b4).
After 30,000 Hz EPT at 1000 °C for 9 s, the highly energy stored G-texture (110)<100> of a fractional Fe[10.0%] is formed again, together with the textures γ (111)<112> (dark blue in color) and (100)<490> (orange in color), as shown in Fig. 2(a5). The G-texture was observed in the ϕ2 = 45° section of ODF by EBSD of the 1000 °C EPT specimen, as shown in Fig. 2(b5).
From the Euler mapping and the distributions of micro-orientation angles shown in Figs. 3(a5) and 3(b5), it can be seen that most low-angle grain boundaries were found in the grains of G-texture (110)<100>, as indicated by the white lines in Fig. 3(a5). This implies that when increasing duration of EPT, the highly energy stored G-texture (110)<100> is formed again in accordance with the increases of the low-angle grain boundaries. However, the low-angle grain boundaries’ distribution was not as much as that in the EPT/680 °C specimen shown in Figs. 2(a2) and 2(b2). Accordingly, the G-grains occurred again, being coexistence with those textures with relatively lower energy storage: γ (111)<112> (dark blue in color) and (100)<490> (orange in color).
After 30,000 Hz EPT at 7.2 V/1050 °C for 10 s, both the α (100)<110> texture (green in color) and the α (112) <110> texture (pink in color) with low energy storages were well developed, as shown in Fig. 2(a6). In the ϕ2 = 45° section of ODF by EBSD of the specimen [Fig. 2(b6)], both the (100) <110> texture and the (112) <110> texture are indicated by arrows (green and pink in color), respectively. Accordingly, the related low-angle grain boundary distribution was reduced significantly as shown in Fig. 3(b6).
After several seconds of various steps of electropulsing, the cold-rolled Fe–3%Si alloy strip had been well recrystallized. The energy storage of the textures, i.e., the residual stress induced by the cold rolling was considerably reduced. Obviously, electropulsing tremendously strengthened recrystallization of the alloy strip.
C. Electropulsing kinetics
It was supposed that the electropulsing affected effectively the sliding behavior of the dislocation and the activity of vacancies.Reference Jiang, Tang, Shek, Zhu and Xu10 As far as the electropulsing-induced recrystallization process was concerned, it was anticipated that electron migration might be important when considering the influence of an electric current. The effects of the atomic diffusion flux, J, on the motion of vacancies and dislocation to the grain boundaries were important.
In the case of electropulsing, the J consisted of two parts: J t and J a, where J t was the flux of diffusion atoms due to the thermal effect and J a was the flux of the diffusion atoms owing to the athermal effect.Reference Sprecher, Mamnna and Conrad4–Reference Yang and Conrade6
The average atomic flux per second during multiple continuous electropulsing can be described asReference Lloyd11:
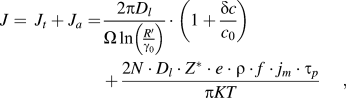
where D l is the lattice diffusion coefficient, c o the average concentration of vacancy, δc supersaturation concentration of vacancies, Ω atom volume, r o and R’ the distance far from dislocation where the vacancy concentrations are c o and c 0 + δc, respectively; N is the density of atom, Z* an effective valence, e the charge on an electron, ρ the resistivity, K the Boltzmann constant, T the absolute temperature; j m, f, and τ p are peak current density, frequency, and duration of each electropulse, respectively.
The thermal effect is influenced by interaction between electrons and dislocations and vacancies. As seen in the first part of the equation, the supersaturation concentration of vacancy, δc, increases at the grain boundaries with temperature under electropulsing. This results in a great enhancement of J t. The second part of the equation represents the athermal effect. The atomic flux for the recrystallization, J a, is strongly dependent on the parameters of electropulsing and increases remarkably with the duration of EPT, t ept. The active climbing of dislocations is accelerated at the low-angle grain boundaries due to a couple of effects of J t and J a. Accordingly, the textures of high energy storages form.
D. Characteristic evolution of G-texture under electropulsing
After 30,000 Hz EPT at 520 °C for 3 s, the (112)<110> and γ (111)<112> textures occurred, and the G-texture with the higher energy storage did not form. This is because when the distribution of the low-angle grain boundaries (<2°) sharply increases, dislocation climbing and accumulation become difficult, and the dislocation density decreases at the grain boundaries and the defects. In accordance, the energy storage reduces.
The G-grains have a higher distribution of middle misorientation (20–45°) during annealing.Reference Hayakawa, Szupunar, Palumbo and Lin12 Under electropulsing, the G-texture (110)<100> with high energy storage develops with increasing misorientation distribution of the low-angle grain boundaries (2–10°). This is one of the characteristics of the electropulsing-induced G-texture evolution.
The grain boundary energy is the most important parameter determining the boundary mobility. When the stored energy accumulated at the grain boundaries and the defects increases highly enough, the low-angle grain boundaries are activated to migrate and transform to the high-angle grain boundaries through exchanging vacancies. The new balance between the accumulation and the annihilation of the dislocations is established. The distribution of the low-angle grain boundaries decreases. In accordance, the textures with lower energy storages form, such as textures (113)< >, γ (111)<110>, (100)<490>, and γ (111)<112>.
Upon further increasing duration of elelctropulsing, both J t and J a, increase. The G-texture with high energy storage develops again. The fact that the low-angle grain boundaries are mostly located in the G-grains [Figs. 3(a2) and 3(a5)] illustrates that the electropulsing-induced texture evolution is closely related with the microstructural changes, such as low-angle grain boundaries distribution, and dislocation density, etc.
At the late stage of recrystallization, the thermal effect becomes dominant. The residual stress reduces considerably and the textures with lower energy storage become stable, meanwhile the recrystallized grains grow rapidly, as shown in Fig. 2(a6).
The above discussed mechanism reveals that the electropulsing-induced G-texture evolution is closely related with the dislocation and low-angle grain boundaries through energy storage. It would be possible to enhance considerably the production of high quality of silicon steel with high magnetic properties by electropulsing process.
IV. CONCLUSIONS
(1) Electropulsing tremendously strengthens recrystallization. Under electropulsing, various textures occur during several seconds of recrystallization, depending on the electropulsing-induced microstructural changes such as low-angle grain boundaries and the dislocation dynamics.
The storage energy of textures introduced into the deformed Fe–3%Si alloy strip is in an increasing order: (i) textures α (001)<110>, (112)<110>, (ii) textures (113)<
 >, γ (111)<110>, (100)<490>, γ (111)<112>, and (iii) textures G (110)<100> and the cubic texture (100)<100>.
(2) Share bands with high distribution of the small misorientation, i.e., the low-angle grain boundaries (<2°), are not favorable in dislocation climbing and accumulation. No G-texture with high energy storage forms.
(3) Under electropulsing, the G-texture with high energy storage develops as increasing misorientation distribution of the low-angle grain boundaries (2–10°). This is one of the characteristics of the electropulsing-induced G-texture evolution in the Fe–3%Si alloy strip.
 >, γ (111)<110>, (100)<490>, γ (111)<112>, and (iii) textures G (110)<100> and the cubic texture (100)<100>.
ACKNOWLEDGMENT
The authors thank Mr. F.Y.F. Chan of the Electron Microscope Unit of the Hong Kong University for his technical assistance.