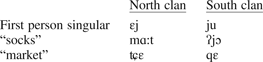
Sui exogamous marriage customs can provide a valuable laboratory for investigation of dialect acquisition. The Sui people are an indigenous minority centered in mountainous Guizhou Province in southwest China. Local customs require that the wife and husband have different clans of origin, and the wife permanently leaves her home village and immigrates to the husband's village at the time of marriage. Subtle dialect differences are observed between clans, although the dialects are mutually intelligible. As a result, it is often the case that, for example, a woman uses a first person singular pronoun, tone variants, and other dialect features that differ from her husband and other local villagers. Grown children of such women are said to speak the local clan dialect exclusively, regardless of their mothers' clans of origin, and regardless of any future migration. A few representative variants are shown in (1) for two regions, a “North clan” and a “South clan.”
(1) A few examples of clan dialect contrast:

Because many prior studies of mobility and dialect contact find significant dialect acquisition by immigrants in new dialect regions, this Sui study tests the hypothesis that married women typically acquire the dialect of the husband's clan in subtle yet measurable ways. Local folk understanding holds a view that is contrary to the hypothesis. According to the local folk understanding, even though immigrant married women spend their lives in the husband's dialect region, each woman permanently maintains the dialect features of her home clan dialect (henceforth clanlect Footnote 1 [cf. Smith & Johnson, 1986] will refer to the dialect of a person's home clan; exolect will refer to the dialect of the new region where a person has immigrated). When pressed, some consultants recall rare cases where an older woman who has been married for a very long time may begin to acquire a few features of the husband's dialect region.
The study presents results of field research testing the hypothesis. The primary set of data was collected from married women who had emigrated as adults from a southern region to a northern region as a result of the exogamous customs, henceforth “South women.” In addition, a set of data was collected from women who had migrated in the opposite direction, from north to south (henceforth “North women”), to control for the possibility that the immigrant women's linguistic behavior was due to any particular clan. Clanlect features of nonmobile adults and teenagers in both the North and the South clans were recorded for comparison to the mobile married women.
The present study involves a detailed acoustic analysis of sociophonetic variation in lexical tone, that is, a “sociotonetic” analysis. Examination of nonmobile speakers shows the presence of two clan-level tone variables (“tone 1” and “tone 6,” see Sui Tones section). These tones are examined acoustically, and the results suggest that the Sui folk understanding is quite accurate; the immigrant married women had maintained their clanlect tone variants with a high degree of precision despite living in their husbands' regions for more than a decade. The two tone variables were produced with the contours and pitches expected according to the immigrant women's home clanlects, both in a salient feature (tone 6 pitch) and in a subtle feature (tone 1 contour).
As discussed in Married Women's T1 section, only 1 of the 11 women in this study showed clear evidence of dialect acquisition in one of the tones, and that result is also predicted from the folk understanding that such traits might be occasionally found in an older woman who had been married a comparatively long time. Therefore, the overall results of the acoustic sociotonetic analysis in the current study concur with Sui folk understanding, and they also concur with studies of lexical variables and diphthong variables (Stanford, Reference Stanford2007, 2008), which find that immigrant Sui women maintain their original clanlects very accurately.
RESEARCH TOPICS
In addition to the specific goal of understanding Sui dialect contact and immigration, this study also aims to provide progress in the three areas: (a) sociotonetics, (b) variationist research of indigenous minority languages, and (c) dialect acquisition.
Sociotonetics
In comparison to the amount of variationist work that has been conducted on segmental variables, relatively few studies have addressed fundamental frequency (F0) as a sociolinguistic variable.Footnote 2 Moreover, although variationist studies of intonation have been increasing (cf. Fagyal & Thomas, forthcoming; Grabe, Reference Grabe, Gilles and Peters2004; Grabe et al., Reference Grabe, Post, Nolan and Farrar2000; Yaeger-Dror, Hall-Lew, & Deckert, Reference Yaeger-Dror, Hall-Lew, Deckert, Leistyna and Meyer2003 inter alia), variationist research of lexical tone remains quite rare, and acoustic studies of such sociolinguistic tone variables are even more rare.
Tone is a significant aspect of human language; Yip (Reference Yip2002) estimates that 70% of the languages of the world are tonal, and Fromkin estimates that over half of the world's population are speakers of a tonal language (Reference Fromkin1978). Tonetics (tone phonetics) has been developing methodology for acoustic tone analysis (e.g., Hombert, Reference Hombert and Fromkin1978; Ohala, Reference Ohala and Fromkin1978; Rose, Reference Rose and Togneri1994; Ross, Edmondson, & Seibert, Reference Ross, Edmondson and Seibert1986; Zhu, Reference Zhu1999), and segmental sociophonetics is a highly developed field as well. It seems then that valuable research could be conducted at the intersection of tonetics and sociophonetics, namely, a subfield that could be called sociotonetics, the sociophonetic study of lexical tone.
Tone has clearly played an important role in traditional dialectology, and a great number of studies have analyzed synchronic and diachronic variation in terms of tonal phonology (e.g., Cheng, Reference Cheng1977; Haas, Reference Haas1958). Yet for variationist sociophonetic research, where within- and between-speaker variation is observed with respect to sociolinguistic factors, lexical tone is not commonly addressed. Tone variables have been included in a few such variationist studies, and the results show the efficacy of tone as a sociolinguistic variable (e.g., Kerswill, Reference Kerswill1994; Q. Zhang, Reference Zhang2005). However, prior studies of lexical tone variables have been mainly dependent on auditory judgments,Footnote 3 rather than acoustic measurement and comparison of F0. Therefore, the current Sui study is intended to provide an example of an acoustic variationist study of tone as a sociophonetic variable.
Variationist research of indigenous minority languages
Quantitative variationist sociolinguistic research has placed comparatively little emphasis on indigenous minority languages (Stanford & Preston, forthcoming). A large number of qualitative ethnographic analyses, descriptive grammar studies, and traditional dialectology studies of such languages have provided invaluable progress in understanding underrepresented languages and cultures. Variationist sociolinguistics may also gain new insights and offer valuable perspectives from such languages as well. For example, although models of social stratification have been successful in many sociolinguistic studies (e.g., Labov, Reference Labov1966; Trudgill, Reference Trudgill1974), rural indigenous language communities can often be largely egalitarian (e.g., Clarke, forthcoming; Jackson, Reference Jackson1983:164; Ochs & Schieffelin, Reference Ochs, Schieffelin, Shweder and Levine1984; Rau, Chang, & Dong, forthcoming). Other factors, such as clan affiliation, are often more meaningful in such societies. Indigenous minority languages may also yield new variationist perspectives with respect to gender, age, the role of exogamy, networks, communities of practice, the lack of a standard, acute contact with intrusive majority cultures, and other issues.
Dialect acquisition
Research of Sui exogamy can also increase the understanding of adult second dialect acquisition, a topic that has received relatively less attention than other areas of linguistic inquiry (Chambers, Reference Chambers1992:147; Conn & Horesh, Reference Conn and Horesh2002:47). As a result, there are many unexplored issues and unanswered questions about the processes and constraints guiding dialect acquisition. The answers to such questions may lead to new insights about the sociolinguistic patterns to be found in the complex migrations and cross-cultural interactions in the contemporary world and also new perspectives about human universals underlying linguistic acquisition in general. The systematic migration patterns found among Sui exogamous clans serve as an ideal platform for the study of adult dialect acquisition. After all, Sui people reach adulthood in a given clan, and then each woman is expected to become a permanent resident of another clan at the time of marriage.
BACKGROUND FOR THE CURRENT STUDY
The linguistic and cultural heartland of the Sui people is rural Sandu Sui Autonomous County in the southern part of Guizhou Province in southwest China. The Sui people numbered 346,000 in a 1990 census (He, Chaofeng, & Zhiyang, Reference He, Chaofeng and Zhiyang1992:1), and by 2000, the population had increased to 406,902 (Edmondson, private communication). The great majority (93%) live in Guizhou Province (Burusphat, Wei, & Edmondson, Reference Burusphat, Wei and Edmondson2003). Sui is generally classified as a Kadai or Tai-Kadai language (Burusphat, Wei, & Edmondson, Reference Burusphat, Wei and Edmondson2003; Edmondson & Solnit, Reference Edmondson and Solnit1988), a language family whose most well-known members are Thai and Lao. Like other Kadai languages, Sui is isolating, largely monosyllabic, and has a system of contour tones (cf. Burusphat, Wei, & Edmondson, Reference Burusphat, Wei and Edmondson2003; Edmondson et al., Reference Edmondson, Esling, Harris and Wei2004; Edmondson & Solnit, Reference Edmondson and Solnit1988; Li, Reference Li1948, Reference Li1977; Pan, Reference Pan1981; Pei, Reference Pei1992; Zeng & Yao, Reference Zeng and Yao1996:262; J. Zhang, Reference Zhang1980).
Numerous different dialect contrasts are observed among Sui clans, and features of such clanlects are the focus of investigation for this study. Sui consultants report that no clanlect is considered more prestigious than another. No evidence of sociolinguistic deference to any one clanlect has been observed. Moreover, the status of Chinese in the educational system causes Standard Chinese to be viewed as the educational standard and prestige language, thus precluding the rise of any one Sui variety as a perceived standard or prestigious variety. Consultants indicate that clan-level linguistic features strongly index a speaker's home region and clan, but they do not report any sense of higher or lower social or economic status or other hierarchical sense linked to such features. Instead, rural Sui regions in the study may be viewed as practically egalitarian. Naturally, there would be some variation from family to family in terms of individual prosperity and educational levels. However, such variation is limited and unsystematic, because most people view themselves as members of one large Sui community, and there is a sense of solidarity as members of the same minority nationality within China.
SUI TONES
Sui tone pitch values are represented (Tables 1 and 2) on a five-pitch range of auditory differences where 5 is high and 1 is low (Chao, Reference Chao1930). For example, 55 represents a high level tone, and 13 represents a low rising tone. The tone reference numbers, for example, tone 1 (T1), tone 2 (T2), correspond to the transcription system traditionally applied to Sui and other languages of the area (e.g., Edmondson & Solnit, Reference Edmondson and Solnit1988; Zeng & Yao, Reference Zeng and Yao1996; J. Zhang, Reference Zhang1980). In that transcription system, tones T7 and T8 are transcribed for “checked” syllables, referring to syllables ending in /-p/, /-t/, or /-k/. The tones of checked syllables are further differentiated as S for a short vowel or L for a long vowel. Further analysis may show that each of the checked tones corresponds phonologically to an “unchecked” tone (Edmondson, private communication; Li, Reference Li1948; Y.-H. Lin, private communication). For example, it may be that T5 and T7 are phonologically equivalent.
Unchecked tones from SDB

* In both the Northern and Southern varieties, a value of 55 occurs in recent borrowings of Chinese words that have the local Chinese dialect's tone 3 (cf. J. Zhang Reference Zhang1980:12). Words of that type were avoided in this study.
From SDB (1956:23).
Checked tones from SDB

From SDB (1956:23).
The tone inventories of a northern dialect (Shuilong in Zhonghe Township) and southern dialect (Sandong Township) are listed in Tables 1 and 2 as found in the 1956 Shuiyu Diaocha Baogao (“Report on Investigation of the Sui Language”; henceforth SDB), a handwritten manuscript that reports on Chinese scholars' investigations of 17 Sui speakers representing 9 dialect regions.Footnote 4
Other researchers (e.g., Zeng & Yao [1996:260] and Luo [1992]) give slightly different values. Edmondson et al. (Reference Edmondson, Esling, Harris and Wei2004) provided acoustic measurements from Miaocao Village (Table 3), which is located in the northern region, near Shuilong. Their results (e.g., T1) showed some disagreement with the impressionistically obtained systems given by others. The current study concurs with their finding that northern T1 is a low falling tone.
Acoustic results for tones of Miaocao Township (in the northern dialect region)

Based on Edmondson et al. (Reference Edmondson, Esling, Harris and Wei2004).
SUI EXOGAMOUS CULTURE
In this section, a brief outline of Sui clan exogamy is presented according to consultants' reports and my own observations, as well as the cited literature. Sui villages are compact agrarian communities, and all of the men and children in a village usually belong to the same clan. Clan membership is defined on the basis of surname and folk understanding of local ancestry. According to local custom, a woman and man cannot marry if they are both from the same clan (Burusphat, Wei, & Edmondson, Reference Burusphat, Wei and Edmondson2003:9; Luo, Reference Luo1992:160; Shuizu Jianshi, 1985:110). Children keep their father's surname for life, regardless of later marriage. Thus, two people cannot marry if they have the same surname (Luo, Reference Luo1992:160). Exceptions to the surname rule are allowed in cases where two clans have the same surname even though they are known from oral tradition to be historically divergent. In the rural areas that are the topic of this study, Sui women usually marry in their late teens or early twenties. The husbands are generally a few years older at the time of marriage, usually marrying in their twenties. Clans are distinct and influential social units. When women immigrate at the time of marriage, they are crossing a significant social boundary.
The Sui dialect contrasts discussed here are linguistic side effects of the local custom of clan exogamy, unlike the custom of “linguistic exogamy” found in the Vaupes region of the Amazon (e.g., Aikhenvald, Reference Aikhenvald2002; Jackson, Reference Jackson, Bauman and Sherzer1974, Reference Jackson1983; Gomez, Reference Gomez Imbert1986; Grimes, Reference Grimes1985; Sorenson, Reference Sorenson1967 inter alia). In the Vaupes region, the wife and husband must have different native languages. By contrast, the Sui marriage taboo is associated with clan, not language. After all, some Sui clans have few dialect differences, so marriages between those clans would not result in significant dialect variation. An exogamous situation that is more similar to Sui is reported among the Nganhcara people of Cape York Peninsula in northern Australia (Smith & Johnson, Reference Smith and Johnson1986; see also Sutton, Reference Sutton1978). As with Sui, linguistic differences between wife and husband occur in Nganhcara households as a result of clan-level exogamy and such mutually intelligible dialect variants serve as “lexical markings of social groups” (Smith & Johnson, Reference Smith and Johnson1986:40).
IMMIGRANT WOMEN'S SOCIAL INTERACTIONS
Sui married women's daily networks are tightly focused on their husbands' villages. The married women of a given village originate in a variety of regions, and they do not appear to form social networks with other married women based simply on common home regions. Although the married women in a given village necessarily immigrated there from other clans, their specific clans of origin depend on the personal and family relationships directing each marriage exchange. Among the various clans represented by the married women in a given village, a woman may share the same clan of origin with others, so married women are not completely isolated from their original clanlects. However, the local clanlect of a given village is always the dominant variety by far, and married women in that village are surrounded by that variety. Also, casual social interaction and conversation between men and women are very common in daily village and farming activities, and such interactions are not culturally prohibited.
Village life for a rural married woman is centered on the demanding responsibilities of farming and child-raising in her husband's village. Naturally, women interact with their home villages during festivals and other occasional visits, but due to the expense of travel and the social status of most Sui women, a rural married woman's daily life is primarily focused on her husband's village with limited opportunities for outside interaction. Note also that few individuals own motorized vehicles; bus service is expensive relative to low farming income; and many villages are located far from a road. Therefore, although it is understood that the immigrant women are not entirely isolated from their original clanlects, the exolect dominates the majority of their daily interactions.
It should also be noted that in discussions about Sui clanlects and immigrant women's dialect features, no consultant ever suggested that the women's lack of exolectal acquisition was due to social interactions with other same-clan women in the husband's village. Instead, consultants repeatedly stated that a person's dialect features are tied to clan membership, and that community ridicule greets any person who uses dialect features other than those of the clan of origin. Each Sui person linguistically identifies with his or her home clan. A sense of clan identity, rather than density of social networks, appears to be the most relevant factor. Moreover, in comparable dialect acquisition studies, immigrants often maintain interactions in their original dialects (e.g., Bortoni-Ricardo, Reference Bortoni-Ricardo1985; Chambers, Reference Chambers1992); yet in contrast to the current study, significant exolect acquisition is usually observed.
Many such studies of dialect contact and mobility report evidence of change, whether viewed as dialect convergence or individual accommodation and acquisition (Bortoni-Ricardo, Reference Bortoni-Ricardo1985; Britain, Reference Britain2002; Chambers, Reference Chambers1992; Dyer, Reference Dyer2002; Kerswill, Reference Kerswill1994; Munro, Derwing, & Flege, Reference Munro, Derwing and Flege1999; Payne, Reference Payne1976; Sankoff, Reference Sankoff and Fought2004; Shockey, Reference Shockey1984; Trudgill, Reference Trudgill1986; Vousten & Bongaerts, Reference Vousten and Bongaerts1990; Watt, Reference Watt2002; Wells, Reference Wells1973). In addition, dialect change has been noted with respect to the formation of New Town koines, such as in Milton Keynes, England (Kerswill & Williams, Reference Kerswill and Williams2000) and Seishin, Japan (Asahi, Reference Asahi2002). Such results suggest that, ceteris paribus, immigrants typically acquire exolectal features to a significant degree, i.e., they show evidence of measurable – through usually incomplete – acquisition of exolectal features. Naturally, such acquisition is modulated by many social factors, and the Sui data analyzed below therefore represents a contrasting case where immigrants resist the exolect to a high degree.
DATA COLLECTION AND ANALYSIS
Interviews were conducted in 2005 and 2006 in Sandu Autonomous Sui County, Guizhou, China. Specifically, a northern clan concentrated around Shuilong in Zhonghe Township (henceforth the North clan) was contrasted with a southern clan about 10 miles away in Sandong Township (henceforth the South clan). The consultants consisted of speakers in both clans, including women who had moved from north to south and from south to north.
Because the study examines the effects of long-term dialect contact, the immigrant women in the study had all been married for at least 10 years. In this way, the study investigates the speech of women who had been long-term residents of the husband's clan. The primary focus of the study was the set of women who had immigrated from the South clan to the North clan (South women). However, a smaller set of women who had immigrated in the opposite direction (North women) was also investigated to show that the results were not particular to any one clan. This approach of interviewing mobile women from both regions was designed to control for any possible markedness or prestige factors.
For analysis, speakers are grouped as either mobile (i.e., the married women) or nonmobile speakers. Both mobile and nonmobile speakers contribute to the construction and maintenance of distinctive clanlects in Sui communities. However, to meaningfully measure whether or not the immigrant women's dialect features had diverged from their original clanlects, it is necessary to compare their speech with a set of nonmobile speakers in their respective home clans. My prior research and Sui consultants' reports suggested that the clan-level variation selected for this study far outweighs gender or age-related variation, so men could be used to represent the nonmobile group of clanlect speakers. However, such an approach could still leave uncertainty about gender-related variation and possible normalization discrepancies. On the other hand, nonmobile adult women are rare in the rural Sui villages in this study because women typically marry in their late teens or early twenties and then immediately immigrate to the husband's village. Even if such nonmobile unmarried women had been available for this study, they would not have matched the immigrant married women in terms of age; the unmarried women would have been approximately a decade younger.
Therefore, to account for both age and gender, the nonmobile group consists of both men and teenagers (mostly female). It is recognized that the teenagers may still retain an occasional feature from the mother's dialect (henceforth matrilect). Grown children speak the local clanlect rather than the matrilect, yet young children's speech can show some evidence of matrilectal influence (Stanford, 2008). Nonetheless, given the linguistic complexity of Sui villages, including teenagers as part of the nonmobile group appears to be a reasonable and practical solution.
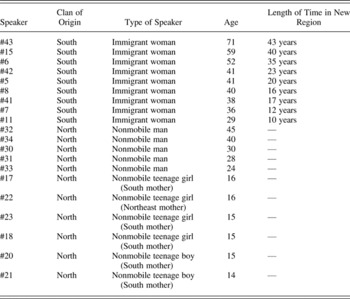
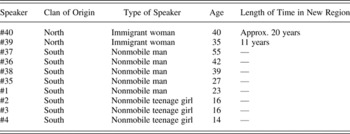
Tables 4 and 5 provide a list of speakers. “Speaker number” is an arbitrary reference number. For teenagers, the mother's clan is listed if known.
Recordings in the North clan Footnote 5

Note: Dashes indicate that category does not apply since those speakers did not migrate.
Recordings in the South clan

Note: Dashes indicate that category does not apply since those speakers did not migrate.
Speakers were interviewed in 2005 or 2006. The interview locations were private homes arranged by the kind assistance of host families in both the northern and southern regions. I conducted interviews in Sui using the dialect features of a clan located between the two regions being investigated. It is unlikely that consultants accommodated to the speech of the interviewer. The spectacle of a Westerner speaking Sui is considered an object of curiosity rather than a variety that locals would view as a model for accommodation in any way. The presence of an interviewer always has some influence on the speakers (Labov, 1972:209), but this effect was kept constant because the same interviewer conducted the research in all locations. Another factor to note is the interviewing environment itself. Because foreign visits to Sui regions are uncommon, the presence of a foreigner (especially one who speaks Sui and uses recording equipment) causes some interest in the community. Thus, the recording environment was not always completely isolated from occasional curious visitors. I maintained the recording environment as much as possible within the cultural role of a foreign guest.
METHODOLOGY FOR DATA COLLECTION
Because there is no Sui writing system in use and because rural married women of this generation are monolingual in Sui or have only limited Chinese speaking ability, data collection could not depend on traditional word lists and reading passages or spoken translation exercises. Dialect acquisition research often involves physical objects, pictures, or similar prompting (e.g., Chambers, Reference Chambers1992:147). In this Sui study, consultants were asked to count, describe pictures, and identify physical objects, as well as provide a personal narrative and discussion of local language ideology.
The words selected for research represented simple everyday concepts such as knife, chopsticks, hat, and so on. Physical objects and pictures were then prepared to prompt these words. Recordings were conducted in a “flexible phrase list” style; consultants were asked to frame each word in a short phrase, such as “Now I am saying ___” or “I see ___ there” or “That's a ___.”
Carrier phrases are common in other sociolinguistic research. However, this Sui study differs in that words were elicited in positions of slight prosodic focus in phrases that were allowed to vary slightly. The speakers were consciously aware of the word being elicited in each recorded phrase. This awareness resulted in a brief emphasis of the word through a slight prosodic focus as compared with the rest of the phrase. This approach proves effective and practical for the specific cultural and linguistic setting; in particular, it provided clear acoustic tone data. Furthermore, because Sui is not an object of study in the local educational system, a fixed carrier phrase style is ineffective. Consultants are not accustomed to holding to a fixed pattern in Sui speech, nor are many of them consciously aware of grammatical differences in phrasing. In addition, speakers sometimes place a discourse particle (such as a) at the end of phrases in a way that is difficult to control. In this respect, phrase-final position would not be a reliable defining position for the elicited words. Rather, between speakers and between tokens, a position of slight prosodic focus in a phrase is more reliable as a constant defined environment.
Free speech tones were considered briefly but rejected due to phonetic effects of adjacent tones. Although no regularized tone sandhi has been observed in Sui (e.g., Edmondson et al., Reference Edmondson, Esling, Harris and Wei2004; Zeng & Yao, Reference Zeng and Yao1996; J. Zhang, Reference Zhang1980), adjacent tones sometimes affect each other in such fast connected speech but less frequently in slower speech. In free speech data, for example, some high tone words were observed to become slightly lower when followed by a low tone. For this reason, free speech tone data was not used in the acoustic analysis here. On the other hand, a formal word list or citation style can create false pitch contrasts due to intonational patterns (Ladefoged, Reference Ladefoged2003:83–103). Thus, to obtain clear tone samples while also minimizing adverse effects of formal speech (Labov, Reference Labov1972:209) and reduce intonational effects as much as possible, the tones were elicited in “flexible phrase list” style in positions of slight prosodic focus.
This sociotonetic study therefore differs in focus from the Edmondson et al. (Reference Edmondson, Esling, Harris and Wei2004) tonetic study of one Sui dialect. Edmondson et al. interviewed one man from Miaocao (a northern dialect) using a citation style. The current study has variationist goals, so speakers were interviewed representing different regions, ages, genders, and immigration experiences. In the flexible phrase list style, (a) specific words of interest are collected more efficiently than in free speech; (b) the words are more isolated than those of free speech and therefore are more appropriate for analysis of tone; (c) this method helps to reduce the problems of intonation and formality associated with word list or citation style; and (d) this style is appropriate for speakers of unwritten languages in rural communities.
As for the elicitation process itself, to produce responses that were as natural as possible, I could not inform the speakers of the specific purposes of this dialect-oriented study. However, it was necessary to give a reason for the recorded interview that would satisfy the speakers' curiosity; the speakers were not familiar with linguistic research, and most had never met a Westerner before. I explained that I had been learning to speak Sui, and so I wanted to make some recordings of people speaking (recall that there is no notion of “standard” Sui; speakers were using their everyday language with me). I explained how a carrier phrase should be given for each object or picture that I would be presenting, and then the consultant produced phrases with the targeted words as various objects were introduced. When the main data elicitation portion of the interview was completed, consultants were then asked to provide free speech samples in personal narratives and/or give their views on local language ideology.
The tone investigation
In SDB (1956) and other previous studies of Sui, a regional difference in T6 is noted. In the southern region (Sandong), T6 has a value of 55. However, in all northern regions, T6 is given a lower value, usually 24. This difference is perceived as a highly salient pitch distinction between dialects. As for tone T1, SDB (1956) lists T1 with a value of 13 in both the North and South groups (Table 1), but the current study finds a subtle North-South difference in T1. In the North, T1 is a low tone that falls slightly, but it is a low rising tone in the South dialect. This result is consistent with Edmondson et al. (Reference Edmondson, Esling, Harris and Wei2004) who also find northern T1 to be a falling tone (Table 3) rather than a rising 13. Note, however, that this difference in T1 is limited to contour and is below the level of conscious awareness for most speakers.
The data sets were recorded on high bias analog cassette tapes with a Marantz tape recorder, and each speaker's recording was then digitized in Praat (versions 4.4.18 and 4.1.28). A total of 2651 tone tokens were extracted for the present study using the Praat “pitch listing” feature with a time step of 10 msec, formatted as tables of raw F0 frequency (Hz) versus raw time (msec), and then exported to the statistical programming package R 2.4.1. The syllables were either open or nasal-final, in order to avoid the effects of “checked” syllables (see Sui Tones section).
Time normalization
The overall approach in this tone analysis follows the methodology of prior tonetics research, such as Edmondson et al. (Reference Edmondson, Esling, Harris and Wei2004), Rose (Reference Rose1987, Reference Rose1990, Reference Rose1991, Reference Rose1993, Reference Rose and Togneri1994, Reference Rose and Abramson1997), and Zhu (Reference Zhu1999), where tone syllable tokens are normalized for time duration and then compared using mean pitch values at selected relative time points. Because the total duration of a tone varies between speakers and also varies between tokens of a single speaker, a necessary first step is to normalize the time duration. Using a function written for R 2.4.1, the full duration of each tone token is spread across a time axis of 600 “relative time” points, with an appropriate pitch value fitted to each relative time point. Such a tone track can then be easily compared with other tone tracks regardless of differences in raw duration.
Syllable edge effects
Possible syllable edge effects make it advisable to use caution with samples taken from the beginning and end of each tone track. Differences in syllable onset voicing are known to affect the tone track (e.g., Hombert, Reference Hombert and Fromkin1978; Hombert, Ohala, & Ewan, Reference Hombert, Ohala and Ewan1979; House & Fairbanks, Reference House and Fairbanks1953), and syllable-final effects may occur as well (e.g., Ladefoged, Reference Ladefoged2003:87–88). Rose (Reference Rose1993:197) notes the possibility of such “F0 perturbations,” and he omits the first and last 10% of the duration of each tone track (Rose, Reference Rose1987:349). A similar approach is followed here,Footnote 6 although a larger amount of the onset region is omitted due to the mix of onsets in this study.
The lack of a written language limited the number of words available because each target word had to be an everyday object or concept that could be easily elicited. As a result, the tone tokens contain a mix of onsets, and so the beginning portions of the tokens could have onset-related effects. However, both of the clanlect tone variables are easily observable in the latter half of the tokens, far from any region of onset perturbations. For T1, the relevant clanlect contrast occurs in the last one-third; for T6, the contrast is easily evident in the last one-half. Therefore, in the figures, the tone tracks are shown in the portion that is less likely to be affected by such edge effects: the last 10% is omitted following Rose (Reference Rose1987:349), and the first 25% is omitted as well, a conservative cushion based on the effects described in Hombert (Reference Hombert and Fromkin1978), Rose (Reference Rose1993), Wright and Shryock (Reference Wright and Shryock1993), and Chasaide and Gobl (Reference Chasaide and Gobl1993).
Mapping Sui tone inventories
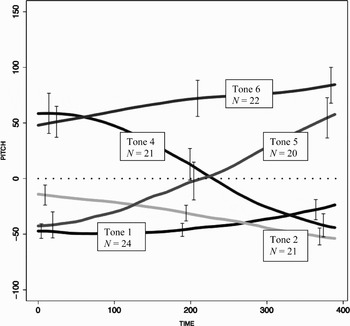
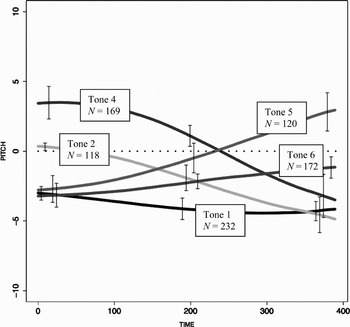
Sui has a mid-range level tone, T3 (value 33), and so the mean of T3 can serve as a benchmark in the F0 normalization process. Normalized mean pitch tracks of a speaker can be created using the mean pitch values of all the tokens at each relative time point for a given tone. The mean pitch tracks for the six Sui tones are plotted for speaker #3 (a South nonmobile teenage girl) in Figure 1. The pitch tracks of mid-level tone T3 are also included in the normalization (characterized by the dotted line at 0.0 Hz), so this plot represents 124 pitch track tokens of speaker #3. The points on the time axis are relative to a total duration of 600 “relative time” points, with the plot starting at 25% of the duration (time point 0) and ending at 90% of the duration (time point 390).
Tone inventory of speaker #3 (a South nonmobile teenage girl). Each line represents the mean of each given tone for that speaker (total N = 124, including T3 whose mean is represented by the dotted line). Plotted as relative time versus hertz. Normalized for duration and mean T3 pitch.

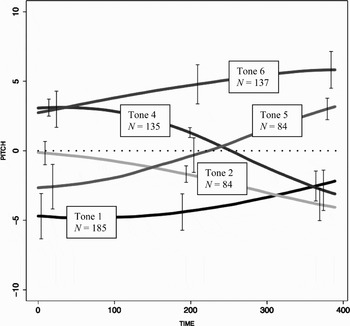
It is now possible to compare the North and South tone inventories. In Figures 2 and 3, each track represents the mean of all nonmobile speakers' mean tone tracks for the given tone.Footnote 7 First, Figure 2 plots the mean tone tracks for the South nonmobile speakers, representing 765 tokens. Now compare the tone inventory of the South with the North. Figure 3 plots the North nonmobile speakers' mean tone tracks, representing 1018 tokens.
Mean tones of South nonmobile speakers. Relative time versus semitones (see Semitone Pitch Normalization section). Normalized for duration and mean T3 pitch. N = 765 (including T3 whose mean is represented by the dotted line).

Mean tones of North nonmobile speakers. Relative time versus semitones (see Semitone Pitch Normalization section). Normalized for duration and mean T3 pitch. N = 1,018 (including T3 whose mean is represented by the dotted line).

A comparison of Figures 2 and 3 makes the tone variants quite clear. First, note the drastic North-South contrast in T6. In the South (Figure 2), T6 is far above the midpoint of the tone space. In the North (Figure 3), T6 begins very low, then rises slightly and approaches the midpoint from below. Second, consider the subtle variation in T1. In Figures 2 and 3, notice that T1 is clearly a low tone in both regions, having a starting point significantly below the midpoint. However, T1 falls slightly in the North, but in the South it rises toward to the midpoint. Although the distinction can also be detected auditorily, it is a subtle contrast, and folk consultants do not show evidence of a declarative knowledge of the difference. These two differences, one salient and reported by the speakers (T6) and the other one subtle and unreported (T1), will be used below to examine possible changes in the immigrant women's speech.
Semitone pitch normalization
The linear F0 normalization (i.e., defining the mean of mid level tone T3 as 0.0 Hz) serves as a useful basic framework for tone comparison, making it possible to compare different tokens, combine them into mean tone tracks, and make dialect observations. However, this approach is insufficient at a more detailed level of comparison, especially when two speakers have different tone ranges, as commonly occurs between male and female speakers. When considering subtle between-speaker and within-speaker variation, an additional normalization step is needed to account for pitch range differences.
A dizzying variety of F0 normalization strategies have been proposed for tonal languages. Zhu (Reference Zhu1999:46–56) outlines six different strategies that have been used in prior work with varying success. Rose also investigates different F0 normalization methods for tone (1987, 1991, 1993, 1994).
The normalization approach advocated here is the logarithmic scale of semitones.Footnote 8 This approach is used by many tone researchers, such as Zhu (Reference Zhu1999:45ff., 78ff.), Edmondson et al. (Reference Edmondson, Esling, Harris and Wei2004), Ross et al. (Reference Ross, Edmondson and Seibert1986), Baken (Reference Baken1987:127) (cited in Zhu, Reference Zhu1999:47), Hart, Collier, and Cohen (Reference Hart, Collier and Cohen1990:24) (cited in Zhu, Reference Zhu1999:47) inter alia. This strategy is chosen over nonlogarithmic normalization techniques due to the following:
1. It reflects the fact that perceived pitch intervals do not correspond linearly to hertz frequency, see, for example, Stevens, Volkman, and Newman, (Reference Stevens, Volkman and Newman1937) (cited in Ross et al., Reference Ross, Edmondson and Seibert1986:288) and Johnson (Reference Johnson2003:51–52).
2. Its effectiveness is highlighted by Zhu's (1999:78) measurements showing that Shanghai men's and women's semitone ranges are usually almost the same, even though their raw F0 frequency ranges may be very different. Similarly, Ross et al. (Reference Ross, Edmondson and Seibert1986:289) note that semitone conversions allow for data comparison between speakers with different ranges.
3. It does not require that a proportion of range be defined by two or more range boundaries, each of which would have its own variance and other potential problems.
RESULTS FOR THE T1 VARIABLE
The locus of clanlect variation in T1 is contour. In the following, the North-South nonmobile speakers' contrast in T1 contour is shown, and then the immigrant married women's T1 tones are examined.
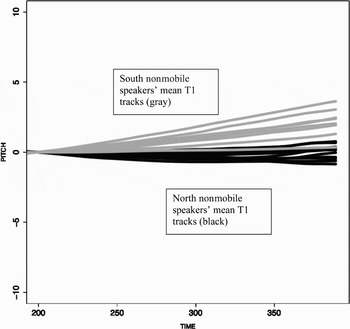
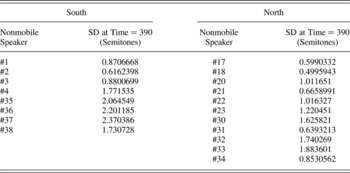
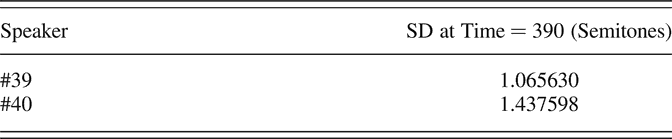
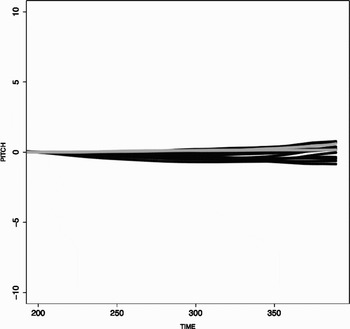
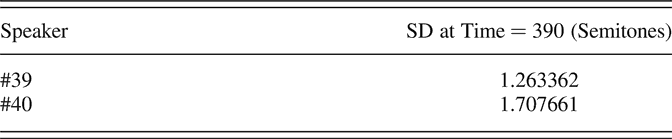
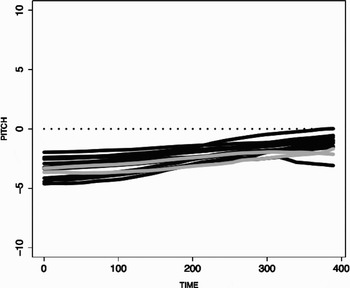
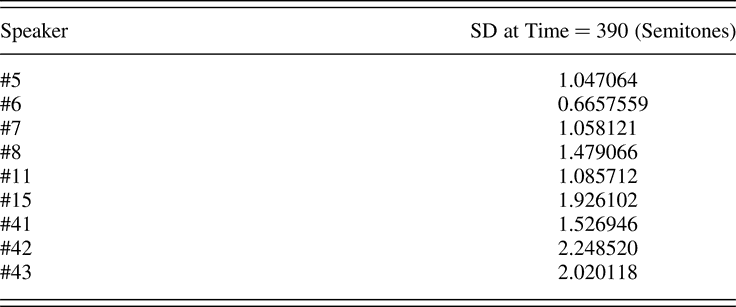
In Figure 4, the nonmobile speakers' mean T1 tracks are compared by region to show the contrast between clanlects. Each black line represents the mean T1 pitch track taken from all the tokens of one individual North nonmobile speaker. The whole group of black lines represent the mean T1 tracks for all the North nonmobile speakers. Likewise, each gray line represents the mean T1 pitch track taken from all the tokens of one individual South nonmobile speaker. The group of gray lines therefore represents the South nonmobile speakers. To maximize the visibility of the contour contrast in the figure, the figure zooms in on the portion of the tone track with clear T1 contrast: relative time = 200 to 390 (tone tracks are set to 0.0 semitones at relative time = 200). This portion of the tone track is also better for linear regression comparisons because many speakers have a slight dip or curve at earlier points in their T1 tone tokens, especially in the South group (cf. Figure 1). Standard deviations at time = 390 (i.e., the far right side of Figure 4) are given in Table 6.
Mean T1 tracks for non-mobile speakers (gray = South, black = North). N = 417. Relative time versus semitones. Pitch = 0.0 semitones at time = 200.

Standard deviation at time = 390 for T1 for nonmobile speakers

Figure 4 shows a distinct North-South contour contrast in T1. Only one of the South nonmobile speakers overlaps with the group of North speakers, speaker #2 (lowest gray line), who was a shy 16-year-old girl. T1 is very susceptible to subtle intonation differences or differences in speaker style. If a speaker tends to end his or her phrases with a slight falling intonation, then the rising component of South T1 will be less apparent. Speaker #2 was noted to have a shy, quiet speaking style, and therefore her slightly lower T1 is not surprising.
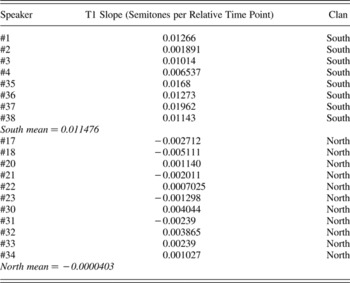
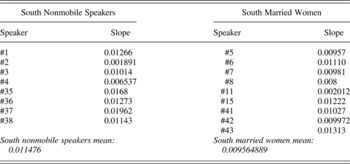
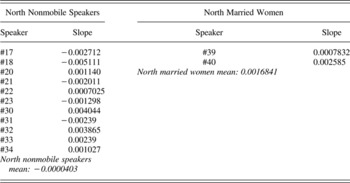
Linear regressions are now performed on the slopes of each nonmobile speaker's mean T1 tone tracks for the duration shown in Figure 4. The results are given in Table 7. The linear regression results quantify the observation from Figure 4 that South T1 has a higher slope; the slope is positive for the South speakers. North T1 has little or no positive slope, and the mean is close to zero.
Mean T1 linear regression results (slopes) for nonmobile speakers

Married women's T1
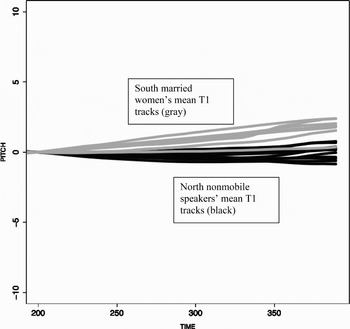
With the nonmobile speakers' T1 clanlect contrast established, the immigrant married women's T1 tones can now be compared with their home clans to see if they have acquired exolectal traits. First, the South married women's mean T1 tracks are plotted against the North nonmobile speakers. In Figure 5, each black line represents the mean T1 tone track for one of the North nonmobile speakers. Each gray line is the mean T1 track for one of the South married women. Standard deviations at time = 390 are given in Table 8.
North nonmobile speakers' mean T1 tracks (black) and South married women's mean T1 tracks (gray). N = 435. Plotted in semitones. Pitch = 0.0 semitones at time = 200.

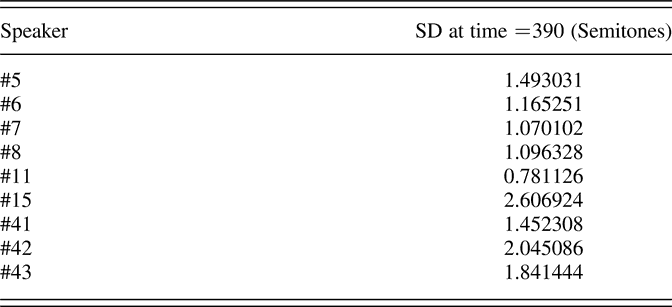
Standard deviation at time = 390 for T1 for south married women
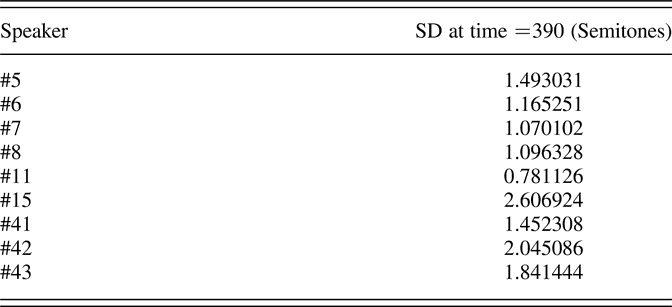
With the exception of speaker #11 (the lowest gray line in Figure 5), the South married women are all clearly separated from the North nonmobile group. That is, they maintain their original clan's T1 rather than acquiring the exolectal T1. As for speaker #11, first recall from Figure 4 that a very similar individual T1 difference was observed among the South nonmobile speakers, too (i.e., speaker #2), thus showing that an occasional speaker may vary slightly even among the nonmobile speakers. Speaker #11 was a 29-year-old South woman who had been married for 10 years in the northern region. In the original tone data extraction, I made a note that this speaker had a tendency to emphasize words by adding a nonlexical particle −a that had falling intonation. This was observed to affect her T1 contour, and so her low mean T1 contour is attributed to a particular personal mannerism rather than acquisition of North T1. This analysis is supported by the fact that she shows no sign of North acquisition in any of her other variables (neither in T6 below nor in the lexical variants and diphthong variants in Stanford (Reference Stanford2007, 2008)).
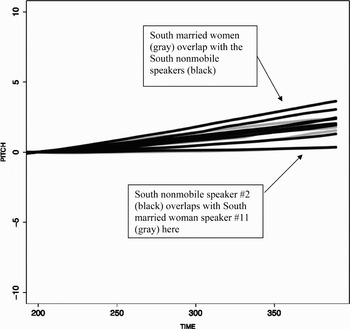
Next, the same South married women are now plotted against the South nonmobile speakers (Figure 6). The South married women are well within the contour range expected for South T1. The lowest South married woman, speaker #11, overlaps with the lowest South nonmobile speaker, speaker #2, as discussed earlier.
South nonmobile speakers' mean T1 tracks (black) and South married women mean T1 tracks (gray). Plotted in semitones. Pitch = 0.0 semitones at time = 200. N = 388.

The overall result of the graphical analysis of the South married women is quite apparent; the South married women's T1 tracks resemble the contour of their original clanlect (South) and not the exolect (North). Recall that the T1 contour variable is a subtle distinction for which the consultants do not have declarative knowledge. Thus, the graphical results here suggest that the South women are maintaining their original clanlects at a very sensitive level.
North married women
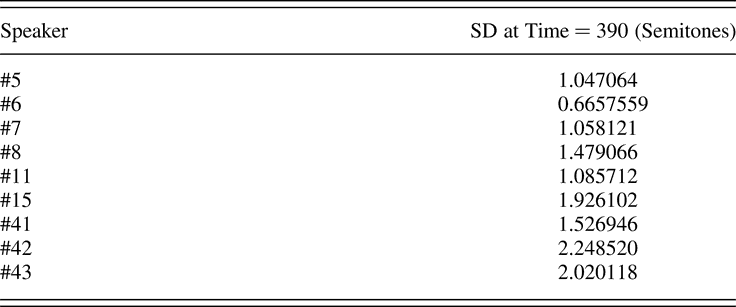
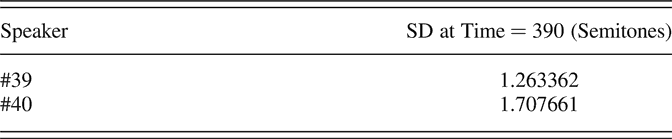
Although the South women are the primary focus of the study, results from two North married women are available as a control group to show that the South women's dialect maintenance is not unique to the South clan for some linguistic or social reason. First, the North immigrant women are contrasted with the South nonmobile speakers (Figure 7). Standard deviations are given in Table 9.
South nonmobile speakers' mean T1 tracks (black) and North married women's mean T1 tracks (gray). Plotted in semitones. Pitch = 0.0 semitones at time = 200. N = 234.

Standard deviations at time = 390 for north women's T1
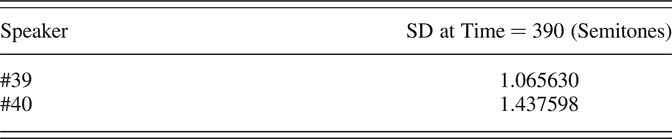
For the two North clan married women, represented by the lower two gray lines, it is clear that they do not fit in with the bulk of the South T1 tracks. Their slopes are much lower than most of the South speakers, indicating that they differ from the exolect. (Note: the lowest black line is South nonmobile speaker #2 discussed with Figure 4). Instead, the North women's T1 contours are more like their original clanlect, North.
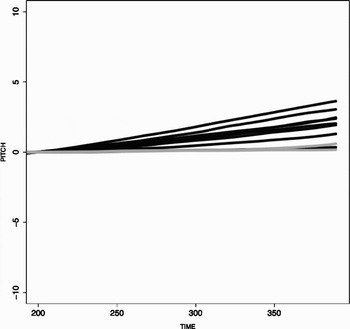
Next, the two North married women's mean T1 tracks are plotted with the North nonmobile speakers in Figure 8. Figure 8 shows that the married women of the North clan have maintained their original North T1 variants just as the South married women maintained the South T1.
North nonmobile speakers' mean T1 tracks (black) and North married women mean T1 tracks (gray). Plotted in semitones. Pitch = 0.0 semitones at time = 200. N = 281.

Linear regression for T1
When linear regression was performed (in R 2.4.1) on the married women's mean T1 slopes, the following results were obtained (Tables 10 and 11). Nonmobile speakers' results are repeated from Table 6 for comparison. From the slopes given in Tables 10 and 11, both the South nonmobile speakers and the South married women have notably positive mean T1 slopes compared with the North speakers whose slopes hover around zero. Of the two North women, speaker #40 has a slightly more positive slope, yet several North nonmobile speakers have positive slope, too, including two that are even higher than speaker #40. The North women's mean T1 slope is 6.8 times lower than that of the South nonmobile speakers and 5.7 times lower than that of the South married women, showing how the speakers have maintained their clanlectal T1 variants.
South linear regression results for mean T1 (pitch in semitones versus relative time for time = 200 to time = 390)

North linear regression results for mean T1 (pitch in semitones versus relative time for time = 200 to time = 390)

ANOVA results for mean T1 slopes
Analysis of variance (ANOVA) confirms these interpretations of the slope data (significance at p ≤ 0.05; conducted in R 2.4.1). First of all, the North and South nonmobile groups were found to be significantly different in mean T1 slope: F = 34.706, p = 0.00001778. Similarly, the North married women and South married women were found to be significantly different in slope: F = 12.564, p = 0.005317. This result shows that the married women maintain the T1 slope contrast of their clanlects.
Second, if the North women have not changed their T1 slopes significantly, then one would expect the North married women and the North nonmobile speakers not to be significantly different with respect to the mean T1 slopes, and ANOVA shows this to be the case: F = 2.0625, p = 0.1765. Similarly, the South married women were found not to differ significantly from the South nonmobile speakers: F = 0.7785, p = 0.3915.
Classification trees for T1
Additional evidence for this analysis can be gained through a classification tree analysis (Breiman et al., Reference Breiman, Friedman, Olshen and Stone1983; configured for R in Atkinson & Therneau, Reference Atkinson and Therneau2000). The classification tree procedure (conducted in R 2.4.1) clusters the data according to their similarity. In the classification tree output, only speaker #2 (one of the nonmobile South speakers) and speaker #11 (one of the South married women) were computed to cluster with a group other than the speaker's original clanlect. Those are the same two speakers that were singled out for individual discussion on the basis of the graphical evidence (speaker #2 was a shy North nonmobile teenager, and speaker #11 was a South married woman who added an –a particle to her T1 words and the intonation apparently affected T1). Thus, the classification tree results support the previous analysis.
Linear regression on individual T1 tokens
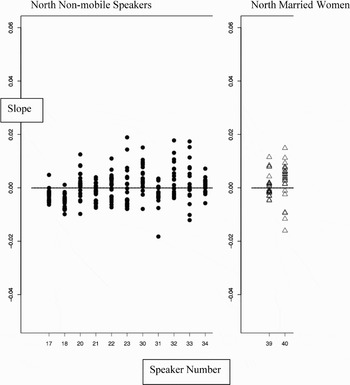
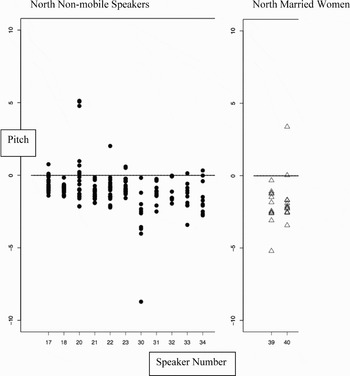
The ANOVA computations were performed on the linear regressions of the mean T1 tracks of the speakers. As a further check on that result, a more fine-grained perspective was gained by running linear regressions on each of the individual tokens of the speakers. The slopes of the individual T1 tokens are plotted in Figure 9. The horizontal axis is organized by speaker number, that is, North nonmobile speakers #17, 18, 20 –23, 30–34, and North married women speakers #39 and 40. Each dot represents the slope (semitones per relative time point, computed by linear regression) of an individual T1 tone token of the North nonmobile speakers for time = 200 to 390. The triangles are the slopes of each individual T1 tone token of the North married women. Notice that the T1 slopes of both the mobile and nonmobile North speakers are clustered around zero (and therefore considerably lower than the South speakers in Figure 10).
Slopes of individual T1 tokens of North nonmobile speakers and North married women. Organized by speaker number on the horizontal axis.

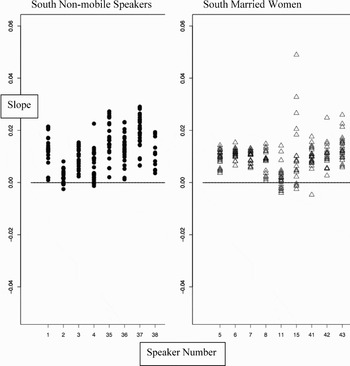
Next, Figure 10 shows the South T1 slopes. As before, the horizontal axis is organized by Speaker number (South nonmobile speakers #1–4, 35–38, and South married women speakers #5–8, 11, 15, 41–43). The dots are the slopes of each individual T1 token (for time = 200 to 390) of the South nonmobile speakers. The triangles are the slopes of each T1 token of the South married women.
Slopes of individual T1 tokens of South nonmobile speakers and South married women. Organized by speaker number on the horizontal axis.

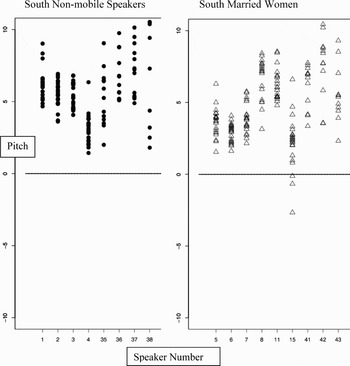
In Figure 10, notice that both the mobile and nonmobile South speakers have primarily positive T1 slopes, except for speaker #11 (see Figure 5 and discussion). Within-speaker variances of speakers in the two groups are comparable except for speaker #15. However, note that the only tokens that show large variance in speaker #15's data are tokens that are actually higher than the South nonmobile speakers (and therefore in the opposite direction of any possible acquisition of the exolectal low North T1 slope).
When ANOVA was performed on these tokens, the North and South nonmobile regions were found to be significantly different as before: F = 298.75, p < 0.000001. The North and South married women maintained that North-South dialect contrast: F = 62.517, p < 0.000001. The North nonmobile speakers and North married women were not significantly different: F = 3.6469, p = 0.05725. The South nonmobile speakers and South married women were significantly different (F = 8.4486, p = 0.003874) unless speaker #11 was excluded (see Figure 5 and discussion). Without speaker #11, the South married women and South nonmobile were not significantly different: F = 2.34, p = 0.127.
Conclusions for the married women's T1
In conclusion, the North-South dialect contrast in T1 contour is maintained in the married women according to their respective clanlects. Graphical and statistical analyses were conducted to show that the married women had not acquired exolectal T1 but rather maintained their original clanlectal T1 variants. The results of these analyses were quite consistent despite the fact that the T1 contour contrast is very subtle and sensitive to slight changes in intonation and speaker style.
RESULTS FOR THE T6 VARIABLE
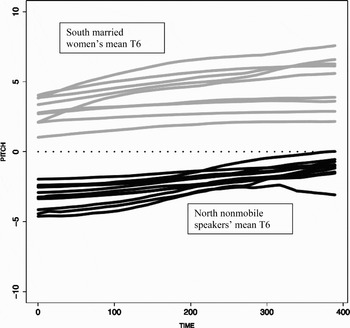
Recall from Figures 2 and 3 that tone 6 has a dramatic North-South contrast in pitch. In the South group, T6 is very high, starting near the maximum of T4. In the North group, T6 starts below the midpoint (T3) and rises toward the midpoint. The T6 contour does not appear to contrast significantly in these dialect regions, so pitch is the variable analyzed here.
T6 for nonmobile speakers
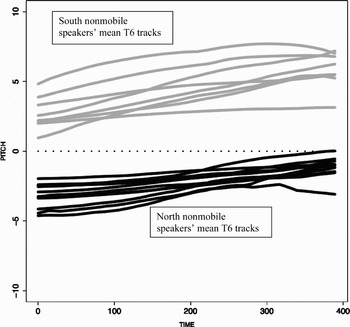
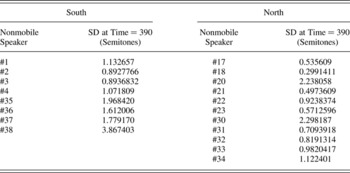
The mean T6 tracks for each nonmobile speaker are plotted in Figure 11. Each black line represents the mean T6 track of a nonmobile North speaker, and the gray lines are the South nonmobile speakers' mean T6 tracks. Standard deviations at time = 390 (i.e., the far right side of Figure 11) are given in Table 12.
North (black) and South (gray) nonmobile speakers' mean T6 tracks. In semitones; normalized for mean T3 and duration. N = 309.

Standard deviations at time = 390 for T6 for nonmobile speakers

In Figure 11, notice the categorical pitch contrast in T6 between the two dialects. Observe, however, that there is within-group variation as well. In particular, a South speaker (speaker #4), the lowest gray line in Figure 11, had a lower set of T6 tokens than the other South nonmobile speakers. The T6 result for speaker #4 shows that it is possible for a nonmobile speaker to be slightly lower than the rest, presumably due to individual differences in intonation style. As will be explained in the next section, a few of the South married women also have T6 tracks in the vicinity of nonmobile South speaker #4, so speaker #4's tone track serves notice that some slight T6 lowering due to individual style may occur even in the nonmobile group.
The South women's T6
In Figure 12, the South married women's mean T6 tone tracks are plotted in contrast to the North nonmobile speakers. A categorical difference is observed; the North nonmobile speakers' T6 tracks are considerably lower in pitch than the South married women's. Standard deviations are given in Table 13.
North nonmobile speakers' (black) and South married women's (gray) mean T6 tracks. In semitones; normalized for mean T3 and duration. N = 326.

Standard deviations at time = 390 for T6 for south married women
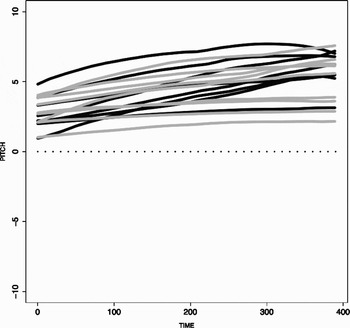
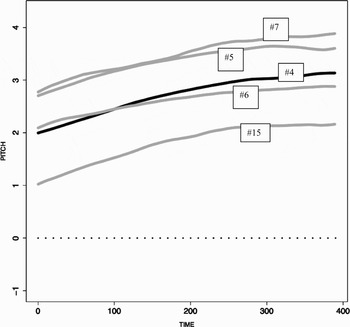
Next, the South married women's mean T6 tone tracks are plotted with the South nonmobile speakers in Figure 13. In Figure 13, the South married women lie within or very near the South nonmobile group. A few South married women (the lowest gray lines that represent speakers #5, 6, 7, 15) are in the lower area occupied by the South nonmobile speaker #4. When standard deviations are considered (Tables 12 and 13), the gap between the main set and the lower set is bridged to a large extent. However, discussion of individual cases follows, especially the lowest gray line in Figure 13 (speaker #15).
South nonmobile speakers' (black) and South married women's (gray) mean T6 tracks. In semitones; normalized for mean T3 and duration. N = 326.

Overall, the graphical evidence suggests that the South married women accurately maintained the high South T6 rather than acquiring the low exolectal version, with the possible exception of South married woman speaker #15 (see section about speaker #15).
The North women's T6
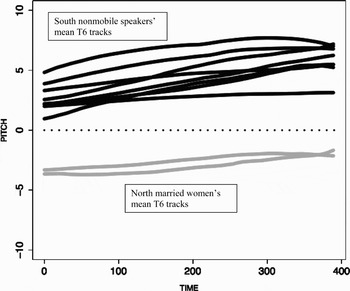
In Figure 14, the North married women's mean T6 tone tracks (gray) are plotted in contrast to the South nonmobile speakers (black). Standard deviations are given in Table 14. In Figure 14, the North married women's mean T6 tone tracks are all well below the midpoint, showing a clear contrast with the South nonmobile speakers. Next, the North married women (gray) are plotted with the North nonmobile speakers (black) in Figure 15.
South nonmobile speakers' (black) and North married women's (gray) mean T6 tracks. In semitones; normalized for mean T3 and duration. N = 172.

Standard deviations at time = 390 for T6 for North married women
In Figure 15, the North married women have low mean T6 tone tracks that closely correspond to the North nonmobile speakers. Thus, the graphical evidence for the North married women strongly suggests that they have not acquired the South clan T6 variant.
North nonmobile speakers' (black) and North married women's (gray) mean T6 tracks. In semitones; normalized for mean T3 and duration. N = 207.

Going deeper
Despite the overall result obtained from the graphical analysis that both the North and South married women have maintained their respective home clans' T6 variants, the data show some nuances at an individual level. Recall from Figure 13 that some South speakers were somewhat lower than others. This situation is discussed in more detail here.
First, a classification tree computation was conducted that clusters the speakers' T6 results into two groups. Two classification tree runs were performed: one run using each speaker's mean T6 pitches at time = 390 and one run using each speaker's individual pitch tokens at time =390. The results precisely confirm the analysis presented earlier; the North and South nonmobile speakers cluster according to their respective home clans, and the two sets of married women cluster with their original clans, with the only exception being speaker #15, whose case is discussed in the next section.
Next, recall from Figure 13 that a small group of South speakers' mean T6 tracks are somewhat lower than the main group. A close-up view of that lower group of five South speakers is shown in Figure 16. The black line in Figure 16 represents South nonmobile speaker #4's mean T6 track, showing the possibility that South T6 tone tracks may lie in this region. South married women speakers #5–7 may also be reasonably considered to be of this type, especially because they all clustered with the South in the T6 classification tree analysis. In addition, there is no evidence in other clanlect variables that speakers #5–7 have exolectal tendencies (Stanford, Reference Stanford2007). Given their pitch proximity to a South nonmobile speaker (speaker #4) and also considering standard deviations (Tables 12 and 13), there does not appear to be evidence that these South married women have significantly lowered their T6 toward the North variant. This conclusion is supported by ANOVA (see ANOVA for T6 section). By contrast, South married woman speaker #15 is worthy of more discussion. Her T6 is notably lower than the rest of the Southerners, and she was clustered with the North by the classification tree computation previously discussed.
Close-up of the set of lower T6 tone tracks: Four South married women (gray) and one South nonmobile speaker (black). In semitones; normalized for mean T3 and duration. N = 221 (including T3).

Speaker #15: An exception that highlights the rule
Speaker #15 is a 59-year-old South woman who married into a clan in the northern region 40 years ago. During data extraction, a North influence in her T6 words was noticed impressionistically. For example, two tokens of the T6 word hui “to sit” were obviously pronounced as the low North variant. She self-reported that she has noticed some North features coming into her speech during her 40 years in the northern region, and she suggested that this acquisition was occurring due to her interactions with the local exolect-speaking children. By contrast, most married women reported no acquisition of the exolect in their speech at all: “Not even a little,” they often said. This information, coupled with the empirical T6 results, draws a picture of speaker #15 as a rare case where a married woman has begun to acquire some dialect features of her husband's clan. In fact, her case is consistent with folk reports suggesting that older women might occasionally show signs of an exolectal feature, as previously discussed.
As for lexical variables (Stanford, Reference Stanford2007), speaker #15 showed little acquisition of the exolect. For example, she used South first singular in free speech, and she used a distinctly South discourse marker, jɑ, twelve times in a stretch of 3 minutes of free speech. She also used the word ɕɑn “to play” in free speech, which has only been attested among South speakers.
Nonetheless, speaker #15's lower T6 pitch, her self-reporting of some exolect acquisition, and observations from another local speaker about speaker #15's speech, all suggest that she had begun to acquire a slight amount of dialect features of the husband's village. In this way, speaker #15 seems to pattern somewhat like speakers in the prior dialect acquisition studies discussed previously.
Thus, speaker #15 is an exception that highlights the rule; unlike the other Sui women, she resembles the immigrants in other studies who acquired a new dialect to a significant extent. Her relatively long period of time in the North (40 years) may be a factor, although another South woman (speaker #43) had lived in the North for 43 years and yet maintained a very high South T6. The question remains about the specific aspects of speaker #15's life that caused her to be affected more than other married women. Because she reported that the local children have influenced her speech, it may be that she spent more time in child-rearing activities than typical Sui women did or that the children had a stronger influence on her for some other reason.
ANOVA for T6
The results of ANOVA tests on the T6 data are now reported. First, the mean T6 pitches of the North nonmobile speakers and South nonmobile speakers were compared at time = 390 and found to be significantly different: F = 210.42, p < 0.000001 (significance at p ≤ 0.05). The North married women and South married women were also significantly different: F = 35.223, p = 0.0001441. The means of the North married women were then compared with the North nonmobile speakers to see if they were significantly different. They were not different: F = 1.4098, p = 0.2581 (i.e., the North women had maintained their clanlectal T6 pitch). Finally, the South married women were compared with the South nonmobile speakers to see if they were significantly different. As with the North married women, the South women had no significant acquisition of the North T6 variant: F = 1.1629, p = 0.2979.
Thus, the ANOVA results for mean T6 pitches at time = 390 show that (a) the two clanlects have a significant difference in T6, and (b) neither set of married women (North and South) had acquired their respective exolect to any significant degree. However, when ANOVA was conducted on the individual T6 tokens of each speaker (rather than the mean of each speaker's T6 tokens), then the results were more nuanced.
First, the expected dialect contrast in T6 was confirmed because the North and South nonmobile groups were significantly different: F = 1226.5, p < 0.000001, and the North and South married women were significantly different: F = 256.57, p < 0.000001. This shows, once again, that the married women had maintained the T6 dialect contrast found in the nonmobile speakers of their home regions. However, in this ANOVA on individual T6 tokens, the North married women and North nonmobile speakers were found to be significantly different: F = 9.0957, p = 0.002886. The South married women and South nonmobile speakers were also significantly different: F = 13.178, p = 0.000335. The North women's ANOVA result is due to the fact that the North married women's tokens were actually somewhat lower (and therefore even farther from the South) than some of the North nonmobile speakers, as shown in Figure 17.
The individual tokens of T6 for the North women are plotted in Figure 17 along with the North nonmobile speakers. The horizontal axis is organized by speaker number. The dots represent the pitch at time = 390 for each individual token of the North nonmobile speakers. The triangles are the pitches for the individual tokens of the North married women.
Individual tokens of T6 pitch (semitones) at time = 390 for North nonmobile speakers (dots) and North married women (triangles). Organized by speaker number along the horizontal axis.

In Figure 17, notice that most tokens are below the midpoint for both the North nonmobile speakers and the North married women. By looking at these individual pitch tokens, it is very evident that the North married women have not moved in the direction of a South T6 pitch. If anything, their pitches are lower than the North nonmobile speakers' pitches, and thus even farther from the high South T6 variant (also compare Figure 17 with the mean T6 tracks plotted in Figure 15).
Next, to analyze the ANOVA result presented above for the individual T6 tokens of the South speakers, the South nonmobile speakers and South married women's individual T6 tokens at time = 390 are plotted in Figure 18. The dots represent the pitches of the individual T6 tokens of South nonmobile speakers; the triangles represent the South married women's pitches. The horizontal axis is organized by speaker number.
Individual tokens of T6 pitch (semitones) at time = 390 for South nonmobile speakers (dots) and South married women (triangles). Organized by speaker number along the horizontal axis.

In Figure 18, notice that there is only one South married women whose T6 pitches are noticeably lower than the non-mobile speakers' pitches. That, of course, is the exceptional speaker #15, whose situation was described earlier. However, when ANOVA was conducted without speaker #15, there was still evidence that the set of South married women was different from the South nonmobile speakers: F = 4.3677, p = 0.03757. Recall, though, from Figure 16 that another South woman's T6 was slightly below the expected range of the nonmobile speakers: speaker #6. When that other married woman (speaker #6) with a relatively low T6 was removed, ANOVA results showed that the remaining group of seven South women were not significantly different from the South nonmobile speakers: F = 0.2439, p = 0.6218. On the basis of speaker #6's lexical and segmental results and her self-reporting (Stanford, Reference Stanford2007), there is no indication that speaker #6 should be viewed as a speaker who had acquired some of the exolect like speaker #15 did. After all, even though speaker #6's T6 was low enough to affect the individual-token run in ANOVA, her T6 is actually very close to one of the South nonmobile speakers, speaker #4 (see Figures 13 and 16). In addition, she was clustered with the South group in the classification tree analysis, unlike speaker #15 who clustered with the North group. For these reasons, it would be unwise to view speaker #6 as having acquired an exolectal T6. Therefore, speaker #15 is considered to be the only married woman with exolectal acquisition in T6, although speaker #6's case is noted.
Summary for the married women's T6
The overall conclusion after analysis of the 11 married women's T6 pitches both graphically and statistically is that most women (10 of 11) had not acquired the T6 pitch of their exolects.
CONCLUSIONS
The acoustic sociotonetic investigation presented here shows that most immigrant Sui married women maintain their original clanlects' tone variants very accurately despite spending a decade or more in the husband's clan. First, tone T1 was shown to have a subtle North-South contour contrast for the nonmobile speakers. The immigrant women's tones also showed the same contour contrast; the women produced T1 with contours very close to the nonmobile speakers of their respective home clans (shown graphically and statistically). Tone T6 was shown to have a salient North-South clanlect contrast in pitch in the nonmobile speakers, and graphical and statistical analysis determined that most of the immigrant women (10 out of 11) maintained T6 in a manner that closely corresponded to their original clanlects. Speaker #15, a South woman who had been married 40 years, showed evidence of exolectal acquisition in T6 pitch. These results match the folk consultants' reports that although married women do not usually acquire the exolect, in a few cases an older woman may begin to have some exolectal features after she has been married a comparatively long time.
When the sociotonetic results are viewed in light of the additional evidence of dialect nonconvergence found in the lexical and segmental results of Stanford (Reference Stanford2007, 2008), it becomes quite apparent that most Sui immigrant married women resist acquisition of the husband's dialect to a very high degree. Specifically, North and South immigrant women produce the lexical variants (both cognate and noncognate) of their original clanlects very accurately. Immigrant women's pronunciations of clan-level diphthong variants also closely match their respective original clanlects, rather than the exolect.
Such results confirm speakers' own descriptions of the local sociolinguistic setting. For example, a South woman who had been married in the North for 20 years (speaker #5) said her speech had not changed at all during her time in the North: “Not even a single word.” She went on to illustrate the categorical nature of the local language ideology: “The Z. surname people [North surname] don't speak like the P. surname people [South surname]. If a mother is a P. person, she won't speak the same [as her husband and children].”
Moreover, when asked what would happen if a speaker did not use her original clanlect, consultants reported that ridicule or criticism are common consequences. For example, a South woman who had been married in the North for 35 years (speaker #6) said, “If someone with the P. surname [South clan surname] came to Ljong [North clan region] and spoke like Ljong, everyone would laugh. She'd feel embarrassed. She wouldn't speak that way anymore.”
Children of immigrant women are subject to the same societal expectations; they report that they would be ridiculed if they used matrilectal features. Stanford (2008) shows that even very young children already primarily speak the local clanlect, yet significant mixing of matrilectal features can be observed (e.g., some very young children showed evidence of a matrilectal T6). Older children's speech more closely matches the local clanlect, but even teenagers may show occasional signs of the matrilect.
Across the community as a whole, therefore, each speaker permanently identifies with his or her home clan by using the appropriate clanlectal features. Unlike many other dialect contact studies that show significant dialect acquisition or leveling in many speakers, in the case of Sui clan-based exogamy, both the mobile and nonmobile speakers usually maintain clanlect distinctiveness very accurately regardless of close contact with other clanlects. An individual's identification with his or her home clan outweighs the common human tendency to adapt to a new dialect region to some extent. In this way, this Sui study illustrates how individuals' linguistic acts of identity (cf. Le Page & Tabouret-Keller, Reference Le Page and Tabouret-Keller1985) promote dialect distinctiveness in the face of long-term contact. As Milroy notes, speakers can construct “linguistic distinctiveness from a contrasting other group” (Milroy, Reference Milroy2002:4, 9). Just as groups such as the Lumbee people maintain linguistic distinctiveness from other English-speaking ethnic groups (Schilling-Estes, Reference Schilling-Estes2000), Sui speakers maintain linguistic distinctions between clans (see also Gordon, Reference Gordon2000).
In addition to the specific results of this Sui dialect contact investigation, this study has modeled acoustic sociotonetics, providing methodology for future research. The study has also contributed toward variationist research of indigenous minority languages, showing an example where clan is a crucial sociolinguistic variable and how a clan-based exogamous society can provide insight into issues of language variation.