Reviews of past calculations of the economic losses of clinical mastitis (Schepers & Dijkhuizen, Reference Schepers and Dijkhuizen1991; Halasa et al. Reference Halasa, Huijps, Østerås and Hogeveen2007) clearly show that mastitis has a great economic impact, and that there has been a great variation in the economic losses calculated in different studies. Most studies used one or more cost categories in their calculation. Only a few calculated all costs categories including: milk production losses, drugs, discarded milk, veterinarian, labour, milk quality, culling and occurrence of other diseases (Gill et al. Reference Gill, Howard, Leslie and Lissemore1990; Schepers & Dijkhuizen, Reference Schepers and Dijkhuizen1991; Halasa et al. Reference Halasa, Huijps, Østerås and Hogeveen2007). Yet these factors cause large variation in the economic losses due to mastitis. This is important because the loss concept must be seen as a relationship, not a number. Losses are smaller under low-input production methods than under more intensive systems. Moreover, the economic consequences of, e.g., production losses differ between farms. The potential economic importance of disease is therefore not uniform across farms, regions or countries, and control measures justified in one context may not be worthwhile in another (McInerney, Reference McInerney1996).
Because in general mastitis will cost farmers money, most farmers want to reduce the incidence of mastitis. To do so, farmers need to optimize mastitis management. Internal or external motivation to reduce mastitis drives farmers to change management (Lam et al. Reference Lam, Jansen, Van den Borne and Van Veersen2007). An important part of external motivation is the financial impulse from penalties and bonuses (Schukken et al. Reference Schukken, Leslie, Weersink and Martin1992; Valeeva et al. Reference Valeeva, Lam and Hogeveen2007). The economic losses of mastitis are a part of the internal motivation. A farmer who knows that mastitis causes production inefficiencies and extra additional costs can be motivated to act on mastitis prevention, even if his farm is not even near the penalty level (Valeeva et al. Reference Valeeva, Lam and Hogeveen2007).
As a prerequisite, information on the actual incidence of mastitis and the associated economic losses are important. Decisions are often based on the farmer's perception of the economic losses due to mastitis. Perception refers to what a farmer thinks the economic losses of mastitis are on his farm. The farmer's perception can deviate from the real situation. It is unknown how large this deviation is, and therefore the need for farm-specific calculations is also unknown. Because communication and understanding between farmers and their advisors is very important (Vaarst et al. Reference Vaarst, Laarup-Laursen, Houe, Fossing and Andersen2002) personalization of the situation is essential to the successful giving and receiving of advice and to achieving best practice for the farmer (Lam et al. Reference Lam, Jansen, Van den Borne and Van Veersen2007).
Because of the factors mentioned above (non uniformity across farms, motivation and personalization) farm-specific calculations are necessary (Hogeveen & Østerås, Reference Hogeveen and Østerås2005) and a flexible tool to calculate the economic losses of mastitis for a farm, taking into account the specific mastitis situation and production circumstances on the farms is therefore important.
The objectives of this paper were to describe a model developed to calculate the economic losses of mastitis and describe the use of the tool based on this model to calculate the farm-specific economic losses of mastitis; to show the economic losses of mastitis for the average Dutch situation and individual dairy farms; and to compare the economic losses of mastitis of specific dairy farms with the perception of the farmer.
Materials and Methods
A model to calculate the farm-specific costs of mastitis and a tool based on this model were developed. The tool was developed in Visual Basic, Express Edition 2005 in such a way to enable farmers and their advisors to use all available information at the farm and to use the best available estimates when farm-specific information was lacking. These default values were based on scientific literature, available Dutch data (collected by the Dutch Udder Health Centre) and the expertise of the authors. The tool has a user friendly interface and large flexibility. If much information on factors such as the incidence and distribution of pathogens is known, this can be entered. If much of this information is not known, default (‘our values’) settings can be used. The current version of the tool is available in Dutch on the internet site of the Dutch Udder Health Centre (www.ugcn.nl) or in English from the authors.
Default calculation of the economic losses of mastitis
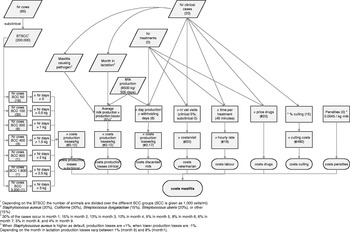
The set up of the model and the default values used for the default calculation of the economic losses of mastitis are given in Fig. 1. The calculation structure is based on the framework described by Halasa et al. (Reference Halasa, Huijps, Østerås and Hogeveen2007). The total economic losses of mastitis can be disaggregated into: milk production losses, split up between clinical and subclinical mastitis, drugs, discarded milk, veterinarian, culling, labour and penalties. These cost categories are dependent on the number of clinical and subclinical cases and the pathogens involved. In the Dutch situation, it is safe to assume an annual incidence of 30 clinical mastitis cases per 100 cows. These clinical mastitis cases were distributed over different mastitis causing pathogens, namely Staphylococcus aureus (20%), coliforms (30%), Streptococcus dysgalactiae (15%), Streptococcus uberis (20%), or other (15%) (Barkema et al. Reference Barkema, Schukken, Lam, Beiboer, Wilmink, Benedictus and Brand1998; de Haas et al. Reference De Haas, Barkema and Veerkamp2002; Gröhn et al. Reference Gröhn, Wilson, Gonzalez, Hertl, Schulte, Bennett and Schukken2004).
Flow chart of the calculated economic losses of mastitis where default values are given between brackets and with farm situation input ( ), calculations (
 ), and output (
 ).

Production losses
In the default calculation a mean 305-d milk production of 8500 kg/cow (NRS; www.nrs.nl) was assumed. The effect of clinical mastitis on the degree of milk loss varies, depending on the stage of lactation when the disease occurred (Lucey & Rowlands, Reference Lucey and Rowlands1984) and the pathogens involved (Gröhn et al. Reference Gröhn, Wilson, Gonzalez, Hertl, Schulte, Bennett and Schukken2004). Therefore, the cases were distributed over 9 months of lactation. According to default values, 30% of the cases occur in month 1, 15% in month 2, 13% in month 3, 10% in month 4, 9% in month 5, 8% in month 6, 6% in month 7, 5% in month 8 and 4% in month 9 (de Haas et al. Reference De Haas, Barkema and Veerkamp2002). The clinical cases cause production losses, varying between the time of occurrence during lactation between 8% (month 1) and 1% (month 9), with an average of 5%. Total production losses due to clinical mastitis were calculated by multiplying the cases per month with the associated production losses per month. In the default calculation, it was assumed that Staph. aureus mastitis caused more production losses than other pathogens. If the number of Staph. aureus mastitis cases was higher than default, the production losses were estimated to be 1% higher. If the number of Staph. aureus mastitis cases was lower, the production losses were estimated to be 1% lower.
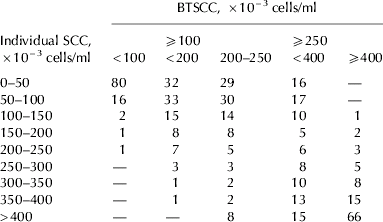
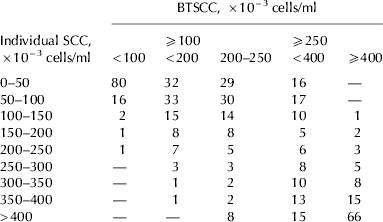
Subclinical mastitis (defined as cows with an increased somatic cell count, SCC) cause economic losses because of production losses. A SCC below 50 000 cells/ml classifies a cow as being normal (Schepers et al. Reference Schepers, Lam, Schukken, Wilmink and Hanekamp1997). Every doubling of the SCC above 50 000 cells/ml results in a milk production loss of 0·4 kg milk/d for primiparous cows and 0·6 kg milk/d for multiparous cows (Hortet & Seegers, Reference Hortet and Seegers1998). Using the input of the farms bulk tank somatic cell count (BTSCC), a farm was assigned to one of five BTSCC groups. For every group of BTSCC, individual animals were assigned to different groups of SCC (Table 1). Assignment to groups of SCC was based on information from a large set of data of the individual SCC of cows in the Netherlands (Van den Borne et al. Reference Van den Borne, Van Schaik, De Jong and Lam2006).
Distribution of the percentage of animals over somatic cell count (SCC) groups for different bulk tank somatic cell counts (BTSCC) based on a baseline study (Van den Borne et al. Reference Van den Borne, Van Schaik, De Jong and Lam2006) and expertise
The costs of production losses were set at €0·12/kg in the default situation (Huijps & Hogeveen, Reference Huijps and Hogeveen2007). These costs consist of the marginal costs of feed, water, manure, bedding material, health and breeding costs, corrected for additional revenues for calves and meat, needed to keep more cows to fulfil a yearly milk quota. In the Netherlands, most farmers fulfil their quota, so in the default calculation the fulfilment of the quota was used as an assumption. When milk is discarded, these costs were higher because of the feed costs and are estimated to be €0·17/kg. The costs of a decreased milk production per cow under quota circumstances depend on the farm situation and are therefore difficult to estimate. To make it easier to estimate the farm-specific costs of production losses, four different farm types were given, with corresponding default costs. Besides these four choices, farmers could enter their own value.
Other cost factors
Because of treatment of a clinical case, milk has to be discarded during the treatment days and waiting time. We assumed that milk had to be discarded for 6 d (based on a typical 3-d treatment and 3-d withholding period). Based on the average 305-d production and the month in lactation, the daily production was calculated. It was assumed that for 5% of the clinical cases a veterinarian would be consulted, with visit costs of €20 (excluding drugs). Costs for drugs were associated with every clinical mastitis case and were set at €20 per case. Every clinical mastitis case will take a farmer on average 45 min to treat for an hourly rate of €18. In a default situation, 15% of the cows with clinical mastitis were expected to be culled with average culling costs of €480 per culled cow. These culling costs include all costs and benefits of culling a cow (slaughter price, replacement costs and retention pay off). When, in a specific situation, a farmer receives a penalty, the milk has to be discarded for €0·0045/penalty point per kg milk delivered. However, in the default calculation, it is expected that no high BTSCC occurs so no penalties for high BTSCC were given.
Farm-specific calculations of the economic losses of mastitis
Farmers had access to the tool during 3 open-door days at dairy farms, organized by the Dutch Udder Health Centre. During these 3 d, 78 farmers used the tool to calculate the economic losses of mastitis for their farm (farm-specific calculation). While using the tool, the farmers had no access to any farm data except their own assessment of these data. First, they were questioned about their expectation of the annual economic losses for mastitis on their farm. This question was used to measure their perception of the economic losses of mastitis. Next, they could perform calculations of the economic losses of mastitis on their farm using the tool described earlier. This information was used for the farm-specific calculation of the economic losses for mastitis. During the calculation, one of the authors was nearby to offer assistance when necessary.
Statistical analysis
Data were analysed with SPSS 12.0.1 for Windows (SPSS Inc., Chicago IL, USA). With descriptive statistical analyses, the minimum, mean, maximum and sd for the different cost factors were calculated. After this, the expected economic losses per cow were plotted against the calculated economic losses per cow. Farmers were divided in two different groups, based on the deviation between expected and calculated economic losses per cow. Farmers in group 1 were farmers whose perception was close to the real economic loss (+/−25%) (good estimators) and group 2 were farmers who underestimated the economic losses by >50% (underestimators). With an independent sample t test, the differences between these groups for economic factors (e.g. costs production losses, visit costs) and parameters on mastitis incidence and production effects (e.g. clinical mastitis incidence, BTSCC, nr animals culled) were analysed.
Results
Default calculation of the economic losses
The default economic losses for a clinical mastitis case were €235 for month 1, €225 for month 2, €204 for month 3, €194 for month 4, €184 for month 5, €174 for month 6, €168 for month 7, €166 for month 8, and €164 for month 9. Under default circumstances, this resulted in €210 per average clinical mastitis case. The economic losses caused by subclinical mastitis per cow present on a farm, with an average production of 8500 kg/cow, were for a BTSCC <100 000 cells/ml, €53; for a BTSCC between 100 000 cells/ml and 200 000 cells/ml, €72; for a BTSCC between 200 000 cells/ml and 250 000 cells/ml, €77; for a BTSCC between 250 000 cells/ml and 400 000 cells/ml, €94; and for a BTSCC >400 000 cells/ml, €120.
Total economic losses (clinical and subclinical cases) for a default farm of 65 cows varied from €114/cow per year on a farm with a BTSCC <100 000 cells/ml to €182/cow per year on a farm with a BTSCC >400 000 cells/ml. On farm level, this means a variation in economic losses between €7453 and €11 808. Economic losses for subclinical mastitis were estimated to be higher than for clinical mastitis.
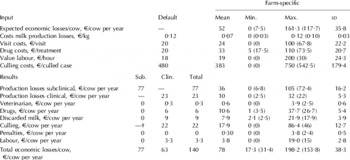
Production losses accounted for 36% of the economic losses of clinical mastitis, 100% for subclinical mastitis, and for 71% of the total economic losses for mastitis. Culling cost was the other factor accounting for a large part of the total economic losses (16%). Penalties (0%) and veterinarian (1%) have only a small influence on the total economic losses (Table 2).
The values used for the calculation of the yearly economic losses of mastitis (in €/cow per year) for a farm with 65 cows for the different factors for clinical, subclinical, and all mastitis under default circumstances and a bulk tank somatic cell count of 200 000 cells/ml and the mean, minimum (5%), maximum (95%), and sd of economic parameters from Dutch commercial dairy farms (n=64)

† Under default circumstances we assume no extra culling because of subclinical mastitis. All culling cases are included in the clinical mastitis factor
Perception and assessment by farmers and farm specific calculation
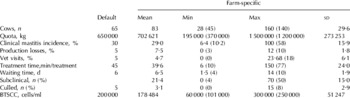
Data from 64 of the 78 farmers was used for statistical analyses. The other data were incomplete or filled in twice by the same farmer. If data were collected twice for the same farmer, the second data set was deleted from the analysis. Table 2 shows the descriptive statistics of the economic values and Table 3 shows the descriptive statistics of the general information collected from farmers. The mean value of the farmers was, in general, close to the default value. However, there was a large variation between farms. Farmers valued the costs of production losses and culling costs on average lower than the default value, while the costs for veterinary visits, drugs, and labour were valued somewhat higher. On average, the assessed economic losses of mastitis (€78/cow per year) were lower than the default economic losses (€140/cow per year). Between farms there was a lot of variation. The minimum was €17/cow per year and the maximum was €198/cow per year.
The values used for the calculation of the economic losses of mastitis for a farm with 65 cows for the different factors and the mean, minimum (5%), maximum (95%) and sd of parameters on mastitis incidences and production effects from Dutch commercial dairy farms (n=64)

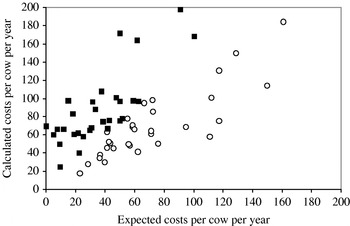
Expected economic losses per cow in relation to the calculated economic losses per cow are plotted in Fig. 2. It can be seen that most farmers underestimated the economic losses of mastitis on their farm. Five farmers estimated their economic losses of mastitis quite precisely. There were 31 farmers who had a deviation between the expected and calculated economic losses of mastitis of not more then 25% and 33 farmers who underestimated the economic losses by >25%. There were no farmers who overestimated the economic losses by >25%.
Expected economic losses per cow per year v. the calculated economic losses per cow per year for the good estimators (○) and the underestimators (■).

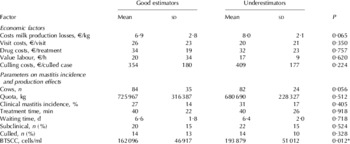
Differences in the costs factors between the under estimators and good estimators are given in Table 4. There was a significant difference between the two groups for the BTSCC (P=0·012). The good estimators had a significantly (P=0·012) lower BTSCC than the underestimators. For costs of milk production losses, the good estimators indicated to have lower costs (€0·069/kg milk) than the underestimators (€0·080/kg milk), but this difference was not significant (P=0·065).
Values for the economic factors and parameters on mastitis incidence and production effects for the group who estimated the economic losses of mastitis well (good estimators) and the group who underestimated the economic losses with >50% (underestimators)

* Statistically significant differences (P<0·05)
Discussion
When advisors are discussing the economic losses of mastitis, they usually work with the average economic losses of clinical mastitis. Many of the current available tools are also based on average economic losses, and only take into account the farmer's registered number of clinical mastitis cases. The tool described in this paper works on farm-specific information to calculate the economic losses of mastitis. However, also in this tool simplifications have been made. Not enough data are available to be able to calculate the economic losses of mastitis, based on the production function with and without the disease (McInerney, Reference McInerney1996), which would be the best way to do it.
The model assumes that a cow gets only one clinical mastitis case, so repeated cases are not taken into account while this can have an effect on the milk production losses (Bar et al. Reference Bar, Gröhn, Bennett, Gonzalez, Hertl, Schulte, Tauer, Welcome and Schukken2007). Moreover, clinical cases followed by a high SCC are only included as a single clinical case. The production losses for clinical cases include the fact that some cases are followed by a high SCC and some are not. Another simplification was made regarding the production losses. The production losses caused by subclinical mastitis are calculated based on the BTSCC. It would be more realistic to base this on the individual SCC of the cows present at a farm, but then farmers have to fill in too many input values. One would need all individual cow data, preferably over time. Only with an automated link to records of the dairy herd information association, would it be practical to include individual SCC.
Although not perfect, the model on which the tool is based does include the most important factors that contribute to the economic losses. We chose deliberately to simplify calculations, so that all farmers and their advisors could make a farm-specific calculation of the costs of mastitis in a reasonable time.
Labour is a difficult factor to take into account. The problem with quantifying labour is in determining an hourly price. In agriculture, opportunity costs are rather small, especially for the few hours working with a mastitis case. However, the work associated with mastitis is regarded as annoying (Kuiper et al. Reference Kuiper, Jansen, Renes, Leeuwis and Van der Zwaag2005). Therefore, in the default calculation labour was included as a cost factor of €18/h.
To lower temporarily the BTSCC, culling of some subclinical cows is a common practice. Under default calculations we assumed no extra culling because of subclinical mastitis. All culling costs are included in the clinical mastitis culling factor.
Finally, the costs of prevention of mastitis are not included. We assume that prevention measures present on a farm will be beneficial overall. The economic losses of the remaining mastitis cases are calculated and that information will be used for further decision making.
To support decisions, insight into what is going on at a particular farm is very important. It is very difficult to make good decisions when this starting point is unclear. In this study, we estimated economic losses based on farmers' assessment of the situation. The sample of 78 farmers, who were users of the tool, is probably not representative for the general population of dairy farmers, but they were farmers already interested in better mastitis control. This could be because they have mastitis problems or because they were very motivated to further improve their situation. The default values used to calculate the average economic losses of mastitis agreed with the averages given by the farmers, but the variation in the different cost factors as given by the farmers was large. As a consequence there was a large variation between farms in the economic losses of mastitis (€17–198/cow per year). It is therefore shown that a farm-specific calculation is necessary to assess the economic losses of mastitis.
By giving the farmers a default value, there is a risk of framing them (Tversky et al. Reference Tversky and Kahneman1986). This will especially occur with questions which are difficult to estimate. The large variation and the high maximum and low minimum values show that farmers who have an opinion on the input factors were not framed and they chose to use their own value. The minimum value given by the farmers for the expected economic losses per cow, costs of production losses, visit costs of the veterinarian, labour costs and culling costs was zero. The value of zero for labour (n=5) can be explained by the fact that some farmers valued their opportunity costs as zero. For the costs of milk production losses, only one farmer valued it as zero. This farmer might exceed his quota. The other farmers valued the costs of production losses between €0·01 (1 farmer) and €0·12/kg milk. Eighteen farmers valued visit costs as zero but all of these farmers indicated they had no veterinary visits. So probably they valued this as zero because they did not have visit costs. For culling costs, six farmers valued this as zero; five of them indicated not to have culled animals because of mastitis. One farmer culled one cow with zero culling costs. One farmer indicated to have zero expected economic losses from mastitis.
Based on the model used in this study, the default economic losses of mastitis are €140/cow per year. The majority of these economic losses are caused by subclinical mastitis (55%). On average the farmers assessed the economic losses of mastitis at €78/cow per year. Also in the farmers' assessment, the majority of the economic losses were caused by production losses of subclinical mastitis (46%). The lower assessment of the economic losses is mainly caused by a lower value of less produced milk (€0·12 v. €0·07/kg milk).
Only a small proportion of farmers (8%) estimated the economic losses of mastitis correctly. The perceptions of these farmers were reliable estimates of reality. Some farmers (20%) overestimated the economic losses but most farmers (72%) underestimated them.
Between the groups there were no significant differences between technical factors such as the number of clinical cases and number of treatments. The only exception was BTSCC, which was significantly higher in the large underestimators compared with the good estimators (P=0·012). This is an indication that the production losses caused by high SCC were difficult to estimate. The losses due to a high BTSCC can be regarded as invisible losses. It is therefore a hidden cost or lost opportunity income. Dependent on the efficacy of a farm, these economic losses may be different between farms. Also for cows with clinical mastitis, milk production losses are a hidden cost because these cows often are higher-producing cows before contracting the disease, and thus they can produce more, even after having contracted the disease, than their healthy, lower-producing herd mates (Gröhn et al. Reference Gröhn, Wilson, Gonzalez, Hertl, Schulte, Bennett and Schukken2004).
The culling costs were not significantly different between the groups but a large variation can be seen. The exact culling costs consist of many factors (expected net present value of returns) (Stott et al. Reference Stott, Jones, Gunn, Chase-Topping, Humphry, Richardson and Logue2002) and are difficult to estimate. An economic factor with an important difference between the underestimators and the good estimators is the cost of production losses. This was not significant (P=0·065) but was still quite large. Farmers who had little deviation between the estimated and calculated economic losses of mastitis indicated to have lower costs of production losses. This might indicate that these farmers have made some ‘unreal’ calculations by using lower costs of production losses. When this is the case and they then used the ‘real’ costs of production losses, they would have underestimated the economic losses as well. The main weakness of this analysis is that if the farmers use unrealistic (high or low) inputs in their calculation, then the differences between their ‘expected’ and ‘calculated’ economic losses can be very low although the ‘real’ difference can be very high.
The adoption rate of advice given to farmers about reducing the incidence of mastitis is currently quite low (Lam et al. Reference Lam, Jansen, Van den Borne and Van Veersen2007). The possibility of calculating the economic losses of mastitis accurately by advisors and accounting for the farmer's perception and assessment of cost factors (Hogeveen & Østeras, Reference Hogeveen and Østerås2005) will improve this adoption rate.
In conclusion, under default Dutch circumstances mastitis costs €140/cow per year. Although the average assessment of the farmers of the different cost factors is close to the default value, there is a large variation and most farmers underestimate the economic losses of mastitis on their farm. To improve the adoption rate of advice and lower the incidence of mastitis, it is important to show the farmers the true economic losses of mastitis on their farm, and the tool described in this paper can play a role in that process.
This study is part of the 5-year mastitis programme of the Dutch Udder Health Centre and was financially supported by the Dutch Dairy Board. The authors would like to thank the farmers for participating in the study.