Implications
Fat quantity and fat quality traits have high heritability estimates and show favorable genetic relationships with each other. Some genetic relationships between fat quality traits and feed efficiency traits are unfavorable, but all of these are weak relationships. These results indicate that it may be convenient to improve fat quality traits genetically and to simultaneously improve the quantity and quality of beef fat. Furthermore, selecting fat quality traits does not significantly affect feed efficiency. We can expect to improve the quality of beef fat without reducing feed utilization efficiency.
Introduction
In the Japanese market, the beef marbling score (BMS), an index of the quantity of fat in beef, is the most important factor determining the market price of a carcass. Therefore, we have been breeding Japanese Black beef cattle with a focus on increasing BMS. Beef content includes lipids and various biomolecules, such as fatty acids. Fatty acid composition is related to the taste and flavor of beef (Westerling and Hedrick, Reference Westerling and Hedrick1979; Melton et al., Reference Melton, Amiri, Davis and Backus1982; Mandell et al., Reference Mandell, Buchanan and Campbell1998). Therefore, the quality of fat as measured by fatty acid composition and fat melting point (MP), which has a high correlation with fatty acid composition, is one of the most important factors affecting beef quality.
Fatty acid composition is influenced by sex (Yoshimura and Namikawa, Reference Yoshimura and Namikawa1985; Zembayashi et al., Reference Zembayashi, Nishimura, Lunt and Smith1995), diet (Melton et al., Reference Melton, Amiri, Davis and Backus1982; Mandell et al., Reference Mandell, Buchanan and Campbell1998) and age (Huerta-Leidenz et al., Reference Huerta-Leidenz, Cross, Savell, Lunt, Baker and Smith1996). Genetic influences, such as breed (Yoshimura and Namikawa, Reference Yoshimura and Namikawa1985; May et al., Reference May, Sturdivant, Lunt, Miller and Smith1993) and sire (Xie et al., Reference Xie, Busboom, Gaskins, Johnson, Reeves, Wright and Cronrath1996), have also been reported, including sire-based differentiation in Japanese Black cattle (Oka et al., Reference Oka, Iwaki, Dohgo, Ohtagaki, Noda, Shiozaki, Endoh and Ozaki2002). However, to genetically improve MP and fatty acid composition, it is necessary to confirm the relationship between these traits and BMS by estimating genetic parameters. Few studies have estimated genetic parameters in Japanese Black cattle. We previously found that it is possible to obtain simultaneous genetic improvements in BMS (quantity) and fatty acid composition (quality; Inoue et al., Reference Inoue, Shoji and Kobayashi2008).
In addition, it is important to improve not only the quantity or quality of beef fat but also the feed efficiency, which affects farmers’ running costs. Among various feed efficiency traits, feed conversion ratio (FCR) and residual feed intake (RFI) are typical. FCR is the ratio of feed intake (FI) to body weight gain (WTG). RFI is the difference between actual FI and the expected feed requirement for maintenance and production (Koch et al., Reference Koch, Swiger, Chambers and Gregory1963). Several studies have examined the relationships of RFI with WTG and carcass traits in Japanese Black cattle (Hoque et al., Reference Hoque, Arthur, Hiramoto and Oikawa2006; Okanishi et al., Reference Okanishi, Shojo, Katsuta, Oyama and Mukai2008; Hoque et al., Reference Hoque, Hosono, Oikawa and Suzuki2009), but none have evaluated the genetic relationships between RFI and fatty acid composition.
Therefore, the objective of this study was to estimate the genetic parameters of MP, fatty acid composition and feed efficiency traits and to evaluate the relationships among these parameters in Japanese Black steers that were fattened for the same period, under the same conditions, and slaughtered at similar ages.
Material and methods
Animals and samples
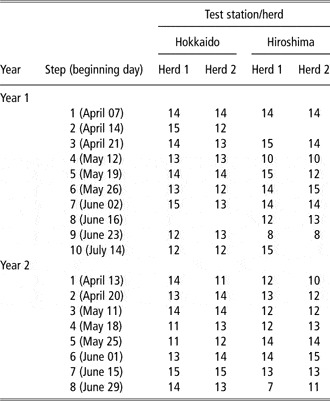
All animals were cared for and slaughtered according to Japanese rules and regulations for animal care. A total of 863 Japanese Black steers derived from 65 sires were progeny tested at stations of the Livestock Improvement Association of Japan Inc. in Hokkaido and Hiroshima prefectures (Table 1). These steers were fattened beginning at an average age of 9.1 months (8.0 to 9.6 months) for 364 days. Body weight (BW) was measured at the beginning and at the end of the test. These steers were born over a 2-year period. Therefore, the progeny tests were carried out in two groups, one per year. In order to arrange the beginning ages, progeny tests were begun with 10 steps in the first year and in eight steps in the second year (Table 1). All steers were fitted with an automatic radio frequency identification transponder (Nedap Cattlecode, Groenlo, The Netherlands) to obtain access to the individual concentrate diet (73.3% total digestible nutrients (TDN), 10.3% digestible crude protein (DCP)) provided by the automatic feeder (Nedap Cattlecode). The amounts of the individual concentrate intake were measured and recorded automatically each day during the test period (364 days). However, roughage (hay; 54.0% TDN, 5.0% DCP) was supplied and recorded by technicians per herd unit.
Numbers of arranged progeny

All steers were slaughtered after fattening. BMS, which is scored from 1 (poor) to 12 (abundant), was evaluated between the 6th and 7th rib in accordance with the Japan Meat Grading Association (JMGA, 1988).
After carcass grading, about 2-mm sliced samples including muscle and adipose tissue were shaved off Musculus trapezius at the 6th and 7th rib of the carcasses of these fattened cattle. Although evaluation of BMS is typically performed at the surface of M. longissimus, we obtained samples from M. trapezius, because M. longissimus is one of the most valuable muscle parts of beef in the Japanese market and we wished to preserve the M. longissimus section. We obtained samples from M. trapezius close to M. longissimus that showed marbling and MPs similar to those of M. longissimus. The total lipids of intramuscular adipose tissue were extracted from these samples according to the method of Folch et al. (Reference Folch, Lees and Stanley1957).
MP determination
MP was determined using method 2 according to The Japanese Pharmacopoeia published by the Ministry of Health, Labour and Welfare (MHLW, 2001). The samples were drawn into capillary tubes to a depth of about 10 mm. The charged tubes were allowed to stand for 24 h at a temperature below 10°C and were then placed in a beaker filled with water. The water temperature was raised by 1°C/min from 10°C. The temperature at which the sample is observed to rise in the capillary tube is identified as the MP.
Fatty acid analysis
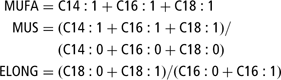
The lipids were methylated by the method of O'Keefe et al. (Reference O'Keefe, Wellington, Mattick and Stouffer1968). Methyl esters were analyzed by gas liquid chromatography (Hitachi G-3000, Tokyo, Japan) using a 3 mm × 1.5 m glass column packed with Unisole-3000 (GL Science, Tokyo, Japan). The gas pressures were 1.0 kg/cm2 for the carrier gas (nitrogen), 1.0 kg/cm2 for hydrogen and 1.1 kg/cm2 for air. Each peak was identified by retention times compared with those of authentic samples. The percentage of major fatty acids was calculated from corresponding peak areas. Total monounsaturated fatty acids (MUFA) were calculated by summing appropriate components. In addition, the ratio of saturated fatty acids to MUFA (MUS) as an index of desaturation, and the ratio of elongation (ELONG) were calculated as follows:
Calculation of FI and feed efficiency traits
Feed intake of TDN (FITDN) and DCP (FIDCP) were estimated as total intakes of concentrate diet and roughage multiplied by their TDN and DCP content, respectively. Roughage intake per steer was calculated as the total intake of roughage per herd unit divided by the number of steers in the unit. Feed conversion ratios of TDN (FCRTDN) and DCP (FCRDCP) are expressed as the values of FITDN and FIDCP per unit of WTG during the testing period, respectively. RFI of TDN (RFITDN) and DCP (RFIDCP) were derived as follows:

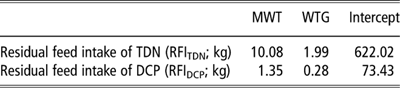
where, MWT is the metabolic weight that is calculated as the mean BW during the test, raised to the 0.75 power (mean BW0.75), b 1 and b 2 are partial regression coefficients of MWT and WTG, respectively. Coefficients and intercepts of TDN and DCP obtained by multiple regression analysis are presented in Table 2.
Partial regression coefficients and intercepts of multiple regressions used in calculating residual feed intakes
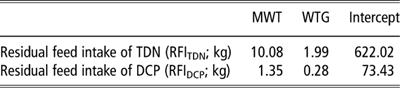
MWT = metabolic weight; WTG = weight gain; TDN = total digestible nutrients; RFI = residual feed intake; DCP = digestible crude protein.
Statistical analysis
Genetic parameters were estimated using the following univariate animal model containing fixed effects of tested year–step–station–herd, prefecture of birth and regressions for beginning age. In addition, the pedigree information for 4841 animals was used.

where, Yijk is the observation of traits, CKGPi is the fixed effect of i-th tested year–step–station–herd, Lj is the fixed effect of the j-th prefecture of birth of tested steers, a1 is the linear regression coefficient for the beginning age, tijk is the age of the animal at the beginning of the test, uijk is the random additive genetic effect of the ijk-th animal and eijk is the random residual. The program AIREMLF90 (Misztal et al., Reference Misztal, Tsuruta, Strabel, Auvray, Druet and Lee2002) was used for this analysis. Bivariate animal models with the same effects were used for estimations of phenotypic and genetic correlations.
Results and discussion
Phenotypic measurements
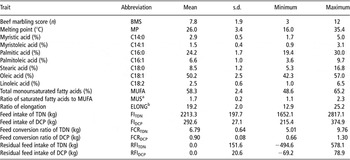
The results of the phenotypic measurements are shown in Table 3. The average values for BMS, MP, MUFA, FCRTDN and FCRDCP were found to be 7.8, 26.0, 58.3, 6.79 and 0.90, respectively.
Descriptive statistics of fatness traits and feed efficiency traits

TDN = total digestible nutrients; DCP = digestible crude protein.
aMUS = total MUFA (sum of C14:1, C16:1 and C18:1) per total saturated fatty acids (sum of C14:0, C16:0 and C18:0).
bELONG = sum of C18:0 and C18:1 per sum of C16:0 and C16:1.
The BMS value determined in this study was found to be higher than the value (4.0) reported by Oka et al. (Reference Oka, Iwaki, Dohgo, Ohtagaki, Noda, Shiozaki, Endoh and Ozaki2002), using Japanese Black steers fattened in a similar fattening test. However, the present value is similar to the value of 7.1, which was reported by Inoue et al. (Reference Inoue, Shoji and Kobayashi2008), using steers and heifers. In addition, the average values for fatty acid composition and MUFA were found to be similar to those of intramuscular adipose tissue of M. longissimus reported by Oka et al. (Reference Oka, Iwaki, Dohgo, Ohtagaki, Noda, Shiozaki, Endoh and Ozaki2002), although the percentages of saturated fatty acids in their report were slightly higher and those of unsaturated fatty acids and MUFA were slightly lower than the percentages determined in this study.
The MP was found to be slightly higher than the value of 22.8 reported by Inoue et al. (Reference Inoue, Shoji and Kobayashi2008) but much lower than the value of 39.1 reported by Pitchford et al. (Reference Pitchford, Deland, Siebert, Malau-Aduli and Bottema2002). MP has a high correlation with fatty acid composition and there are reports that fatty acid composition is influenced by sex and age. These studies have confirmed that the fat of heifers tends to be more unsaturated than the fat of steers (Yoshimura and Namikawa, Reference Yoshimura and Namikawa1985; Zembayashi et al., Reference Zembayashi, Nishimura, Lunt and Smith1995) and aging increases MUFA (Huerta-Leidenz et al., Reference Huerta-Leidenz, Cross, Savell, Lunt, Baker and Smith1996). Furthermore, effects of breed differences are also reported; purebred Wagyu cattle or the other breeds derived from Wagyu generally tend to have higher proportions of unsaturated fatty acids than other breeds (Yoshimura and Namikawa, Reference Yoshimura and Namikawa1985; May et al., Reference May, Sturdivant, Lunt, Miller and Smith1993). Inoue et al. (Reference Inoue, Shoji and Kobayashi2008) used field data from heifers and steers with an average slaughter age of 31.6 months. However, Pitchford et al. (Reference Pitchford, Deland, Siebert, Malau-Aduli and Bottema2002) analyzed data from heifers and steers of Hereford cows mated to sires from seven different breeds, including Jersey, Wagyu, Angus, Hereford, South Devon, Limousin and Belgian Blue. Thus, differences among MP values would be expected.
The FCRTDN and FCRDCP values were found to be 6.79 and 0.90, respectively and these values are almost the same as the national averages based on the progeny tests of Japanese Black in 2007 (Statistics in Japan).
Heritability
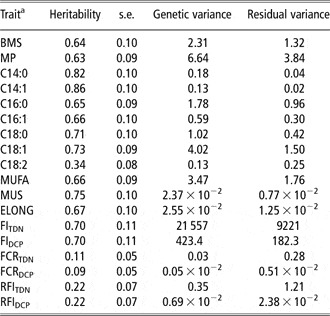
Heritability estimates of BMS and MP were found to be high (0.64 and 0.63, respectively), and those of each fatty acid, MUFA, MUS and ELONG were also high (0.65 to 0.86, 0.66, 0.75 and 0.67, respectively) except for C18:2 (0.34) as presented in Table 4. However, the values of FI and feed efficiency traits were low to high (0.09 to 0.70).
Estimated heritability, genetic variances and residual variances

TDN = total digestible nutrients; DCP = digestible crude protein.
aSee Table 3 for abbreviations; MUS = total MUFA (sum of C14:1, C16:1 and C18:1) per total saturated fatty acids (sum of C14:0, C16:0 and C18:0); ELONG = (sum of C18:0 and C18:1) per (sum of C16:0 and C16:1).
The high estimates of fatness traits showed that characteristics of station progeny tests, or heritabilities estimated using the data obtained from station tests are generally higher than the field data. Failure to synthesize only C18:2 in vivo may cause lower heritability of C18:2 than the heritability of the other fatty acids. In addition, these estimated results may provide evidence of the propriety of the sampling data, the analysis method and the model. Heritabilities of MP and fatty acids in this study were found to be high compared not only with the other breeds (MP and fatty acids were 0.28 and 0.14 to 0.21) estimated by Pitchford et al. (Reference Pitchford, Deland, Siebert, Malau-Aduli and Bottema2002) but also within the same breeds (MP and fatty acids were 0.41 and 0.38 to 0.73) estimated by Inoue et al. (Reference Inoue, Shoji and Kobayashi2008). The difference in the same breed might be caused by variations in characteristics between data from station progeny tests and from field progeny. However, the estimates of Japanese Black were higher than those of the other breeds. Therefore, it is likely that the difference between the breeds may be caused by differences in enzyme activities related to desaturation. Abe et al. (Reference Abe, Saburi, Hasebe, Nakagawa, Misumi, Nade, Nakajima, Shoji, Kobayashi and Kobayashi2009) detected a difference in the allele frequency of fatty acid synthase (FASN), which affects the proportions of fatty acid composition among different breeds. The estimated high heritabilities for MP, each fatty acid, MUFA, MUS and ELONG suggested that there are advantages in genetically improving the ratio of unsaturated fatty acids.
Heritability estimates of FI and feed efficiency traits ranged from low to high. The estimates of FIs were found to be high (0.70) and similar to fatness traits but those of FCRs and RFIs were low (0.09 to 0.22) in this study. Hoque et al. (Reference Hoque, Arthur, Hiramoto and Oikawa2006) reported that heritability estimates of FCR and phenotypic RFI in the study of individual performance tests (Wagyu Registry Association (WRA), 2000) on Japanese Black bulls were 0.15 and 0.24, respectively. These estimates are similar to the FCR and RFI values determined in this study. However, Hoque et al. (Reference Hoque, Hosono, Oikawa and Suzuki2009) also reported slightly higher estimates of the two traits (FCR and RFI were 0.38 and 0.49) and of FITDN (0.35) and FCRTDN (0.46) in another Japanese Black population. Okanishi et al. (Reference Okanishi, Shojo, Katsuta, Oyama and Mukai2008) reported heritability estimates for FIs of TDN and DCP were 0.27 and 0.25, FCRs of those were 0.14 and 0.03, and RFIs of those were 0.10 and 0.12, respectively, in performance tests on Japanese Black bulls. Our results were similar or slightly higher than their results except for FIs.
Relationships between fatness traits
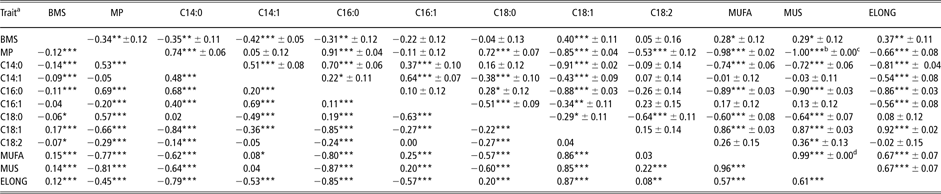
The phenotypic correlations between BMS, which is an index of the amount of fat within beef, and each fatty acid were found to be low and the range of these was about ±0.15 between C14:0 and C18:1 (Table 5). Although the genetic correlations of these values were higher overall than the phenotypic values, these values were −0.42 (C14:1) to 0.40 (C18:1). Standard error estimates of the genetic correlations were relatively small and most of the genetic correlations were statistically different from zero. The negative genetic correlation between BMS and MP (−0.34), and the positive correlation of BMS with C18:1 (0.40), MUFA (0.28), MUS (0.29) and ELONG (0.37) were different from zero and suggest that these relationships are favorable for enhancing desaturation and elongation, and that it is possible to improve both the quantity and quality of fat in beef. However, we previously estimated that BMS shows low genetic correlations with MP (0.08), C16:0 (0.15) and C18:1 (−0.09). This study employed 5314 Japanese Black steers and heifers from field data of different populations. The main cause of these differences between this and the earlier studies might be the differences of age between the two data populations. It is known that the degree of fat deposition on the intramuscular sections differs according to age in lines of Japanese Black cattle. In any case, these relationships are not unfavorable for improving both quantity and quality of beef fat. Additional research will be required to confirm the relationships between BMS and fatty acid composition.
Estimated genetic (above diagonal) and phenotypic (below diagonal) correlations (±s.e.) between fatness traits
aSee Table 3 for abbreviations; MUS = total MUFA (sum of C14:1, C16:1 and C18:1) per total saturated fatty acids (sum of C14:0, C16:0 and C18:0); ELONG = (sum of C18:0 and C18:1) per (sum of C16:0 and C16:1).
bThe precise estimate was −0.996.
c,dThe precise s.e. of MUS with MP and MUFA were 0.09 × 10⁻² and 0.3 × 10⁻², respectively.
*P < 0.05; **P < 0.01; ***P < 0.001.
The positive phenotypic and genetic correlations between MP and each saturated fatty acid were found to be between 0.53 to 0.69 for phenotypic parameters and 0.72 to 0.91 for genetic parameters. The negative correlations between MP and each unsaturated fatty acid were −0.05 to −0.66 for phenotypic parameters and −0.11 to −0.85 for genetic parameters except for C14:1 (0.05 for the genetic correlation), although the genetic estimates of MP with C14:1 and C16:1 were not surely different from zero or identical with zero. Furthermore, the genetic correlations of MP with MUFA, MUS and ELONG were also highly negative (−0.98, −1.00 (−0.996) and −0.66, respectively). These results follow a trend similar to our previous results (Inoue et al., Reference Inoue, Shoji and Kobayashi2008) and show that a higher percentage of saturated fatty acid raises the MP and a higher percentage of unsaturated fatty acids lowers the MP.
It is known that C16:0 is converted to C16:1 via stearoyl-CoA-desaturase (SCD) and C18:0 via fatty acid elongase. The latter is also converted to C18:1 by SCD in vivo. Thus, it is considered that the equilibrium between C16:0 and C16:1, and between C18:0 and C18:1 is maintained. Therefore, the phenotypic and genetic correlations between these fatty acids might be low. The phenotypic and genetic correlations between C16:1 and C18:0 were moderately negative (−0.63 and −0.51, respectively). This relationship between these fatty acids seems to be contrary because both are synthesized from C16:0. There are several reports, including our previous report, which indicate that the relationship between the percentages of C16:1 and C18:0 might produce a negative correlation where, as the percentage of C16:1 increases, that of C18:0 decreases, and vice versa. Our present results are in agreement with these reports. There is a high negative genetic correlation between C16:0 and C18:1. Although C18:1 is synthesized from C16:0 via C18:0 in vivo, the relationship might be an inverse relationship because C16:0 and C18:1 represent the largest proportions of unsaturated fatty acids and saturated fatty acids, respectively, and C18:1 is the last species of unsaturated fatty acid synthesized from C16:0. The correlation between C14:0 and C18:1 was also highly negative. It has been reported that mutations of the FASN gene have opposite effects on the percentages of C14:0 and C18:1 (Morris et al., Reference Morris, Cullen, Glass, Hyndman, Manley, Hickey, McEwan, Pitchford, Bottema and Lee2007; Abe et al., Reference Abe, Saburi, Hasebe, Nakagawa, Misumi, Nade, Nakajima, Shoji, Kobayashi and Kobayashi2009). The results of this study are in agreement with these reports.
A strong negative genetic correlation was identified between C16:0, a major saturated fatty acid and C18:1, a major unsaturated fatty acid. Moreover, the MP, which contributes to the softness and flavor of fat, was found to have strong negative (favorable) genetic correlations with C18:1, MUFA and MUS, and a strong positive (favorable) genetic correlation with C16:0. These results followed a similar trend as the results of our previous report. These results suggest that it is possible to improve each trait indirectly by improving the ratio of unsaturated fatty acids or improving the MP. In particular, the genetic correlations between MP and MUS and between MP and MUFA were very strong (−1.00 (−0.996) and −0.98, respectively). Thus, MP and MUS as well as MP and MUFA appear to be almost same traits for selection. Determination of these traits requires much time and effort and analysis of fatty acid composition requires an analytical laboratory with gas/liquid chromatography. Furthermore, the meat becomes damaged when the samples are taken. Recent reports have described new ways to measure the MP or MUS of beef quickly and without damage to the meat. Irie et al. (Reference Irie, Oka and Iwaki2003) have developed a hand-held, portable device capable of measuring MUFA content and saturated fatty acid content using spectroscopy with a fiber-optic probe and near-infrared light. This report identified correlations of the reflectance of the intermuscular fat of beef with MUFA content and saturated fatty acid of −0.69 and 0.72, respectively. This fiber optic probe allows results to be obtained within seconds. Maehara et al. (Reference Maehara, Murasawa, Nakahashi, Hidaka, Kato and Kuchida2008) are engaged in development of methods for measuring the degree of unsaturation of fatty acids in beef using imaging analysis. This work involves research into the relationships of the traits measured by the image analysis device including the overall coarseness of the marbling and average luminance of marbling with fatty acid composition and MUFA. This image analysis technique is expected to enable rapid estimation of MUFA. We are hopeful that these new techniques will improve rapidly and allow us to improve the quality of beef.
Relationships between fatness traits and feed efficiency traits
Genetic correlations and standard error estimates between fatness traits and feed efficiency traits are shown in Table 6. The range of correlations of fatness traits according to FCRTDN and FCRDCP were found between −0.38 (ELONG and FCRDCP) and 0.43 (C14:1 and FCRDCP). Their standard error estimates were rather large (0.19 to 0.31) and the genetic correlations seemed to be not statistically different from zero. Likewise, the range of correlations of fatness traits according to RFITDN and RFIDCP were −0.22 (C16:0) to 0.51 (BMS), respectively, although the genetic correlations were not surely considered different from zero or identical with zero except for those between RFIs and BMS. The correlation estimates for feed efficiency traits of DCP were quite similar to those of TDN. Genetic correlations of BMS with FCRs and RFIs were all positive (unfavorable; 0.21 to 0.51), in particular, the correlations with RFIs were high. These results suggest that animals with high values of BMS would be expected to have a low feed efficiency.
Estimated genetic correlations (±s.e.) between fatness traits and feed efficiency traits

TDN = total digestible nutrients; DCP = digestible crude protein.
aSee Table 3 for abbreviations; MUS = total MUFA (sum of C14:1, C16:1 and C18:1) per total saturated fatty acids (sum of C14:0, C16:0 and C18:0); ELONG = (sum of C18:0 and C18:1) per (sum of C16:0 and C16:1).
**P < 0.01.
Robinson and Oddy (Reference Robinson and Oddy2004) reported positive genetic correlations of intramuscular fat with FCR and RFI, and there was a higher correlation with RFI (0.22 ± 0.17) than with FCR (0.08 ± 0.28) in their study. These estimates represent trends similar to those identified in our study results between BMS and FCRs or RFIs, although degrees of estimation were different. Nkrumah et al. (Reference Nkrumah, Basarab, Wang, Li, Price, Okine, Crews and Moore2007) also reported a similar positive genetic correlation between the carcass marbling score, which was evaluated according to the Canadian beef carcass grading system and RFI (0.28 ± 0.38). Both groups estimated genetic parameters using European breeds and/or tropically adapted breeds such as Brahman and Belmont Red. Robinson and Oddy (Reference Robinson and Oddy2004) studied tropical breeds, such as Angus and Hereford, whereas Nkrumah et al. (Reference Nkrumah, Basarab, Wang, Li, Price, Okine, Crews and Moore2007) investigated crossbreds of Angus and Charolais, among others. The different degrees of correlations between our results and the previous reports may be due to differences in genetic backgrounds of the cattle and environmental effects. In the European breed, however, Bouquet et al. (Reference Bouquet, Fouilloux, Renand and Phocas2010) estimated genetic correlations of carcass fatness score (CF) with FCR of −0.41 ± 0.17 and −0.03 ± 0.18, and with RFI of 0.00 ± 0.20 and 0.07 ± 0.14 in Blonde d'Aquitaine and Limousin breeds, respectively. Likewise, in the same Japanese Black breed, Hoque et al. (Reference Hoque, Hosono, Oikawa and Suzuki2009) reported genetic correlations of BMS with FCRTDN and RFI of −0.62 ± 0.09 and −0.59 ± 0.08, respectively. These results are in opposition to the results of this study. In the results of Robinson and Oddy (Reference Robinson and Oddy2004) and our study, however, standard errors of genetic correlations between fatness and FCR were large and the reliability of the estimates seems to be low. Therefore, the genetic relationship of those appears to be not statistically different from zero or even negative as reported by Hoque et al. (Reference Hoque, Hosono, Oikawa and Suzuki2009) and Bouquet et al. (Reference Bouquet, Fouilloux, Renand and Phocas2010). However, the relationship between fatness and RFI was surely positive in the results of Robinson and Oddy (Reference Robinson and Oddy2004) and our study using fatness and RFI of progeny or feedlot animals, whereas the surely negative relationship was identified by Hoque et al. (Reference Hoque, Hosono, Oikawa and Suzuki2009) and no relationship was showed by Bouquet et al. (Reference Bouquet, Fouilloux, Renand and Phocas2010) using RFI of young bulls and fatness of their progeny. These results suggest that the difference of animals, whose RFI is measured, may affect the genetic relationship between fatness and RFI. In Japanese Black breed, to be concrete, the estimates by Hoque et al. (Reference Hoque, Hosono, Oikawa and Suzuki2009) were derived from a study on the relationships between feed efficiency traits, which were the results of individual performance tests (WRA, 2000) on candidate young bulls before their selection, and the BMS of the field progeny of the selected bulls. However, we studied the relationships between feed efficiency traits and BMS of the progeny of the selected bulls in the progeny test. Therefore, the populations of bulls and the effects of selection may be the cause of the differences between the results. The age of animals may also be the cause of the differences of correlations. Arthur et al. (Reference Arthur, Renand and Krauss2001b) reported that the genetic correlation between post-weaning and yearling measures of RFI was 0.75 in bulls. The RFI from animals in the study of Hoque et al. (Reference Hoque, Hosono, Oikawa and Suzuki2009) were obtained from young bulls with ages of about 7 to 11 months, whereas the RFI from animals in our study were obtained from progeny with ages between 9.1 months and 21.1 months.
Stronger genetic correlations were generally estimated between fatty acids and FCRs rather than between fatty acids and RFIs, although standard error estimates were large, in contrast with the relationships of FCRs and RFIs with BMS (Table 6). This may be related to the fact that BMS represents the fat amount, whereas the fatty acid composition represents the ratio of fatty acids within a given portion of fat, and RFI represents the residual energy intake over the energy required for maintenance and production of the animal. In short, RFI rather than FCR has less of an effect on the fatty acid composition. Genetic correlations of C18:1, MUFA, MUS and ELONG with RFIs were positive (unfavorable) but all low (0.06 to 0.17), whereas those with FCRs were all negative (favorable; −0.38 to −0.10). These estimates were not surely different from zero or identical with zero. Similarly, genetic correlations of MP with RFIs were found to be unfavorable, although the sign has changed. These were low values (−0.20), whereas the correlations of MP with FCRs were all favorable (0.11 and 0.13), although not statistically different from zero. According to this result, FCR appears to be more appropriate for the selection traits than RFI. However, it is known that ratio traits such as FCR may be problematic for selection. In a study comparing the selection responses of direct selection on a ratio trait consisting of two components to a linear index trait derived from the same components, Gunsett (Reference Gunsett1984) concluded that the use of a linear index increases selection responses compared to direct selection. Archer et al. (Reference Archer, Richardson, Herd and Arthur1999) and Arthur et al. (Reference Arthur, Archer, Johnston, Herd, Richardson and Parnell2001a) pointed out that selection to improve FCR does not always lead to improvement of feed efficiency in future generations since selection against FCR can also produce larger animals, which need more energy for maintenance even if they have superior WTG. RFI can represent feed efficiency without these problems. Besides, Okanishi et al. (Reference Okanishi, Shojo, Katsuta, Oyama and Mukai2008) reported that selection based on RFI values, particularly RFI of TDN, can produce favorable correlated responses in WTG and all feed intakes without changing body size. Therefore, we should use RFI rather than FCR as a selection index for feed efficiency.
Although fatty acid composition is also a ratio trait, in the case of fatty acid composition, we can avoid these kinds of selection problems by choosing the amount of fat content (BMS or intramuscular fat content) as a selection trait. In addition, we can use MP, (which is expressed as a linear trait), for selection instead of fatty acid composition since the relationships between MP and MUFA and between MP and MUS are similar and appear to represent the same traits (Table 5).
Recently, there have been several studies and breeding schemes in Japan that focused on MUFA, which enhance the taste and flavor of beef. However, when we conduct selection according to new traits such as MUFA or MP, it is important that the relationships between these new traits and the other conventional traits be well defined. In order to prevent decreasing the performance of the other conventional traits and reducing the efficiency of selection, we need to research the relationships before using the new traits for selection. The present results suggest that selecting MP or fatty acid traits does not significantly affect feed efficiency, although the standard error estimates in this study were rather high. Furthermore, the relationships between MP or fatty acid traits and feed efficiency were found to be relatively lower than the effect of increasing BMS on feed efficiency. The high standard errors generally reflect the relatively small data set. Although we still need to examine the unfavorable relationships, we can expect that fat quality should improve without loss of feed efficiency.