





Introduction
Infections with the intestinal nematodes, Ascaris lumbricoides and Trichuris trichiura, are considered among the world’s most concerning neglected diseases by the World Health Organisation (World Health Organisation, 2023). These parasites are reported to affect up to 1.5 billion individuals, mostly in low- and middle-income countries with some very gradual reductions in disease burden over the past 40 years (Pullan et al., Reference Pullan, Smith, Jasrasaria and Brooker2014; Chen et al., Reference Chen, Gong, Chen, Li and Zhou2024). These nematode parasites cause persistent infections and, although rarely life threatening, they contribute to substantial morbidity. Infection is associated with anaemia and malnutrition as well as physical and cogitative developmental effects. Disability adjusted life years (DALYs) metrics have been calculated to represent losses amounting to 347.5 thousand DALYs for A. lumbricoides and 193.9 thousand DALYs for T. trichiura in 2021 (Chen et al., Reference Chen, Gong, Chen, Li and Zhou2024), but the overall burden of these infections is difficult to estimate.
Although A. lumbricoides and T. trichiura are no longer endemic in Europe, the environmentally resilient eggs of both parasites are frequently detected in archaeological contexts that contain human faecal material (Bouchet et al., Reference Bouchet, Harter and Le Bailly2003; Gonçalves et al., Reference Gonçalves, Araújo and Ferreira2003; Reinhard et al., Reference Reinhard, Ferreira, Bouchet, Sianto, Dutra, Iniguez, Leles, Le Bailly, Fugassa, Pucu and Araújo2013; Araújo et al., Reference Araújo, Reinhard, Ferreira, De Baets and Littlewood2015; Søe et al., Reference Søe, Nejsum, Fredensborg and Kapel2015; Flammer and Smith, Reference Flammer and Smith2020; Le Bailly et al., Reference Le Bailly, Maicher, Roche and Dufour2021). The eggs of T. trichiura and Ascaris spp. remain identifiable by morphology for thousands of years (Aspöck et al., Reference Aspöck, Auer and Picher1996; Shin et al., Reference Shin, Lim, Choi, Oh, Kim, Lee, Kim, Shin, Bok, Chai and Seo2009; Ledger et al., Reference Ledger, Grimshaw, Fairey, Whelton, Bull, Ballantyne, Knight and Mitchell2019), and their presence indicates infection of a host with adult parasites. The species of Ascaris found in human faecal material is most likely A. lumbricoides. However, it is not possible to microscopically differentiate the eggs from A. suum, which is mostly found in pigs but can infect humans; hence, throughout this manuscript, when referring to eggs found in human derived samples, we use the term Ascaris spp. The archaeological contexts in which eggs are found include communal deposits (e.g. latrines or other waste deposits) as well as samples that can be attributed to individual cases of infection (e.g. soil from the sacral region of individual burials). Each type of context can contribute differently to our interpretation of humans’ past relationship with intestinal helminths. Communal deposits often contain large numbers of helminth eggs and a greater diversity of parasites (Flammer et al., Reference Flammer, Ryan, Preston, Warren, Přichystalová, Weiss, Palmowski, Boschert, Fellgiebel, Jasch-boley, Kairies, Rümmele, Rieger, Schmid, Reeves, Nicholson, Loe, Guy, Waldron, Macháček, Wahl, Pollard, Larson and Smith2020). Those from the remains of single individuals contain relatively few eggs but permit estimation of the frequency of infection among remains at that site.
Observed soil-transmitted helminth (STH) infection frequencies based upon the number of individual skeletons with detectable parasite eggs in soil taken from the sacral region provide information on the living conditions and health status of past populations. For example, the rates of Ascaris spp. and T. trichiura eggs within sacral samples provide a metric that relates to general health, hygiene and the effectiveness of sanitation. These data also provide a historical foundation for understanding factors that affect the prevalence of these infections in modern contexts.
Evidence of historical parasites can also be combined with other information sources to help us understand the lifestyles of historical communities. Recent work focusing on Neolithic communities living near lakes in Central Europe shows the potential for combined analysis of climatic data and parasite data to characterize whether a particular community relied more on farming or on fishing for survival (Maicher and Le Bailly, Reference Maicher and Le Bailly2024). Greater integration between archaeoparasitological data and climatic and other data sources will lead to further insights.
There have been 2 previous large-scale historical analyses of Ascaris spp. and T. trichiura across Europe. The first analysed 589 sacral samples from 7 medieval sites in the United Kingdom, Germany and the Czech Republic (Flammer et al., Reference Flammer, Ryan, Preston, Warren, Přichystalová, Weiss, Palmowski, Boschert, Fellgiebel, Jasch-boley, Kairies, Rümmele, Rieger, Schmid, Reeves, Nicholson, Loe, Guy, Waldron, Macháček, Wahl, Pollard, Larson and Smith2020) and demonstrated that the observed frequency of intestinal nematodes was similar to that seen in modern endemic contexts. The second study (Ryan et al., Reference Ryan, Flammer, Nicholson, Loe, Reeves, Allison, Guy, Doriga, Waldron, Walker, Kirchhelle, Larson and Smith2022) examined the observed frequency of Ascaris spp. and T. trichiura in 464 burials from 17 sites in England that dated from pre 1st century BCE up to the industrial period. Ryan et al. observed particularly high rates of infection with Ascaris spp. in Roman and High Medieval/Late Medieval periods, and noted that most T. trichiura infections in England were detected in medieval periods (Ryan et al., Reference Ryan, Flammer, Nicholson, Loe, Reeves, Allison, Guy, Doriga, Waldron, Walker, Kirchhelle, Larson and Smith2022).
Herein we build upon these and other studies, examining the observed frequency of Ascaris spp. and T. trichiura infections across 54 European sites dating from Prehistoric to Industrial periods. This wide-scale analysis offers the opportunity to test whether the patterns observed by Ryan et al. in England were also reflected in a broader context or whether they were affected by factors that varied across the European continent. One of the arguments posed in Ryan et al. (Reference Ryan, Flammer, Nicholson, Loe, Reeves, Allison, Guy, Doriga, Waldron, Walker, Kirchhelle, Larson and Smith2022) to explain the patterns of T. trichiura infections was that these parasites have a slightly greater dependence on higher temperatures to embryonate compared with Ascaris spp. (Brooker et al., Reference Brooker, Clements, Bundy, De Baets and Littlewood2006). The current analysis could directly test this hypothesis since the sample sites were from a wider geographical range which encompassed a range of environmental conditions. We also considered other factors that might have affected rates of infection: aridity and population density.
Materials and methods
Studies of Ascaris spp. and T. trichiura in individual human remains
We searched the literature database Scopus (and the reference lists of relevant studies we found) for archaeoparasitological reports of Ascaris spp. and T. trichiura in sets of individual human remains. We included any study which used microscopy to detect Ascaris spp., and T. trichiura in more than 1 individual in a European site. Some of these studies reported results from single individuals from specific time periods as part of the broader study, and we included those singletons in our dataset (Table 1). However, we excluded studies that reported the presence of parasites in just one set of remains at a time (e.g. Aspöck et al., Reference Aspöck, Auer and Picher1996). We considered that including such studies may have inflated overall estimates of observed parasite frequency (a failure to find parasites in an individual set of remains may have been less likely to be reported).
Archaeological sites in Europe where the presence of Ascaris spp. and T. trichiura has been examined in human remains

Table 1 Long description
Rows list archaeological sites with an estimated time period, era, counts positive for Ascaris spp. and T. trichiura, sample size, latitude, longitude, and source. Sample sizes range from 1 to 204, with the largest at Ellwangen, 204, Breclav Pohansko, 97, Rottenburg, 91, and Canterbury Peugeot, 80. Prehistoric sites include Cyprus Shillourokambos with 3 Ascaris spp. positive and 3 T. trichiura positive out of 4, Cyprus Khirokitia with 1 and 1 out of 7, and several sites with zero positives, while Kea Kephala has 0 Ascaris spp. positive and 1 T. trichiura positive out of 9. Ancient era sites include Canterbury Peugeot with 28 Ascaris spp. positive and 0 T. trichiura positive out of 80, Bleadon Wentwood Roman with 6 and 0 out of 9, Vagnari with 0 and 1 out of 31, and Florence with 5 Ascaris spp. positive and 0 T. trichiura positive out of 18. Early Middle Ages sites include Breclav Pohansko with 34 Ascaris spp. positive and 18 T. trichiura positive out of 97, Rottenburg with 20 and 4 out of 91, Worcester with 6 and 1 out of 65, and Nivelles with 2 and 3 out of 3. Late Middle Ages sites include Ellwangen with 45 Ascaris spp. positive and 14 T. trichiura positive out of 204, Southampton with 20 and 0 out of 52, York All Saints with 13 and 3 out of 35, and Ghent with 0 and 2 out of 6. Industrial era sites include Oxford with 0 and 0 out of 56, London St James with 8 and 0 out of 30, and Birmingham with 0 and 1 out of 30.
a This sample is 4 individual burials at Shillourokambos mentioned in the paper, including the burial of a human with a domestic cat that is only briefly discussed in this paper, but noted not to have parasites, and excluding a group burial.
b 6 of these 7 are noted to be from children who died during the perinatal period, and the sample positive for Ascaris spp. and T. trichiura was the only adult; in the other Cypriot site (Shillouroukambos), a child who seemed to have died extremely soon after birth was also apparently positive for both parasites – we have included this because it meets our inclusion criteria, but we acknowledge this may not reflect a true infection.
c The Poundbury sample comes from samples from human remains interred within lead coffins, but it is unclear if the samples were specifically gathered from the pelvic region of the remains.
d The Florence sample is from an emergency burial ground. Initial microscopy analysis suggested 5/18 samples with Ascarid parasites, but we note that subsequent aDNA analysis of 5 (non-randomly chosen) samples revealed the presence of Ascaris spp. in all 5 samples and T. trichiura in 4 of the 5. We used the microscopy evidence in our analysis, for consistency with the rest of the dataset.
e For the Selvicciola sample, we are only counting the 13 individuals that the authors believe to have been buried during the Longobard period (not the late Antique period discussed for that site in the paper).
f The Nivelles sample comes from coprolites from within the skeletal remains.
g Overall in our dataset we classified ‘Early Middle Ages’ as between 500 and 1100 CE and ‘Late Middle Ages’ as 1100–1700 CE. Some sites span both eras, and we placed them in the era where we considered the majority of the time period of the site to fall. Rottenburg could be argued to fall in either era since the midpoint of the estimated time of the site is exactly 1100; we have chosen to place it within the early Middle Ages since if the midpoint of the dates of the graves is 1100, individuals may be slightly more likely to have lived before 1100.
h The León sample comes from spontaneously mummified remains.
We define a site as a specific combination of time period and location. For each site within each study, we recorded the overall number of individual human remains, the numbers positive for Ascaris spp. or T. trichiura, the estimated dates of the remains, and the latitude and longitude. If latitude and longitude were not directly recorded in the publication, we extracted the latitude and longitude of the named location using Google Maps.
Additional site metadata
Human population density data were sourced from a 2024 HYDE 3.3 global model product by Utrecht University (Klein Goldewijk et al., Reference Klein Goldewijk, Beusen, Doelman and Stehfest2017). This provided estimates of the population density per 5 arcminute by 5 arcminute grid resolution, for any given latitude and longitude, at 100 year intervals CE and at 1000 year intervals BCE. We took a single estimate of population density for each of our sites, for the time that corresponded as closely as possible to the midpoint of the time period covered by the site (see Supplementary Table S1). Temperature data were obtained from a model of globally resolved surface temperatures (Osman et al., Reference Osman, Tierney, Zhu, Tardif, Hakim, King and Poulsen2021), which provided estimates of annual average temperatures at 200-year intervals. We similarly took a single temperature estimate for each site, corresponding as closely as possible to the midpoint of the time period covered by the site (Supplementary Table S1). Finally, we obtained estimates of an aridity index for each location from the Global Aridity Index and Potential Evapotranspiration database (Zomer et al., Reference Zomer, Xu and Trabucco2022).
Data processing and statistical analysis
To extract data from spatial raster files we used the TidyTerra package in R (https://cran.r-project.org/web/packages/tidyterra/index.html). For plotting we used the ggplot2 package in R (https://cran.r-project.org/web/packages/ggplot2/index.html). We used the Wilson method (implemented in R package DescTools, https://cran.r-project.org/web/packages/DescTools/index.html) to calculate confidence intervals for proportions. We used Analysis of Variance (ANOVA) to test for differences in worm prevalence between eras, and to test whether historical population density and environmental conditions could explain a significant proportion of the variation in worm prevalence. For our ANOVA analysis we considered only sites where N ≥ 5. This threshold was selected as a trade-off between reliability of the estimate of infection frequency (which increases with greater sample size), against the number of sites available to analyse (which affects the power of any downstream analysis). We arcsine square root transformed the proportions of individuals with detectable infection (a standard transformation to normalize proportional data prior to ANOVA), and used Tukey post hoc comparison tests. We used the lm function in R to perform ANOVA and the emmeans package (https://cran.r-project.org/web/packages/emmeans/index.html) to carry out post hoc tests. We also used paired T tests to test for per-site differences in the observed frequency of Ascaris spp. and T. trichiura.
In addition to the main analyses performed on sites where N ≥ 5, we also present a visualization of all sites where N ≥ 3 (to illustrate the full extent of the data), and analyses of sites where N ≥ 10, to illustrate the effect of using a more stringent threshold for infection frequency estimation.
Results
This study is a geospatial analysis of data from 17 published studies which allowed us to calculate the observed frequency of Ascaris spp. and/or T. trichiura at specific archaeological sites, based upon microscopic detection of parasite eggs in individual remains (Table 1). Data were extracted from 54 sites representing 1188 individuals from Prehistoric to Industrial periods in sites ranging from Southern Europe (Spain, Greece and Italy) to the United Kingdom (Figure 1). Although there is an imbalance in data availability from different regions, the geographical range of sites reporting the numbers of infected individuals is large, which affords an opportunity to examine broad scale influences on the historical distribution of these intestinal nematodes.
Skeletal sampling for Ascaris spp. and T. trichiura across Europe. A map showing the location of all sampled sites included in our analyses, where marker type indicates the era from which the skeletal samples came.

Figure 1 Long description
Sample sites across various historical eras are displayed on a map of Europe, marked by different symbols. The legend identifies the symbols: plus for Prehistoric, triangle for Ancient, circle for Early Middle Ages, square for Late Middle Ages and cross for Industrial. Sites are distributed across regions including the United Kingdom, France, Spain, Italy, Germany and Greece. Prehistoric sites are concentrated in the UK and northern France. Ancient sites are scattered across Italy and Greece. Early Middle Ages sites are mainly in the UK. Late Middle Ages sites appear in Spain and central Europe. Industrial sites are found in the UK and Italy. The map provides a spatial overview of archaeological sampling across these eras.
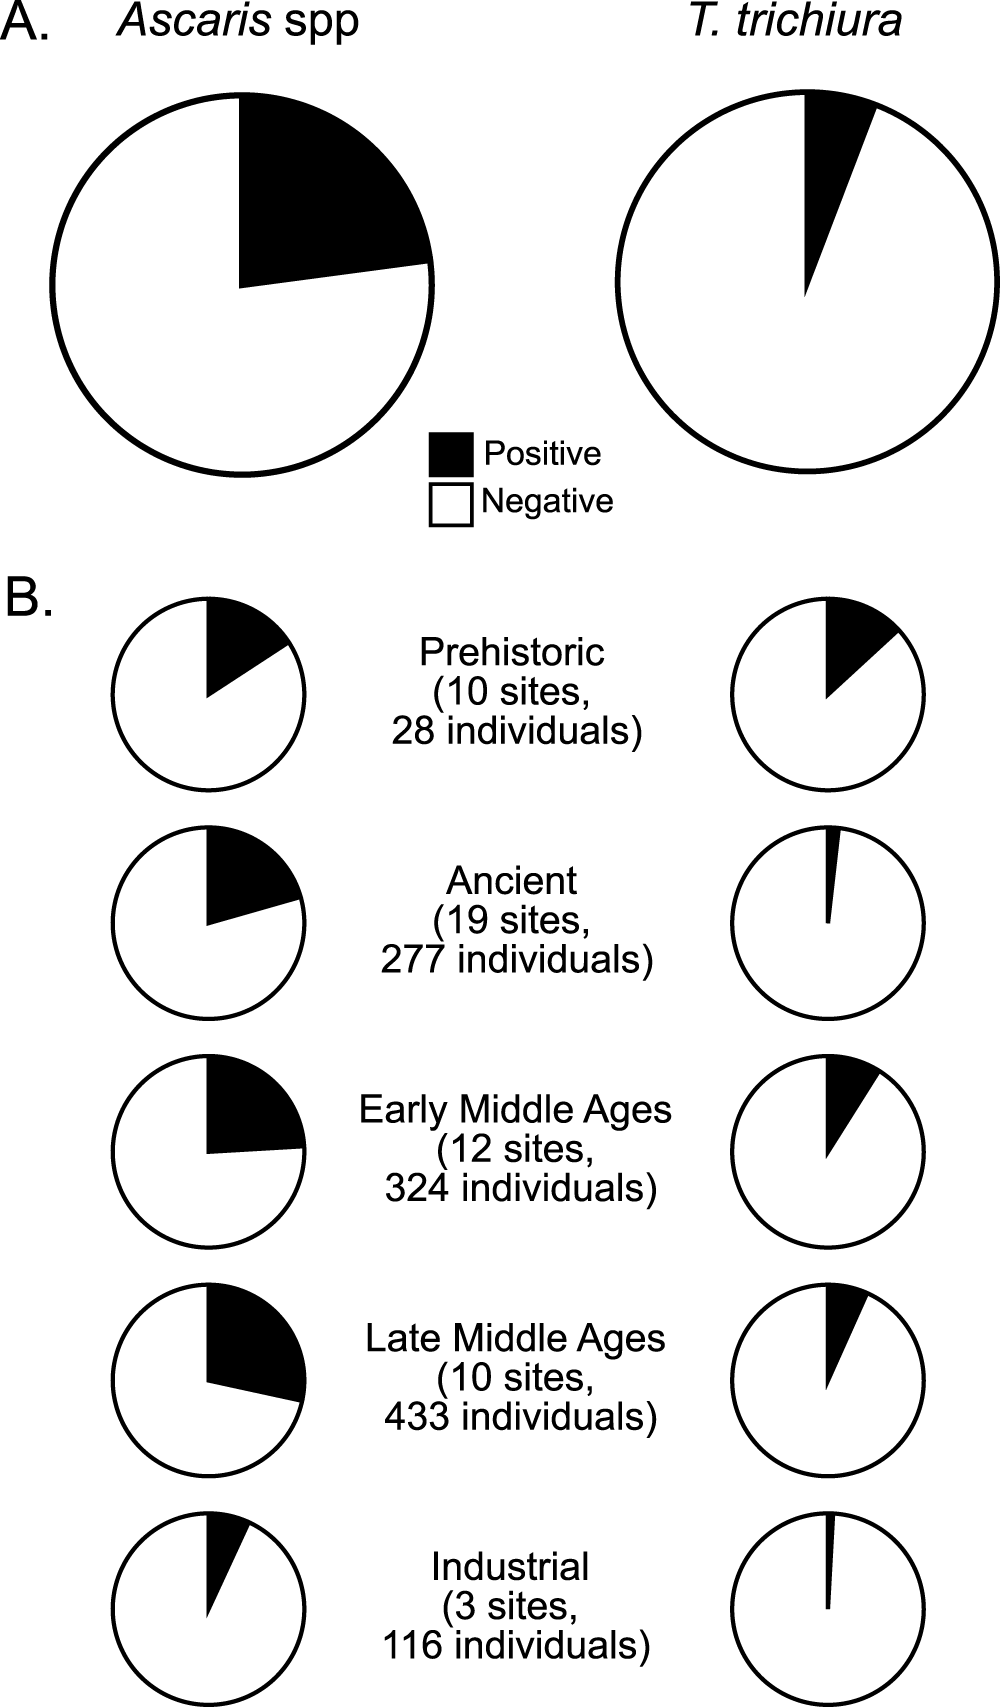
Considering the whole dataset, we report an overall observed frequency of infection with Ascaris spp. at 22.9% (95% CI: 20.6%, 25.4%) and T. trichiura at 5.8% (95% CI: 4.6%, 7.3%) for across 54 sites and 1188 individuals (Figure 2). However, it is clear that there is considerable variation when sites are considered separately or grouped into broad eras, Prehistoric (pre 500 BC; 10 sites, 38 individuals), Ancient (between 500 BC and 450 CE; 19 sites, 277 individuals), Early Middle Ages (450 CE to 1100 CE; 12 sites, 324 individuals), Late Middle Ages (1100 CE to 1450 CE; 10 sites, 433 individuals) and Industrial (1750 CE onwards; 3 sites, 116 individuals). For Ascaris spp. the pan-dataset observed frequencies were: Prehistoric period, 15.8% (95% CI: 7.4%, 30.4%), Ancient period 20.6% (95% CI: 16.2%, 25.7%), Early Middle Ages, 24.1% (95% CI: 19.7%, 29.0%), Late Middle Ages, 28.4% (95% CI: 24.4%, 32.8%) and Industrial period, 6.9% (95% CI: 3.5%, 13.0%). For T. trichiura the pan-dataset observed frequencies were: Prehistoric period, 13.2% (95% CI: 5.8%, 27.3%), Ancient period 1.8% (95% CI: 0.77%, 4.2%), Early Middle Ages, 9.0% (95% CI: 6.3%, 12.6%), Late Middle Ages, 6.7% (95% CI: 4.7%, 9.5%) and Industrial period, 0.86% (95% CI: 0.15%, 4.7%).
Overall prevalence of Ascaris spp. and T. trichiura in the entire sample, and within each era. Panel A represents the prevalence of both species of parasites in the entire sample using pie charts. Panel B similarly shows pie charts for the entire sample from each era: Prehistoric (pre 500 BC; 10 sites, 38 individuals), Ancient (between 500 BC and 450 CE; 19 sites, 277 individuals), Early Middle Ages (450–1100 CE; 13 sites, 324 individuals), Late Middle Ages (1100–1450 CE; 9 sites, 433 individuals) and Industrial (1750 CE onwards; 3 sites, 116 individuals).

Figure 2 Long description
Panel A consists of two pie charts representing the prevalence of Ascaris spp and T. trichiura. The Ascaris spp chart shows approximately 25 percent positive prevalence, while T. trichiura shows under 10 percent positive prevalence. The legend indicates black for positive and white for negative. Panel B includes five pairs of pie charts for different historical eras: Prehistoric (10 sites, 28 individuals) with about 15 percent positive for Ascaris spp and 13 percent for T. trichiura; Ancient (19 sites, 277 individuals) with about 20 percent positive for Ascaris spp and under 2 percent for T. trichiura; Early Middle Ages (12 sites, 324 individuals) with about 24 percent positive for Ascaris spp and 9 percent for T. trichiura; Late Middle Ages (10 sites, 433 individuals) with about 28 percent positive for Ascaris spp and 7 percent for T. trichiura; Industrial (3 sites, 116 individuals) with about 7 percent positive for Ascaris spp and under 1 percent for T. trichiura. The pie charts visually compare the prevalence of these parasites across different time periods, highlighting the highest positivity in the Late Middle Ages for Ascaris spp and the Prehistoric era for T. trichiura.
Analysis of Variance with a Tukey post hoc comparison test (conducted on the per site proportion positive, only for sites for which the original sample size ≥5) revealed no significant differences between any era for either nematode. The same analysis performed only on datapoints for which the original sample size ≥10 indicated a significant difference in the observed frequency of Ascaris spp. between the late Middle Ages and Industrial eras (P = 0.0251), but not between any other pairs of eras.
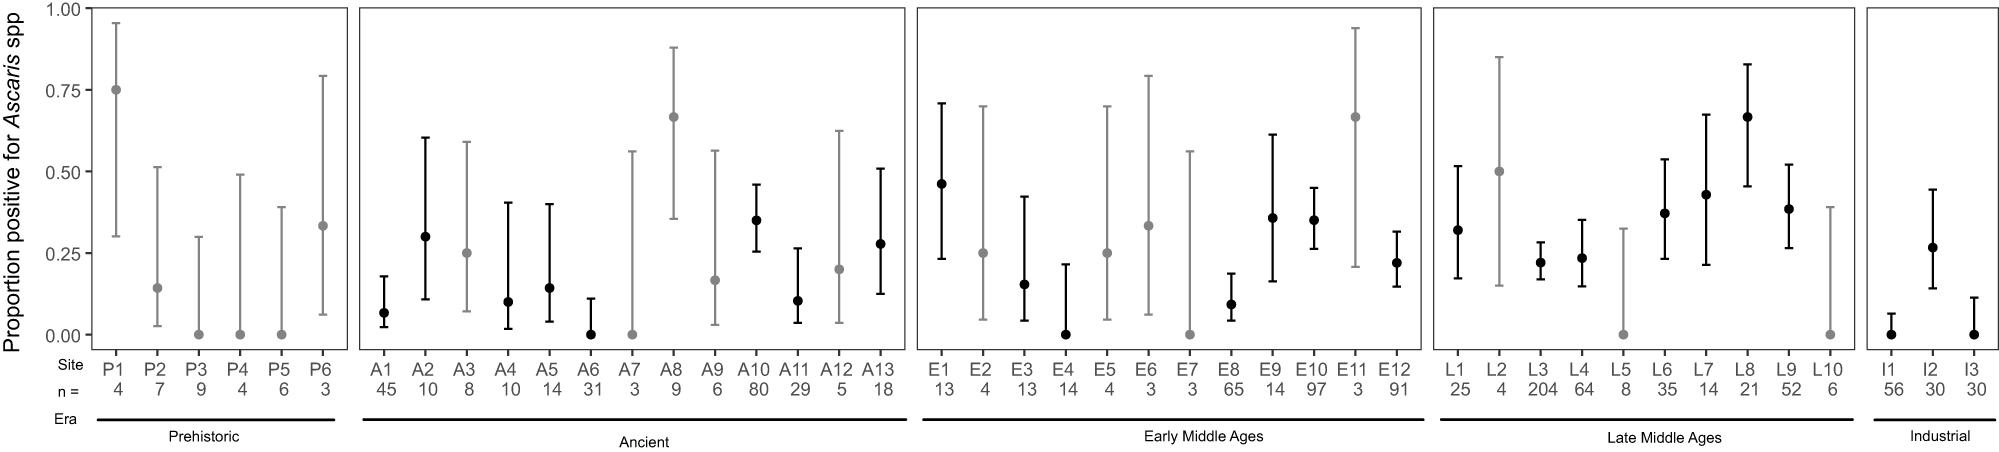
Examining the 44 sites with a sample size of 3 or above reveals considerable variation in the observed frequency of infection across individual sites even within eras (Figures 3 and 4). First, considering Ascaris spp., 3 of 6 prehistoric sites with N ≥ 3 reported Ascaris spp. eggs and only 1 of 3 sites reported Ascaris spp. eggs in the Industrial period. The numbers of individuals sampled per site was relatively small in the Prehistoric period. A far greater number of individuals were sampled for the Industrial period; thus, we have far greater confidence in the low observed frequencies at the 3 Industrial sites. In the intervening periods most sites with N ≥ 3 (30 out of 35) contained at least 1 individual positive for Ascaris spp. eggs, with similar proportions of positive sites in the 3 periods (Figure 3), i.e. 11/13 in the Ancient Period (c. 500 BC–450 CE), 10/12 in the Early Middle Ages c. 450–1100 CE) and 8/10 in the Late Middle Ages (c. 1100–1450 CE). Notably within this broad period, 3 of the 5 negative sites were based on analyses of relatively few (<10) individuals.
Ascaris spp. prevalence over time. The prevalence of Ascaris spp. in individuals from sites where the sample size ≥3, across each era within our dataset. Sites where the sample size <10 are displayed in grey. Confidence intervals were calculated using the Wilson method. Each site has been given a letter and number code (e.g. P1); these are also shown in Table 1 to identify each site.

Figure 3 Long description
Proportion positive for Ascaris spp. Five grouped plots are shown for eras labeled, Prehistoric, Ancient, Early Middle Ages, Late Middle Ages and Industrial. The y axis label is, Proportion positive for Ascaris spp. Tick labels shown are 0.00, 0.25, 0.50, 0.75 and 1.00. The x axis shows site codes. Under the site codes, a row labeled, n equals, lists sample sizes for each site. Under that, a row labeled, Era, names the era for each grouped plot. Each site is shown as a single circular point with a vertical error bar. Prehistoric sites and n values are: P1 n equals 4, P2 n equals 7, P3 n equals 9, P4 n equals 4, P5 n equals 6, P6 n equals 3. Ancient sites and n values are: A1 n equals 45, A2 n equals 10, A3 n equals 8, A4 n equals 10, A5 n equals 14, A6 n equals 31, A7 n equals 3, A8 n equals 9, A9 n equals 6, A10 n equals 80, A11 n equals 29, A12 n equals 5, A13 n equals 18. Early Middle Ages sites and n values are: E1 n equals 13, E2 n equals 4, E3 n equals 13, E4 n equals 14, E5 n equals 4, E6 n equals 3, E7 n equals 3, E8 n equals 65, E9 n equals 14, E10 n equals 97, E11 n equals 3, E12 n equals 91. Late Middle Ages sites and n values are: L1 n equals 25, L2 n equals 4, L3 n equals 204, L4 n equals 64, L5 n equals 8, L6 n equals 35, L7 n equals 14, L8 n equals 21, L9 n equals 52, L10 n equals 6. Industrial sites and n values are: I1 n equals 56, I2 n equals 30, I3 n equals 30. Across the grouped plots, points span from near 0.00 up to around 0.75 on the y axis. Several sites in the Late Middle Ages group have points between about 0.20 and 0.70, including one point near 0.70. The Industrial group includes one point near 0.25 and two points near 0.00. Error bar lengths vary by site, with several sites showing long vertical ranges that extend across multiple tick intervals.
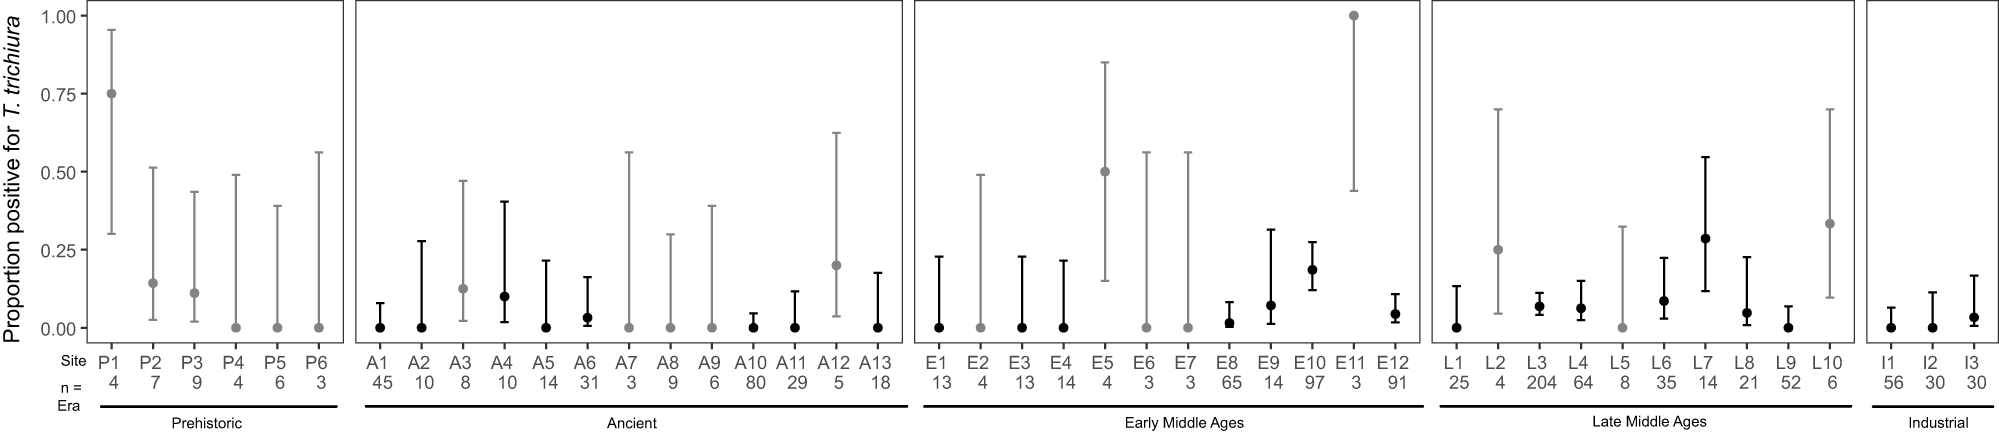
T. trichiura prevalence over time. The prevalence of T. trichiura in individuals from sites where the sample size ≥3, across each era within our dataset. Sites where the sample size <10 are displayed in grey. Confidence intervals were calculated using the Wilson method. Each site has been given a letter and number code (e.g. P1); these are shown in Table 1 to identify each site.

Figure 4 Long description
Five dot and error bar plots with the vertical axis label, Proportion positive for T. trichiura, with tick labels 0.00, 0.25, 0.50, 0.75, 1.00. Each plot has the horizontal axis label, Site, with site codes as categories. Each site has one dot with a vertical error bar. Under the site codes, two rows of text appear: n and Era. Prehistoric. Site codes: P1, P2, P3, P4, P5, P6. Row n values: 4, 7, 9, 4, 6, 3. Dots appear between 0.00 and 0.25, with one dot near 0.75. Error bars extend upward to around 0.50 for several sites and one error bar extends to 1.00. Ancient. Site codes: A1, A2, A3, A4, A5, A6, A7, A8, A9, A10, A11, A12, A13. Row n values: 45, 10, 8, 10, 14, 31, 9, 8, 80, 29, 5, 18, 13. Most dots appear between 0.00 and 0.15. One dot is near 0.25. Several error bars extend upward to around 0.50 and one extends above 0.50. Early Middle Ages. Site codes: E1, E2, E3, E4, E5, E6, E7, E8, E9, E10, E11, E12. Row n values: 13, 4, 13, 14, 6, 3, 65, 14, 97, 3, 91, 2. Most dots appear between 0.00 and 0.10. One dot is near 0.50. One dot is near 0.20. Error bars vary, with one extending to around 0.85 and one extending to 1.00. Late Middle Ages. Site codes: L1, L2, L3, L4, L5, L6, L7, L8, L9, L10. Row n values: 25, 4, 20, 64, 8, 35, 14, 21, 52, 6. Most dots appear between 0.00 and 0.15. One dot is near 0.30. Error bars extend upward to around 0.70 for one site and to around 0.55 for another. Industrial. Site codes: I1, I2, I3. Row n values: 56, 30, 30. Dots appear near 0.00 to 0.10. Error bars extend upward to around 0.20. Across the five eras, most site dots are positioned close to 0.00, with a small number of sites showing dots near 0.30, 0.50 and 0.75 and several sites showing long error bars reaching above 0.50.
The patterns seen for T. trichiura were quite similar, albeit with fewer sites containing positive individuals (21/44 sites; Figure 4). The frequency of individuals with reported T. trichiura eggs tended to be lower in those sites which were positive. The number of positive sites in Prehistoric and Industrial periods were 3/6 and 1/3, respectively. The proportion of sites where T. trichiura eggs were detected was highest in the Late Middle Ages (7/10) compared with 4/13 and 6/12 in the Ancient period and Early Middle Ages, respectively.
Given the fact that we detected a statistically significant difference in the observed frequency of Ascaris spp. between the late Middle Ages and Industrial periods, and given the substantial social and lifestyle changes that accompanied the Industrial Revolution, we focused our detailed analysis on factors affecting parasite prevalence in pre-Industrial sites.
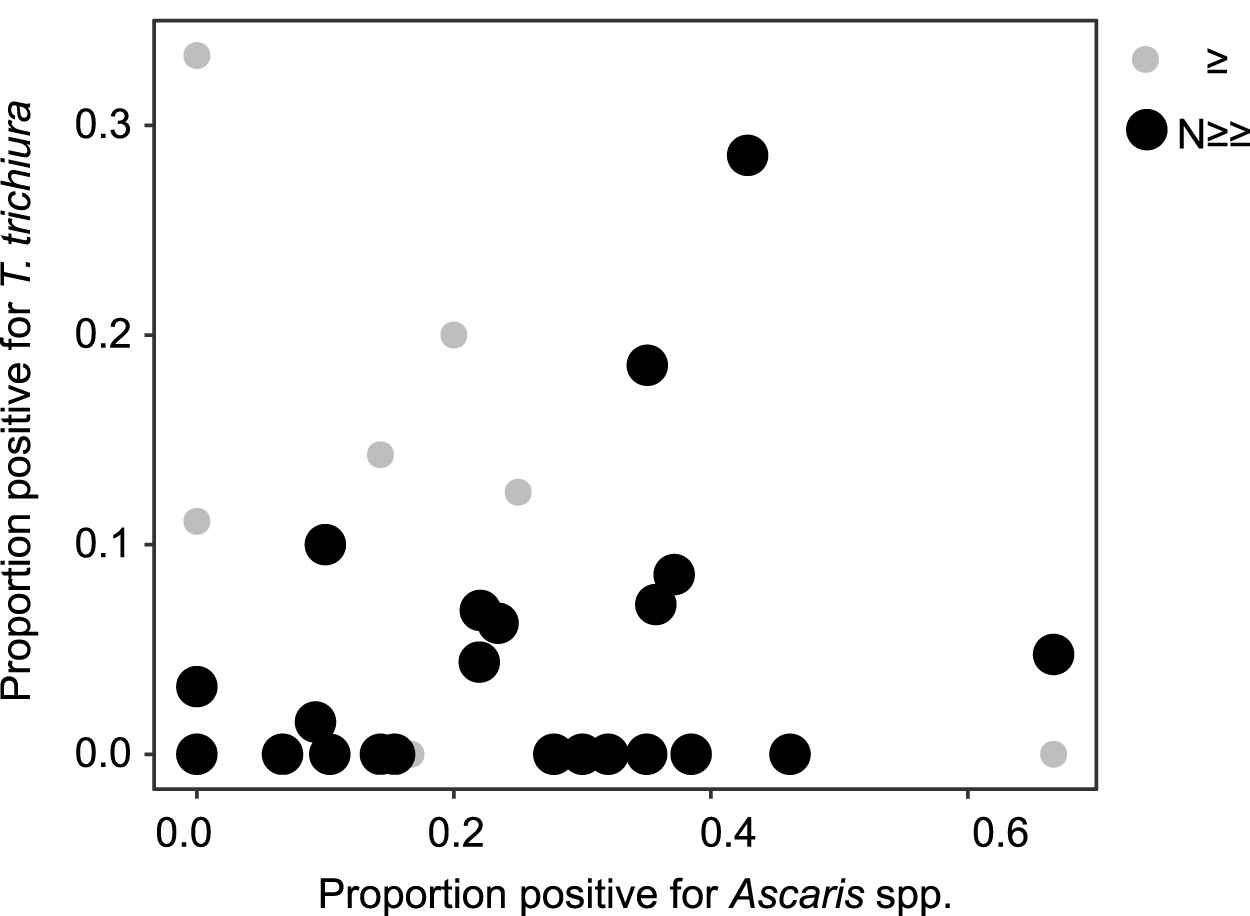
Considering the similarities of the life cycles of these nematodes (direct life cycle via faecal oral transmission routes) we first assessed whether there was a correlation between the observed frequency of Ascaris spp. and T. trichiura among pre-Industrial sites. Surprisingly, there was no evidence of a correlation between the rates of positive individuals for these intestinal nematodes (Figure 5).
Ascaris spp. and T. trichiura prevalence in pre-Industrial samples with N ≥ 5. Each marker corresponds to a site where N ≥ 5 (small grey circles), or N ≥ 10 (large black markers). The Pearson correlation coefficient for the dataset where N ≥ 5 is −0.029 (95% CI: −0.38, 0.33), and the Pearson correlation coefficient for the dataset where N ≥ 10 is 0.3 (95% CI: −0.14, 0.64).

The wide geographical and historic ranges of the sites enabled us to examine whether population density or climatic factors associate with the observed frequency of Ascaris spp. or T. trichiura. To consider the impact of population density, we used a historical geospatial model of past human population densities (Klein Goldewijk et al., Reference Klein Goldewijk, Beusen, Doelman and Stehfest2017) to classify sites into 4 categories (population <500 per 5 arcminute grid cell; population between 500 and 1000 per 5 arcminute grid cell; population between 1000 and 2000 per 5 arcminute grid cell and population >2000 per 5 arcminute grid cell). We also obtained historical temperature estimates for each site (Osman et al., Reference Osman, Tierney, Zhu, Tardif, Hakim, King and Poulsen2021) and used a global map of aridity (Zomer et al., Reference Zomer, Xu and Trabucco2022) to assign an aridity value to each location. The range of aridity index and temperature values within the dataset are visualized in Supplementary Figure S1A. We chose an average annual temperature of 12oC to distinguish colder from warmer locations, which divided our dataset into 2 near-equal halves. We deemed any location that was semi- arid or drier to be ‘dry’ and any location sub humid or wetter to be ‘wet’. Based on their combined aridity and temperature, all sites fell into 1 of 3 climate categories (wet and cold, wet and warm or dry and warm), so these categories formed the basis of our climate analysis.
As shown in Supplementary Figure S6A, for sites where N ≥ 5, Ascaris spp. and T. trichiura occur at similar, low, observed frequencies at the lowest level of population density (no significant difference in the observed frequency of Ascaris spp. and T. trichiura in a paired T-test, P = 0.536). As population density increases to >500, the observed frequency of Ascaris spp. increases but T. trichiura remains relatively low (and the difference in observed frequency between Ascaris spp. and T. trichiura is significant in a paired T test, P = 0.00028). Only when population density increases above 1000 does the observed frequency of T. trichiura rise to meet Ascaris spp. (difference in observed frequency between Ascaris spp. and T. trichiura no longer significant in a paired T-test, P = 0.1856). At the highest level of population density (>2000), we see a slight decrease in the observed frequency of both Ascaris spp. and T. trichiura, but again no difference between their frequencies in a paired T test (P = 0.143).
Supplementary Figure S6B reveals that climate conditions are not consistently represented among the different levels of population density. Dry and warm sites (5/31 where N ≥ 5) are mostly associated with the lowest population densities, and so it is only at the lowest population density that we can compare all 3 climate conditions. At this low population density, Ascaris spp. and T. trichiura are observed at consistently low frequencies regardless of the climate conditions.
Wet and cold and wet and warm sites occur more frequently in the dataset (11/31 and 15/31 of the sites where N ≥ 5, respectively) and occur across the range of different levels of population density. Individual remains positive for Ascaris spp. seem to be similarly likely to be observed in both wet and cold and wet and warm sites (Supplementary Figure S6B, note that there is only wet warm site at population density level 3, limiting the conclusions that can be drawn). By contrast, high frequencies of T. trichiura are observed only in the wet and cold sites, with extremely low frequencies observed in all the wet and warm sites.
We used analysis of variance to investigate whether population density or climate category had a significant relationship with the observed frequency of either nematode species, and whether there was any interaction between population density and climate. For Ascaris spp., the only significant predictor of observed frequency was population density (P = 0.029). There was no evidence for an interaction between population density and climate. Post hoc comparison tests showed that there was a significant difference between the observed frequency of Ascaris spp. at population density class <500 per 5 arcminute grid cell and at population density class 500–1000 per 5 arcminute grid cell (P = 0.017), but not between any other pairs of population density classes.
For T. trichiura, by contrast, ANOVA showed a significant interaction between population density and climate (P = 0.018), suggesting that the relationship between population density and the observed frequency of T. trichiura is different under different environmental conditions. Post hoc comparison tests indicated that there was a significant difference between the observed frequency of T. trichiura at population density class <500 per 5 arcminute grid cell vs at population density classes 1000–2000 or >2000 per 5 arcminute grid cell, and also between population density class 500–1000 and population density class 1000–2000 per 5 arcminute grid cell, but only within the climate category ‘wet and cold’ (Supplementary Figure S6B). The pattern whereby high observed frequencies of T. trichiura are associated with a narrower (and colder) temperature range than high Ascaris spp. prevalences is also visualized in Supplementary Figure S1B.
Discussion
Two of the common STHs, A. lumbricoides and T. trichiura, are often identified in archaeological deposits in Europe even though their modern distribution is largely restricted to less economically developed tropical and subtropical regions (Brooker et al., Reference Brooker, Clements, Bundy, De Baets and Littlewood2006; World Health Organisation, 2023). These archaeological contexts include both communal latrine or waste deposits and the sacral region of skeletal remains (Flammer and Smith, Reference Flammer and Smith2020). Observed parasite frequencies in remains from Medieval Europe were similar to those detected in modern communities experiencing endemic STH infection (Flammer et al., Reference Flammer, Ryan, Preston, Warren, Přichystalová, Weiss, Palmowski, Boschert, Fellgiebel, Jasch-boley, Kairies, Rümmele, Rieger, Schmid, Reeves, Nicholson, Loe, Guy, Waldron, Macháček, Wahl, Pollard, Larson and Smith2020; Ryan et al., Reference Ryan, Flammer, Nicholson, Loe, Reeves, Allison, Guy, Doriga, Waldron, Walker, Kirchhelle, Larson and Smith2022), indicating that there was no fundamental block to transmission in historic Europe. The presence of such helminths at an archaeological site is generally taken to indicate ineffective sanitation at that point in history, but it is hard to draw any broader conclusions from single site observations. Here, we analyse multiple archaeological sites containing single burial-derived remains from Prehistoric to Industrial eras across a broad latitudinal range within Europe, and ask what factors predict the observed frequency of STH infection? An understanding of the risk factors for infection at different points of history teaches us more about life in different eras and may also deepen our knowledge of the helminths themselves.
We observed no correlation between the frequencies of Ascaris spp. and T. trichiura in the pre-Industrial dataset as a whole, despite their similar faecal-oral transmission routes. We identified 2 differences between observed patterns of Ascaris spp. frequencies and patterns of T. trichiura frequencies that may account for this lack of correlation. Firstly, high frequencies of either parasite in pre-Industrial archaeological sites are only observed above a certain minimum level of population density, but T. trichiura seems to require a higher population density threshold than Ascaris spp. to succeed. Secondly, higher frequencies of T. trichiura are observed within a narrower window of climate conditions than higher frequencies of Ascaris spp.
Ascaris spp. and T. trichiura eggs have both been recovered from millennia-old samples (Anastasiou et al., Reference Anastasiou, Papathanasiou, Schepartz and Mitchell2018; Harter-Lailheugue et al., Reference Harter-Lailheugue, Le Mort, Vigne, Guilaine, Le Brun and Bouchet2005). However, taphonomic processes could affect the survival of evidence of individual infections (Morrow et al., Reference Morrow, Newby, Piombino-mascali and Reinhard2016; Ramirez et al., Reference Ramirez, Fabra, Xavier and Iñiguez2022), and it has been argued that evidence of Ascaris spp. infection and evidence of T. trichiura infection may not be equally likely to survive in an archaeological context. Morrow et al. (Reference Morrow, Newby, Piombino-mascali and Reinhard2016) suggested that the larger size and thicker chitinous layer of A. lumbricoides eggs may make them more likely to survive over time than the eggs of T. trichiura (but we note that this is not consistent with T. trichiura eggs being found in some of the oldest archaeological sites). Recent experimental work also suggests that T. trichiura eggs may in fact be more resistant to desiccation and sudden changes in temperature than those of A. lumbricoides (Saldanha et al., Reference Saldanha, Pucu, Chame and Leles2022).
In addition to the survival of individual eggs, egg abundance could impact the likelihood of observing each species. Morrow and colleagues point out that a female A. lumbricoides worm produces more than 200 000 eggs per day, whilst a female T. trichiura produces up to 30 000 eggs per day, which may make evidence of infection with Ascaris spp. easier to recover (Morrow et al., Reference Morrow, Newby, Piombino-mascali and Reinhard2016). However, the number of eggs released per female per day needs to be contextualized by the average worm burden in a given infection, which is typically greater for T. trichiura than A. lumbricoides (a mean of 27.3 worms per adult for T. trichiura vs 4.1 worms per adult for A. lumbricoides (Bundy, Reference Bundy1986). The calculation of likely egg abundance in an individual is complicated further by the fact that for both species, the distribution of the number of worms per human infection is highly over dispersed (Bundy, Reference Bundy1986).
Overall, we consider that it is unlikely that the probability of detecting eggs in individual remains as evidence of historical infection is substantially different for these 2 parasite species. The eggs from both nematodes are robust (detectable in different conditions over very large periods of time in a range of contexts) and the worm burdens largely counteract any effect of individual worm fecundity. Moreover, in 2 communal sites containing multiple samples dating across the Middle Ages the numbers of Ascaris spp. and T. trichiura eggs were correlated across the sample sets (Flammer et al., Reference Flammer, Dellicour, Preston, Rieger, Warren, Tan, Nicholson, Přichystalová, Bleicher, Wahl, Faria, Pybus, Pollard and Smith2018).
A lack of correlation between the observed frequency of Ascaris spp. and the observed frequency of T. trichiura across pre Industrial Europe could be explained by (i) different relative suitabilities of each site for transmission of each worm in the first place (a site that was historically suitable for Ascaris spp. transmission may not have been similarly suitable for T. trichiura transmission), or (ii) a property of a subset of the sites (not all sites) making evidence of 1 worm fundamentally harder to find than evidence of the other worm even though both worms were present in the past. It is hard to interpret our result linking population density to each of these parasites as anything other than the first mechanism: population density is likely to impact the probability of infection and may have a different relationship with Ascaris spp. as opposed to T. trichiura. Climate conditions could potentially impact both the probability of infection in the first place and the probability of evidence for that infection persisting in an archaeological context (e.g. drier conditions being less suited to the preservation of Ascaris spp., as suggested by Saldanha et al. (Reference Saldanha, Pucu, Chame and Leles2022) – although we must also note that the eggs of both parasites have been recovered from a range of climatic conditions). Modern epidemiological analyses also report differences in infection rates associated with local climate (e.g. Pullan et al., Reference Pullan, Gething, Smith, Mwandawiro, Sturrock, Gitonga, Hay and Brooker2011; Scholte et al., Reference Scholte, Schur, Bavia, Carvalho, Chammartin, Utzinger and Vounatsou2013; Manz et al., Reference Manz, Clowes, Kroidl, Kowuor, Geldmacher, Ntinginya, Maboko, Hoelscher and Saathoff2017) discussed below.
Studies of modern populations usually consider far larger sample sizes than those available at archaeological sites, and modern epidemiological studies survey a cross-section of a living population, attaining accurate estimates of the prevalence of worm infection. Despite these advantages, modern day studies typically examine a single location or a few locations in a single region and focus on behavioural factors or local sanitary infrastructure, revealing relatively little about the impact of population density, temperature or aridity. As expected, access to effective sanitation and personal hygiene are the most consistent factors associated with both prevalence and intensity of infections with Ascaris spp. and T. trichiura (Parajuli et al., Reference Parajuli, Fujiwara, Umezaki, Konishi, Takane, Maharjan, Tachibana, Jiang, Pahari and Watanabe2014; Muluneh et al., Reference Muluneh, Hailu and Alemu2020; Chopra et al., Reference Chopra, Shekhar, Dagar and Pandey2022; Andargie et al., Reference Andargie, Alelign and Tekeste2024; Justine et al., Reference Justine, Bhuko, Rubagumya, Basinda, Ruganuza, Zinga, Briet, Misko, Legein, Mohamed, Mushi, Tarimo, Mazigo and De Malsche2024; Kouamé et al., Reference Kouamé, Bär, Kouadio, Touré, Keiser and Coulibaly2025; Muenjak et al., Reference Muenjak, Thongrod, Choodamdee, Pongpanitanont, Yingklang, Thanchomnang, Laymanivong and Janwan2025). Other predictably major factors include the application of anti-helminth drugs either to school-aged children or more broadly across the population (Agrawal et al., Reference Agrawal, Pattnaik, Kshatri, Kanungo, Mandal, Palo and Pati2024). The recovery of infection rates often occurs post-treatment and the rates of reinfection can vary dependent on many factors including the targeted population (school age vs whole community) other attempted interventions as well as local environmental factors (Bethony et al., Reference Bethony, Brooker, Albonico, Geiger, Loukas, Diemert and Hotez2006; Agrawal et al., Reference Agrawal, Pattnaik, Kshatri, Kanungo, Mandal, Palo and Pati2024). Our study provides a baseline epidemiological assessment of the factors affecting the rates of infection in historical populations (prior to the development of modern anthelminthics) and as such may provide useful information for forecasting factors that might affect post treatment reinfection.
In the Mbeya region of Tanzania, T. trichiura infection was positively associated with increasing vegetation coverage and slope, but negatively associated with increasing rainfall and elevation (Manz et al., Reference Manz, Clowes, Kroidl, Kowuor, Geldmacher, Ntinginya, Maboko, Hoelscher and Saathoff2017). Notably, this region has very high levels of rainfall and the negative association seen in this study was considered due to the effects of waterlogging. In many more arid environments it is clear that rainfall, proximity to water bodies, or proxies for moisture such as vegetation indices, are positively associated with STH prevalence (Pullan et al., Reference Pullan, Gething, Smith, Mwandawiro, Sturrock, Gitonga, Hay and Brooker2011; Scholte et al., Reference Scholte, Schur, Bavia, Carvalho, Chammartin, Utzinger and Vounatsou2013; Oluwole et al., Reference Oluwole, Ekpo, Karagiannis-voules, Abe, Olamiju, Isiyaku, Okoronkwo, Saka, Nebe, Braide, Mafiana, Utzinger and Vounatsou2015; Siza et al., Reference Siza, Kaatano, Chai, Eom, Rim, Yong, Min, Chang, Ko and Changalucha2015). Such local effects in terms of positive and negative effects of rainfall have also been reported elsewhere (Pullan et al., Reference Pullan, Gething, Smith, Mwandawiro, Sturrock, Gitonga, Hay and Brooker2011; Scholte et al., Reference Scholte, Schur, Bavia, Carvalho, Chammartin, Utzinger and Vounatsou2013).
To understand the impact of population density on helminth prevalence, non-human primates may be a relevant comparator. A study of gastrointestinal parasites among leaf monkeys in Sri Lanka showed a positive relationship between T. trichiura and troop size (Weerasekara et al., Reference Weerasekara, Wijesooriya, Ranawana, Anupama and Rajapakse2021). A study of captive rhesus monkeys housed at different group sizes showed that the prevalence of helminths (a combination of T. trichiura and Strongyloides fulleborni, separate numbers not reported) doubled when group sizes exceeded 12 animals (Phillippi and Clarke, Reference Phillippi and Clarke1992). These observations are consistent with transmission of T. trichiura having a strong and potentially nonlinear relationship with population density.
The embryonation of helminth eggs (required for successful infection upon ingestion) is known to depend on temperature and moisture. As summarized in (Brooker et al., Reference Brooker, Clements, Bundy, De Baets and Littlewood2006), neither A. lumbricoides nor T. trichiura embryonate if humidity is <50%, or if the temperature is greater than 39 °C or below 5 °C. Embryonation in the environment is generally quicker for A. lumbricoides than T. trichiura, with both developing most quickly at temperatures close to 30 °C, and with the optimum range of temperatures for T. trichiura narrower than that for A. lumbricoides (Brooker et al., Reference Brooker, Clements, Bundy, De Baets and Littlewood2006). A. lumbricoides eggs have also been shown to be more resistant (in terms of their viability) to exposure to extreme temperatures than those of T. trichiura (Maya et al., Reference Maya, Ortiz and Jiménez2010).
Taking all this together, one plausible interpretation of the archaeological evidence is as follows. At the lowest human population densities in pre-Industrial Europe, Ascaris spp. and T. trichiura could infect human populations, but their successful maintenance in the population was not guaranteed. The observed frequencies of Ascaris spp. and T. trichiura are similar in the dataset (Figure 6). Both parasites are likely subject to the same limiting factor: stochastic loss from populations due to the dispersed nature of their hosts. Interestingly, Leles et al. note a lack of association between the presence of Ascaris spp. and T. trichiura among prehistoric South American sites (Leles et al., Reference Leles, Reinhard, Fugassa, Ferreira, Iñiguez and Araújo2010). Leles et al. point out that the hunter gatherer and early horticulture lifestyles of these populations would likely have been associated with relatively low levels of faecal contamination, and highlight a range of additional factors (e.g. fibre content of diet) which could play a role in determining sporadic STH success in such settings.
The impact of population density and climate on Ascaris spp. and T. trichiura prevalence. The boxplots in panel A illustrate the distribution of prevalences seen for Ascaris spp. (red shaded boxplots) and T. trichiura (black unshaded boxplots), at 4 different population density classes (<500 per 5 arcminute grid cell; 500–1000 per 5 arcminute grid cell; 1000–2000 per 5 arcminute grid cell and >2000 per 5 arcminute grid cell). Open circles indicate individual datapoints. Panel B illustrates the same data, split up by climate category in addition to population density class. The letter labels on each boxplot indicate the results of ANOVA testing the impact of population density and climate conditions on prevalence of each nematode species. For Ascaris spp. prevalence, only the main effect of population density showed a significant effect, so the relevant labels are in panel A. For T. trichiura, there was a significant interaction between population density and climate. Significant differences between population density classes were only observed at 1 climate condition (indicated in panel B). In all cases, population density classes that do not share a letter label are significantly different from each other (P < 0.05). We also tested for differences between Ascaris spp. and T. trichiura prevalences per site using paired T-tests. Any such comparison that yielded a significant result is indicated with a bar above the pair of boxplots, *P < 0.05, **P < 0.005, ***P < 0.0005.

Figure 6 Long description
Box plots of Proportion positive by Population density category for Ascaris spp and T. trichiura. Population density category labels are, less than 500, 500 dash 1000, 1000 dash 2000 and greater than 2000. The vertical axis label is, Proportion positive. Two box plots are shown per category, with open circles marking individual data points. Ascaris spp has a higher median than T. trichiura in the 500 dash 1000 category, with a tall spread and an upper point near the top of the plotting area. In the 1000 dash 2000 category, both taxa have higher central values than in less than 500, with Ascaris spp centered higher than T. trichiura. In the greater than 2000 category, both taxa show lower central values than in 1000 dash 2000 and there is a single filled point above the T. trichiura box plot. Letter labels above categories include, a, b and ab. A bracket with three asterisks is drawn above the 500 dash 1000 category. Three stacked box plot sections labeled, Dry and warm, Wet and cold and Wet and warm. Each section plots Proportion positive on the vertical axis with tick labels 0.0, 0.2, 0.4, 0.6 and 0.8, against Population density category on the horizontal axis with the same four categories as image. Each category shows paired box plots for Ascaris spp and T. trichiura with open circles as individual data points. In Dry and warm, values cluster near the lower part of the axis for both taxa in less than 500 and greater than 2000 and there is a single Ascaris spp mark around the mid range between 0.4 and 0.6 at 500 dash 1000. In Wet and cold, Ascaris spp increases from low values in less than 500 to higher values in 500 dash 1000 and 1000 dash 2000, with a point near 0.6 at 500 dash 1000; T. trichiura is near 0.0 in less than 500 and 500 dash 1000, then higher around the 0.2 range in 1000 dash 2000 and greater than 2000. Brackets show two asterisks above 500 dash 1000 and one asterisk above 1000 dash 2000. Letter labels in Wet and cold include, a, ab, c and bc. In Wet and warm, Ascaris spp shows higher central values in 500 dash 1000 and greater than 2000 than in 1000 dash 2000, where points lie near 0.0; T. trichiura remains near 0.0 across categories, with a single filled point above the greater than 2000 category.
As human population density increases within pre-Industrial Europe (500–1000 per 5 arcminute grid cell), Ascaris spp. seem to be more likely to succeed than T. trichiura. This may relate to the aforementioned differences in Ascaris spp. and T. trichiura embryonation rates at different temperatures. At 20 °C, Ascaris spp. eggs take ∼20 days to develop, whilst T. trichiura eggs take up to 57 days to develop (Seamster, Reference Seamster1950; Green et al., Reference Green, Beer, Jenkins, McFadzean and Pugh1973; Beer, Reference Beer1976). It could be the case that having a substantially quicker development time than T. trichiura at relatively cool temperatures allows Ascaris spp. transmission to be sustained more readily at a medium-low population density. This could also impact the number of cycles of infection and transmission events that can be achieved within climates with strong seasonality.
At the highest human population densities in pre-Industrial Europe (>1000 per 5 arcminute grid cell), small differences in environmental transmission preferences between Ascaris spp. and T. trichiura may no longer be so important and both worms can be observed at similar levels, although we only observe high frequencies of T. trichiura in relatively colder sites within the dataset. When we subdivide the data such that we only consider sites with N ≥ 10 at population densities greater than 1000 per 5 arcminute grid cell, we observe a perfect positive correlation between the observed frequency of Ascaris spp. and T. trichiura at colder temperatures, and no correlation at warmer temperatures (Supplementary Figure S2B).
The fact that we see T. trichiura attain the same high observed frequencies as Ascaris spp. only in relatively colder sites seems unlikely to be due to T. trichiura being adapted to colder temperatures. In this dataset, colder sites are those with average annual temperatures up to 12 °C, which suggests that for most of the year, temperatures would be far from those optimal for T. trichiura development. However, estimates of surface temperatures cannot tell us about the impact of larger deposits of faecal material associated with larger population densities. Such deposits may increase the heat provided by decomposition, increasing the embryonation and transmission of both parasites to levels higher than would be expected at ambient environmental temperatures. Communal deposits of faecal material may also locally retain moisture at levels more appropriate to egg embryonation (compared with the environment outside of latrines or communal deposits). The interaction between ambient temperature and conditions within latrines or cesspits (where perhaps warmer temperatures led to drier conditions that were less optimal for T. trichiura development) could be key to understanding our observations.
Overall, we suggest that at low historical population densities, differences in the transmission success of Ascaris spp. and T. trichiura prevent us observing a correlation between the frequencies of Ascaris spp. and T. trichiura. At high historical population densities, we propose both parasites could have been transmitted efficiently, but that some feature of the warmer sites within our dataset (possibly linked to an interaction between temperature, moisture and soil management) still limited the success of T. trichiura. It is also possible that an as-yet-undetermined feature of warm wet sites makes it less likely for evidence of T. trichiura to persist in an archaeological context than evidence of Ascaris spp., leading to our failure to observe a correlation between these parasites. However, both species eggs are extremely robust and it is difficult to envisage particular conditions that might lead to differential preservation.
Our proposal that population density strongly influenced STH prevalence in pre-Industrial Europe, and that Ascaris spp. may be able to succeed at lower population densities than T. trichiura under certain environmental circumstances could have epidemiological relevance today. The present-day distributions of Ascaris spp. and T. trichiura are not entirely overlapping. In particular, a 2010 geostatistical map of the global distribution of both helminths (Pullan et al., Reference Pullan, Smith, Jasrasaria and Brooker2014) suggests particularly large discrepancies in the prevalence of Ascaris spp. and T. trichiura in Kazakhstan, Kyrgyzstan and Papua New Guinea. In all 3 locations, Ascaris spp. is estimated at a prevalence of 20–50% infection but T. trichiura at a prevalence of <1%. It is possible that the low population densities of all 3 countries are part of the mechanism explaining the dominance of Ascaris spp., a topic which deserves more detailed analysis.
It is important that we discuss both the positive outcomes and limitations of this study. On the one hand, it is impressive that sufficient numbers of individual remains have been examined at different archaeological sites to enable this analysis in the first place and that the impact of population density and climate on the observed frequency of STHs is strong enough to be detectable despite data being gathered under vastly disparate conditions, from different burial contexts, and by a range of different teams. It is also interesting that a difference emerges between the impact of population density and climate on Ascaris spp. and T. trichiura. On the other hand, the dataset can be considered geospatially unbalanced with some regions subject to more intense investigation than others (most notably Italy and the UK). However, there are also data from a range of other countries including Spain, Germany, Belgium, France, Czechia and Greece.
Despite including as many sites as possible, the size of the current dataset does limit statistical power – e.g. as seen in Supplementary Figure S6A, we could not detect a statistically significant difference (P < 0.05) between the observed frequency of Ascaris spp. at population density categories of 1000–2000 or >2000 and the population density category <500. This is in part due to the number of sites in each category and also due to the influence of other factors such as climate (see Supplementary Figure S6B). As more studies are published, this will increase the power of future analyses within the framework used in this study and enable more refined analysis of the geospatial structure of helminth infections in pre-Industrial Europe. Publication of further studies will also allow more detailed analysis of anthropomorphic and climatic constraints on the prevalence of infection.
We elected not to segregate the current data set according to age at death or biological sex as we were considering broad scale associations and the published datasets variably reported these features. Moreover, the age- and sex-related prevalence differences in many modern communities are often small and vary according to specific site (Bundy et al., Reference Bundy, Cooper, Thompson, Didier and Simmons1987; Parajuli et al., Reference Parajuli, Fujiwara, Umezaki, Konishi, Takane, Maharjan, Tachibana, Jiang, Pahari and Watanabe2014; Gildner et al., Reference Gildner, Cepon-robins, Liebert, Urlacher, Madimenos, Snodgrass and Sugiyama2016; Shoemaker et al., Reference Shoemaker, Dale, Cohn, Kelly, Zoerhoff, Batcho, Bougouma, Nko’ayissi, Meite, Marfo, Goepogui, Telfort, Sianipar, Traore, Rimal, Alfari, Anyaike, Badiane, Kargbo-labour, Mwingira, Awoussi, Stelmach, Smith, Arney, Faramand, Stukel, Pou, Rotondo, Kraemer and Baker2019). Similar variable patterns related to host age and sex were reported in historical contexts (Flammer et al., Reference Flammer, Ryan, Preston, Warren, Přichystalová, Weiss, Palmowski, Boschert, Fellgiebel, Jasch-boley, Kairies, Rümmele, Rieger, Schmid, Reeves, Nicholson, Loe, Guy, Waldron, Macháček, Wahl, Pollard, Larson and Smith2020; Ryan et al., Reference Ryan, Flammer, Nicholson, Loe, Reeves, Allison, Guy, Doriga, Waldron, Walker, Kirchhelle, Larson and Smith2022). Nevertheless, as more evidence becomes available, repeating this analysis and incorporating age and sex would be extremely interesting.
Our estimates of historical population density and temperature come from global historical models (Klein Goldewijk et al., Reference Klein Goldewijk, Beusen, Doelman and Stehfest2017; Osman et al., Reference Osman, Tierney, Zhu, Tardif, Hakim, King and Poulsen2021), which, whilst evidence-based, may not have accurately assigned each site to the correct population density or climate category. Our aridity estimates for each location came from a modern aridity map (Zomer et al., Reference Zomer, Xu and Trabucco2022), in the absence of a single dataset covering the time periods and region of interest, which makes aridity estimates especially vulnerable to error. This limitation is mitigated by the fact that we used aridity as a qualitative variable, splitting sites into ‘wet’ vs ‘dry’. The ‘dry’ sites were in Southern Spain, the Greek island Kea, and Cyprus (i.e. low latitude locations on the Mediterranean basin). The aridity of every single location within Europe will not have remained the same within the last 10 000 years, but the broad latitudinal climate gradient within Europe has likely remained. Indeed, aridity seems to have been a feature of southeastern Spain for millions of years (Carrión et al., Reference Carrión, Fernández, Jiménez-moreno, Fauquette, Gil-romera, González-sampériz and Finlayson2010) . Nevertheless, future analyses integrating historical geospatial aridity estimates based on speleothem, pollen or tree ring data may be useful.
The existence of global maps of historical population density and temperature means that any location on Earth can be assigned a population density and climate category (and it would be very interesting to extend this analysis to archaeological sites beyond Europe in the future). However, we must acknowledge that an ideal version of this analysis would use site-specific contextual information to verify the likely population density and climate at the time that the relevant individuals lived, and would also consider some measure of the connectedness of the population. Indeed, in a study of communal deposits, the connectivity of port locations was highlighted by an increased genetic diversity in the populations of T. trichiura compared with other locations (Flammer et al., Reference Flammer, Dellicour, Preston, Rieger, Warren, Tan, Nicholson, Přichystalová, Bleicher, Wahl, Faria, Pybus, Pollard and Smith2018). Differences in connectivity could also impact on the prevalence of infection.
Local improvements in sanitation have been proposed to have been the driving factor in the patchy reduction in helminth prevalence during the Industrial period in England (Ryan et al., Reference Ryan, Flammer, Nicholson, Loe, Reeves, Allison, Guy, Doriga, Waldron, Walker, Kirchhelle, Larson and Smith2022), and the current analysis confirms this period as a time where infections rates were likely highly variable and very low in some locations. Hence, despite widespread attempts to develop sanitation in earlier historical communities, including cesspits that date back to 3500 BCE in Babylon (Rafie et al., Reference Rafie, Hardy, Mohamad Zain, Gödeke and Abas2024) or 3000 BCE in Skarra Brae (Childe et al., Reference Childe, Paterson and Bryce1929), and the highly organized sewerage and water provision systems that date to the peak of the Roman Empire (Mitchell, Reference Mitchell2017), infection with these faecal-oral-transmitted helminths remained common. Nevertheless, if it were possible to account for the category of sanitation systems in place at each site, and/or the drinking water source likely used by the population, that would be an interesting explanatory factor to analyse alongside population density and climate in futurearasites and Vectors work.
Our analysis of archaeoparasitological evidence from pre-Industrial Europe suggests that without the impact of modern anthelminthics, and under temperate environmental conditions, both population density and temperature impacted the likelihood of infection with Ascaris spp. and T. trichiura. Interestingly, the impact of these factors differentiates between these nematodes, with T. trichiura being optimally transmitted over a narrower range of conditions than Ascaris spp. Our results have implications for the interpretation of archaeological data: in particular, the link between parasite prevalence and human population density alongside other factors. Indeed, this analytical framework will be enhanced by the addition of more archaeological sites across Europe and this will enable a much more refined view of the factors that affected our historical relationship with intestinal parasites. Our results could also inform modern anti-helminthic interventions to improve outcomes. For example, it may be useful to consider the effects of population density and environment, particularly in the context of differences between the epidemiology of Ascaris spp. and T. trichiura.
Supplementary material
The supplementary material for this article can be found at https://doi.org/10.1017/S0031182026102935.
Acknowledgements
We would like to acknowledge the intensive effort made by other researchers in this field. Without their published data, our analysis would not have been possible. We would also like to acknowledge the support of the University of Oxford International Student Study Exchange Programme and St Peters College, Oxford for supporting C.S. We would also like to acknowledge the support of numerous archaeologists and archaeology companies (identified in the primary reports and publications) for providing samples and support for their analysis.
Author contributions
A.L.S. and B.P. conceived and designed the study. C.S. assembled the dataset and metadata, analysed the data and generated figures. A.L.S. and B.P. wrote the manuscript. All 3 authors edited the manuscript. A.L.S. and B.P. contributed equally to this work and are co-corresponding authors.
Financial support
A.L.S. has received support from the BBSRC (BB/M011224/1) (John Fell fund (Oxford) and the Possehl Foundation in support of the archaeoparasitology programme.
Competing interests
The authors declare there are no conflicts of interest.
Ethical standards
Not applicable.




 Open access

