Introduction
Armed conflicts have profound impacts on the natural environment, depleting resources, polluting ecosystems, and endangering planetary health. 1 The global military sector alone accounts for an estimated 5.5% of total greenhouse gas emissions. 1 Beyond the immediate destruction of battle, the environmental consequences of war are multidimensional: impacting land and water, generating noise pollution, leaving behind hazardous materials, and worsening air quality,Reference Levy and Sidel 2 with long-term exposure harms often exceeding the short-term events themselves.Reference Rakshit, Horo and Ahsan 3 Munition detonations, fires ignited in destroyed infrastructure, and fuel combustion from military equipment release large quantities of fine particulate matter (PM2.5) and other toxic pollutants into the ambient air.Reference Sultan-Zoi, Khan Samim and Rahid Wiar 4
Air pollution is a worldwide challenge that relates to severe damage to air quality and atmospheric composition, with cascading effects on climate.Reference Sultan-Zoi, Khan Samim and Rahid Wiar 4 Air pollution has been defined as a serious threat since the 16th century.Reference Azar 5 The World Health Organization (WHO) estimates that air pollution accounts for approximately 7 million premature deaths annually, making it a leading cause of respiratory and cardiovascular diseases. 6 The chronic exposure to pollutant emissions resulting from wars and conflicts, vehicular traffic, windblown dust, residential heating, and domestic generators is greatly responsible for various acute health problems, impacting the old, young, and immunocompromised.Reference Sultan-Zoi, Khan Samim and Rahid Wiar 4
Two distinct exposure pathways can be distinguished. The first is direct-source exposure: populations located in or adjacent to active strike zones are directly exposed to high concentrations of combustion by-products, pulverized building materials, and toxic gases released by munitions detonations and the fires they ignite. The second is transport-mediated exposure: wind-borne particulate matter and gaseous pollutants disperse well beyond the immediate blast areas, elevating PM2.5 and NO2 concentrations across wider urban zones even in the absence of direct munitions activity.Reference Malytska, Galytska and Savenets 7 , Reference Meng, Lu and Liu 8
Lebanon, a nation that has faced decades of conflict, is a great example of the threats of war toward air pollution. The Lebanese Civil War (1975-1990) and subsequent conflicts, including the 2006 war, devastated the country’s infrastructure and resulted in environmental damage with long-lasting impacts.Reference Takshe, Huby and Frantzi 9 In 2006, a study conducted in Beirut, Lebanon, revealed a strong persistence of air pollutant levels.Reference Farah, Nakhlé and Abboud 10 The study recorded the highest peak in March 2006 due to the Khamasin desert dust storms, while the second highest peak of PM 10 was observed during the 2006 war and attributed to munition strikes on the capital, Beirut. It is important to note, however, that air pollution in Lebanon is also driven by multiple other factors, including urbanization, industrialization, car emissions (light-duty vehicles), diesel generators, and poor waste management practices.Reference Farah, Nakhlé and Abboud 10
In 2024, Lebanon endured its most intense conflict since the 2006 Lebanon War, marked by widespread attacks and a dramatic escalation in violence between October 2023 and October 2024. 11 By September 2024, munition strikes and aerial bombardment ravaged villages in Southern Lebanon’s border regions, Beirut’s Southern Suburbs, and the capital itself, causing extensive destruction. The conflict resulted in over 11,000 violent attacks, more than 2,593 deaths, and over 12,119 injuries. 11 Beyond these social and economic consequences, however, the conflict has also raised serious environmental concerns. PM2.5 is a chronic public health challenge even in the absence of conflict, driven by heavy traffic, diesel generator use, industrial activity, and inadequate waste management.Reference Farah, Nakhlé and Abboud 10 , Reference Whaibeh, Tayeh and Farah 12 Despite this burden, epidemiological research linking ambient PM2.5 to specific health outcomes in Lebanon remains sparse, with the Beirut Air Pollution and Health Effects (BAPHE) studyReference Nakhlé, Farah and Ziade 13 being one of the few local time-series analyses. Therefore, this study aims to characterize changes in ambient PM2.5 concentrations during the 2024 armed conflict in Beirut and to estimate their associated short-term for respiratory and dermatological hospital admissions.
Methodology
This study is a time-period comparison risk attribution analysis. It aims to assess changes in ambient PM2.5 concentrations in Beirut before and during the 2024 armed conflict and to estimate the associated short-term attributable risks for respiratory and skin disease hospital admissions. No new health outcome data were collected; RR and AR% estimates were derived by applying locally established exposure-response functions from the BAPHE studyReference Nakhlé, Farah and Ziade 13 to the observed changes in PM2.5 concentrations. All analyses were conducted using RStudio.
Study Location
The study was conducted in Beirut, Lebanon, a coastal Mediterranean city of approximately 2.4 million residents spanning 20.8 km2. 14 Vehicle traffic is the primary source of routine urban pollution, as industrial activity in surrounding areas is limited.Reference Nakhlé, Farah and Ziade 13
The Southern Suburbs, which sustained the most intense bombardment during the 2024 escalation (September 23 to November 27), are densely populated (~700,000 residents across 15.4 km2). 15 Within this area, 3 of the 5 monitoring sites (Chiyah, Hadath, and Choueifat) were located in or immediately adjacent to neighborhoods that sustained direct munitions strikes and are referred to collectively as Direct War Zone (DWZ) sites. The remaining 2 sites (Achrafieh and Furn El Chebbak) were situated at greater distances from active strike zones (non-DWZ sites). This classification reflects the 2 exposure pathways described in the Introduction, though proximity-based DWZ classification does not preclude the influence of other local sources.
Air Quality Measurements Collection and Management
Remote Sensing
Surface-level PM2.5 and total column SO2, NO2, and CO data were obtained from the Copernicus Atmosphere Monitoring Service (CAMS) reanalysis, a model-based product developed by the European Centre for Medium-Range Weather Forecasts. CAMS outputs are modeled estimates rather than direct satellite measurements, with a spatial resolution of approximately 44.5 km (a single grid cell covers the entire Beirut region) and 3-hourly temporal resolution. Reported values therefore represent area-average surface-level estimates for the first ~100 m atmospheric layer.
Data were extracted for a representative point in Beirut’s Southern Suburbs (33.845886°N, 35.502929°E) and divided into a baseline phase (January 1 to September 19, 2024) and a conflict phase (September 20 to November 28, 2024). The conflict phase start date corresponds to documented military escalation. 11 Hourly concentrations were derived from 3-hourly values through linear temporal interpolation.
The baseline period (744 hours) was intentionally longer than the conflict period (168 hours) to provide stable estimates of mean concentrations and capture seasonal variability. Comparisons used mean concentrations rather than cumulative values, with period deviations standardized as Z-scores based on baseline standard deviation.
Z-scores were calculated at hourly resolution as:

Positive deviations indicate higher PM2.5 during the conflict period relative to baseline. These coincide temporally with military escalation but may also reflect meteorological variability or other emission sources and should not be interpreted as causally attributable to the conflict alone.
Ground Level PM2.5 Measurements
Outdoor PM2.5 was measured using Dylos DC1100 optical particle counters, which estimate particle number concentrations via light scattering and convert these to mass concentrations through a proprietary algorithm. This is an indirect optical method rather than a gravimetric reference measurement; resulting values represent locally influenced outdoor concentrations rather than area-representative ambient levels.
Measurements were collected from October 25 to November 3, 2024, at 5 sites spanning Chiyah, Achrafieh, Choueifat, Furn El Chebbak, and Hadath. Data were recorded minute-by-minute and averaged hourly. All 5 monitors were cross-checked against each other before and during deployment to minimize inter-sensor variability, and hourly values were averaged arithmetically across sites to produce a composite hourly mean. The 10-day monitoring window limits the ability to characterize sustained exposure patterns.
Data Analysis
PM2.5 concentrations from both sources were summarized using medians given non-normal distributions. For satellite data, hourly values were aggregated to daily medians, then to an overall median across each period. For ground-level data, hourly values were first averaged across sites, then aggregated to daily medians and a 10-day overall median. Pre-conflict median concentrations were obtained from archived CAMS records for the same grid point.
Relative Risk Estimation
Exposure-response coefficients were obtained from the BAPHE study,Reference Nakhlé, Farah and Ziade 13 a Beirut time-series analysis using emergency hospital admission data and concurrent PM2.5 measurements. BAPHE was selected because it was conducted in the same city with comparable population characteristics and represents the longest available local air pollution time series. The coefficients used were:
-
1. Respiratory hospital admissions: BAPHE reported an RR of 1.06 per 10 μg/m3 increase in PM2.5
-
2. Skin disease hospital admissions: RR = 1.12 per 10 μg/m3 (95% CI: 1.008–1.083), with a 2-day lag reflecting the delayed biological response between PM2.5 exposure and dermatological presentations
Assuming a log-linear exposure-response relationship, updated RR estimates were calculated as:

Where:
-
- β is the exposure-response coefficient (obtained as ln(RRBAPHE)/10),
-
- ∆C is the change in PM2.5 concentration relative to a counterfactual threshold (15 μg/m3), which is the WHO 2021 24-hour daily air quality guideline for PM2.5. Median PM2.5 concentrations were used consistently as the basis for ∆C throughout,
-
- e is the base of the natural logarithm.
RR and AR% were calculated for 4 scenarios: (1) the baseline period (satellite data); (2) the conflict period (satellite data); (3) the conflict period (ground-level median across all 5 sites); and (4) the conflict period (ground-level median from DWZ sites only (Chiyah, Hadath, and Choueifat, as defined in Study Location). The attributable risk percentage was derived as:

with 95% confidence intervals propagated from the BAPHE exposure-response uncertainty. RR and AR% were calculated for 4 scenarios: (1) baseline period (satellite); (2) conflict period (satellite); (3) conflict period (ground-level, all 5 sites); and (4) conflict period (ground-level, DWZ sites only).
As a secondary validation for respiratory outcomes, the WHO AirQ+ software was applied using the same PM2.5 inputs, its integrated exposure-response functions, and a baseline respiratory emergency admission incidence derived from BAPHE (6,790 cases/year across 378,485 residents ≈ 1,793 per 100,000 person-years), applied to the Southern Suburbs population of ~700,000. AirQ+ does not support skin disease outcomes; for this outcome, estimates relied exclusively on the BAPHE-derived function.
Results
Air Pollution Satellite Data
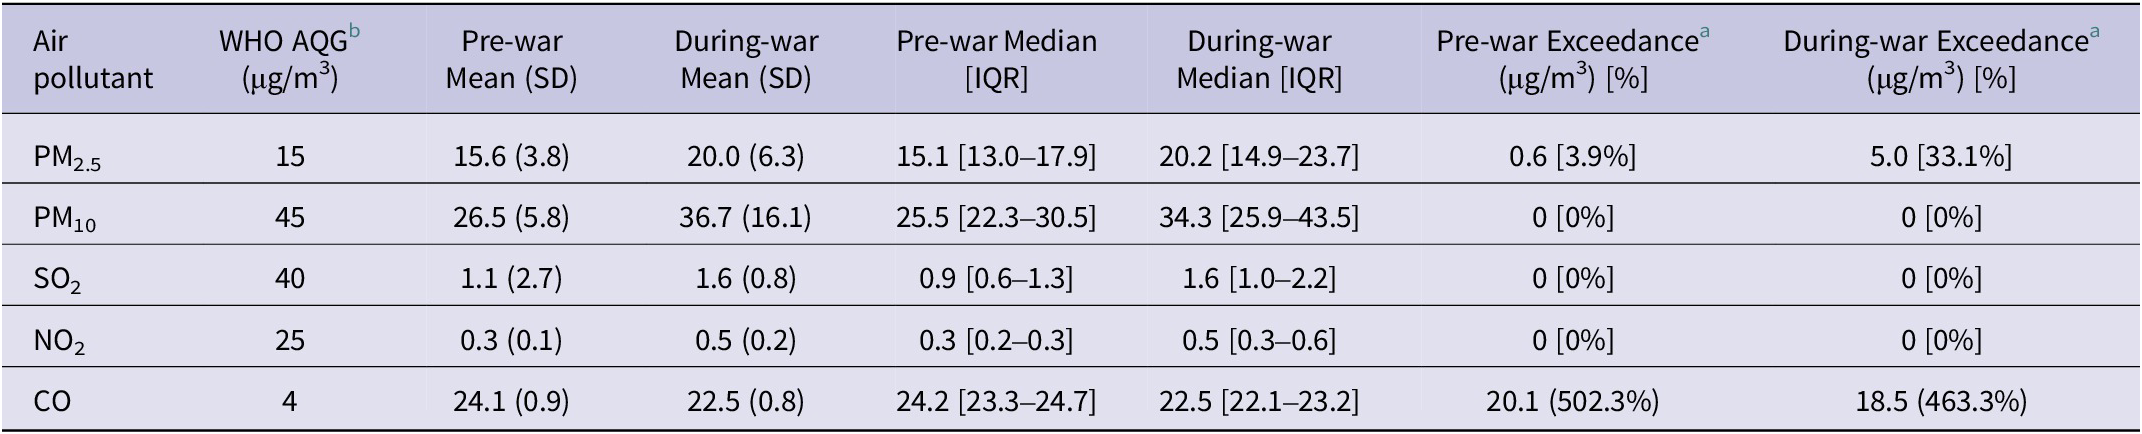
Table 1 summarizes the recorded levels of the 5 key pollutants by satellite, measured in Beirut before the war (from August 1 to September 22, 2024) and during the war (from September 23 to November 27, 2024). During the baseline period, the median concentration of PM2.5 was 15.1 μg/m3 [IQR: 12.99–17.92 μg/m3], marginally above the WHO 2021 24-hour daily air quality guideline (AQG) of 15 μg/m3. During the conflict period, the median PM2.5 rose to 20.2 μg/m3 [IQR: 14.9–23.7], with exceedances of the AQG occurring on 33.1% of hourly observations. Full descriptive statistics for all 5 pollutants are presented in Table 1. Of all 5 pollutants, only CO consistently exceeded the WHO AQG in both periods.
Comparison of satellite-recorded ambient air pollutant levels in Beirut before and during the 2024 conflict, relative to WHO air quality guidelines

Table 1. Long description
Table compares mean, median, and interquartile range of five air pollutants before and during the 2024 conflict. It also reports the amount and percentage by which each pollutant exceeded the WHO 24-hour air quality guideline.
a Exceedance of the AQG levels averaging time for 24 hours set by the WHO.
b AQG: World Health Organization Air Quality Guideline Levels.
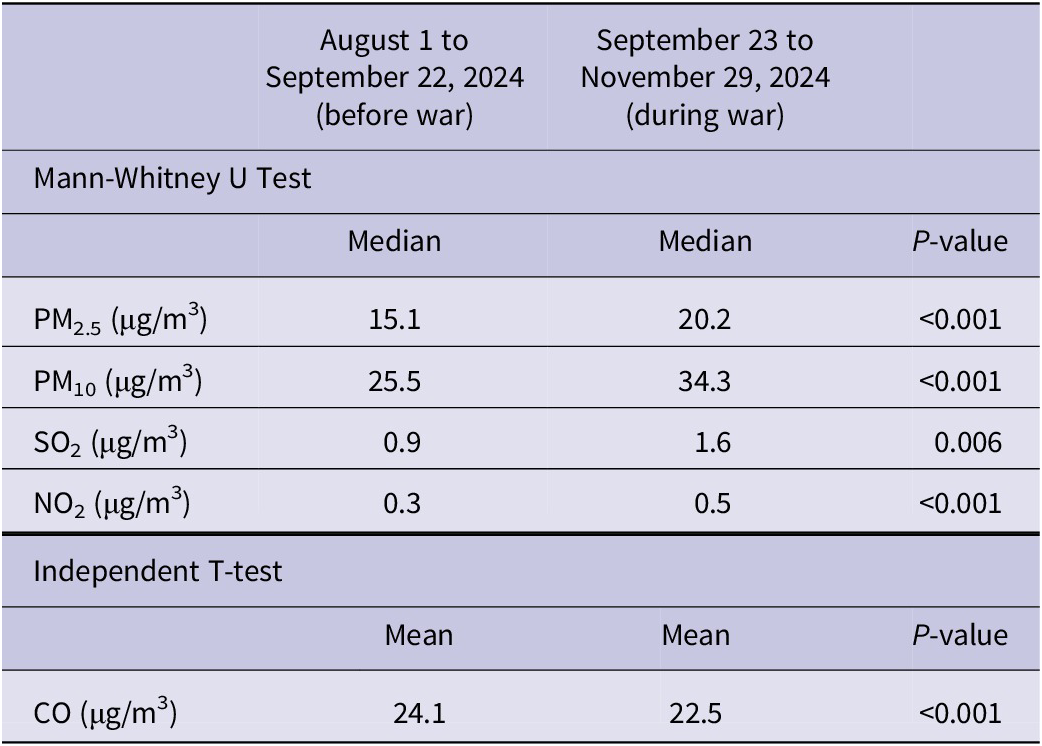
To assess changes in air pollution associated with the war period, we compared air quality levels before and during the conflict. We first examined the distribution of the data for each pollutant (PM2.5, PM10, NO2, SO2, and CO) using the Shapiro-Wilk test. Results indicated that PM2.5, PM10, NO2, and SO2 were not normally distributed (P < 0.05), while CO followed a normal distribution (P > 0.05). Given these results, we proceeded with different statistical tests based on the distribution of each pollutant. For PM2.5, PM10, NO2, and SO2, we used the Mann-Whitney U test to compare pollutant levels before and during the war. The results showed statistically significant increases in all 4 pollutants during the war (Table 2). For CO, which was normally distributed, we used the independent t-test and found a statistically significant decrease in CO levels during the war compared to the pre-war period.
Statistical comparison of air pollutant levels before and during the war period in Beirut (2024)

Table 2. Long description
Table presents median or mean concentrations of PM₂.₅, PM₁₀, SO₂, NO₂, and CO before and during the conflict, together with the statistical test used and corresponding p-values.
PM 2.5 Ground Level Measurements
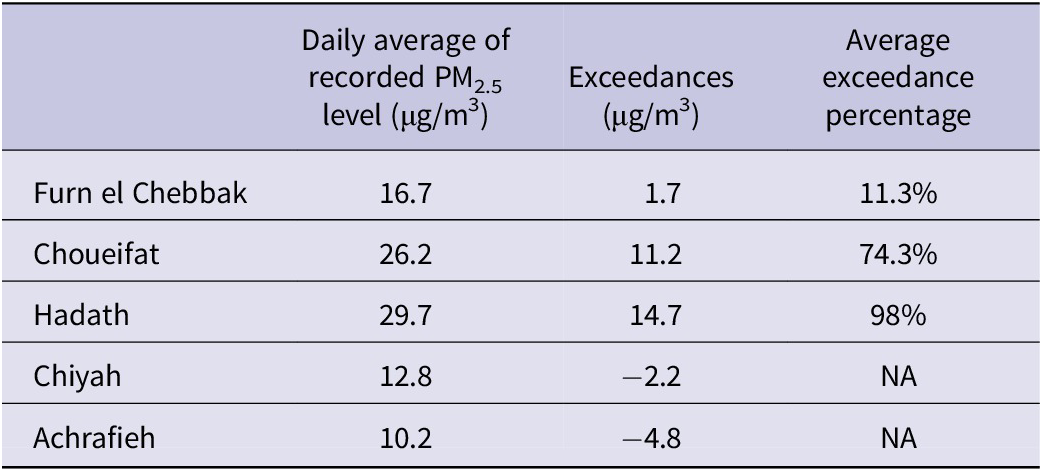
Ground-level PM2.5 concentrations recorded across the five monitoring sites during the 10-day measurement period (October 25 to November 3, 2024) are summarized in Table 3. Considerable variation was observed between sites. Hadath and Choueifat, both classified as DWZ sites, reported the highest daily average concentrations, at 29.7 μg/m3 and 26.2 μg/m3, respectively, representing exceedances of the WHO 2021 24-daily AQG of 98% and 74.3%, respectively. Alarmingly, these numbers are nearly double the WHO guidelines (15 μg/m3).
Daily average of recorded PM2.5 levels, exceedances, and average exceedance percentages above the AQG limit in the five measurement sites

Table 3. Long description
Table reports the daily average PM₂.₅ concentration at five monitoring sites, the amount each site exceeded the WHO 24-hour guideline, and the average percentage exceedance where applicable.
Relative Risk Calculation
Respiratory Diseases
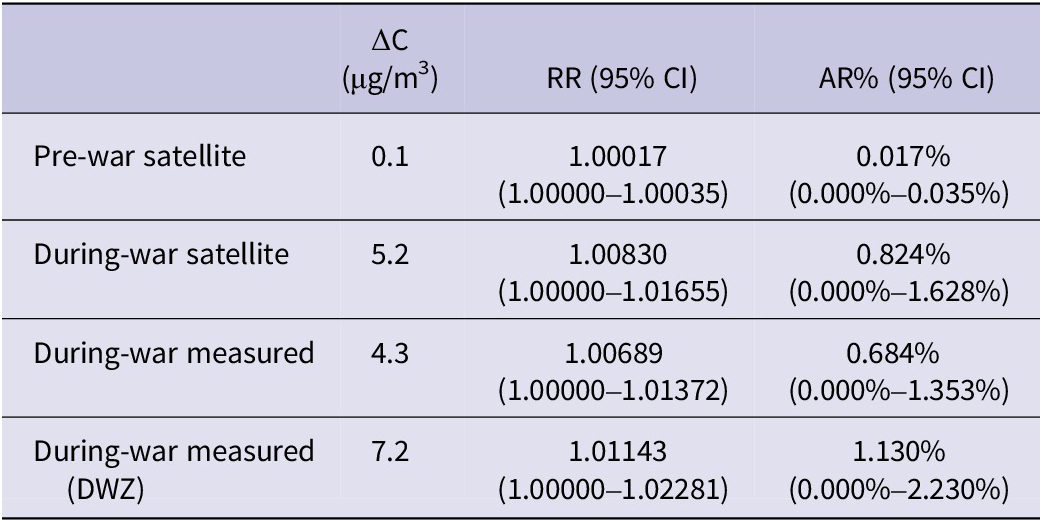
Table 4 presents the estimated relative risks (RR) and estimated attributable risk percentages (AR%) for respiratory hospital admissions associated with PM2.5 exposure, derived from the BAPHE exposure-response function (RR = 1.06 per 10 μg/m3; 95% CI: 1.000–1.032) applied to the observed changes in median PM2.5 concentration (ΔC) relative to the WHO 2021 24-hour daily AQG counterfactual of 15 μg/m3.
Estimated relative risks and attributable risk percentages for respiratory hospital admissions associated with PM2.5 exposure relative to the WHO 2021 24-hour air quality guideline

Table 4. Long description
Table presents PM₂.₅ concentration exceedances (ΔC), estimated relative risks (RR) with 95% confidence intervals, and attributable risk percentages (AR%) for respiratory hospital admissions using satellite, measured, and dust war zone exposure scenarios.
During the baseline period, the satellite-derived median PM2.5 of 15.1 yielded a ΔC of 0.1 μg/m3, corresponding to an RR of 1.00017 (95% CI: 1.00000–1.00035) and AR% of 0.017% (95% CI: 0.000%-0.035%). During the conflict period, the satellite-derived median PM2.5 of 20.2 μg/m3 yielded a ΔC of 5.2 μg/m3, corresponding to an RR of 1.0083 (95% CI: 1.0000–1.0166) and AR% of 0.82% (95% CI: 0.00%–1.63%). Ground-level measurements across all 5 sites produced a median of 19.3 μg/m3 (ΔC = 4.3 μg/m3; RR = 1.0069, 95% CI: 1.0000–1.0137; AR% = 0.68%, 95% CI: 0.00%–1.35%). For DWZ sites specifically, the median was 22.2 μg/m3 (ΔC = 7.2 μg/m3; RR = 1.0114, 95% CI: 1.0000–1.0228; AR% = 1.13%, 95% CI: 0.00%–2.23%), reflecting the higher PM2.5 burden in areas closest to documented strike zones.
Cross-validating using WHO AirQ+ produced consistent estimates. The satellite-derived conflict period RR from AirQ+ was 1.0099 (AR = 0.98%); ground-level all-sites RR was 1.0069 (AR% = 0.68%), and DWZ RR was 1.0114 (AR = 1.13%). This shows the convergence of BAPHE-based and AirQ+-based estimates across both data sources.
Skin Diseases
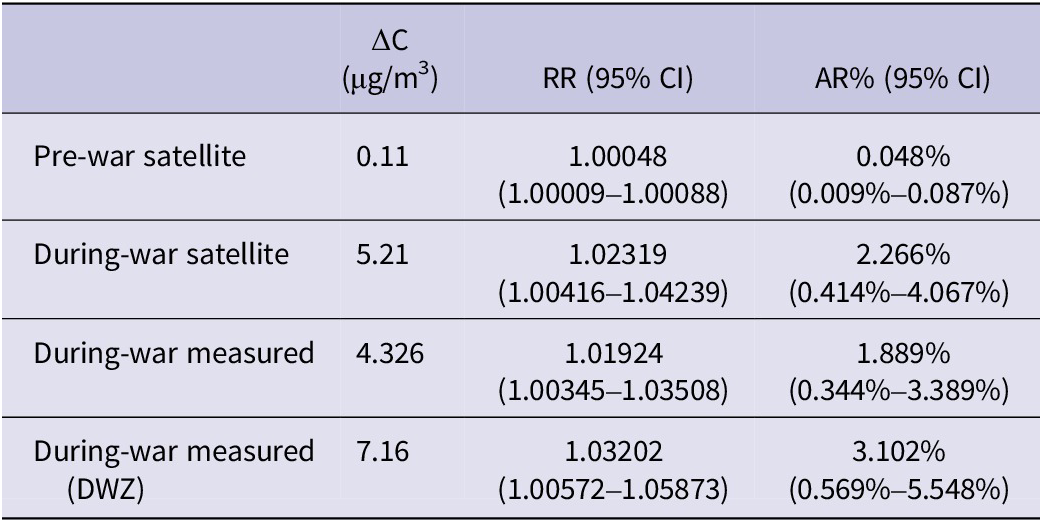
Table 5 presents the estimated RR and AR% for skin disease hospital admissions, derived from the BAPHE exposure-response function (RR = 1.045 per 10 μg/m3 with a 2-day lag; 95% CI: 1.008-1.083), as described in Relative Risk Estimation. The 2-day lag reflects the delayed dermatological response to PM2.5 exposure identified in the original BAPHE time-series analysis.
Estimated relative risks and attributable risk percentages for skin disease hospital admissions associated with PM2.5 exposure relative to the WHO 2021 24-hour air quality guideline

Table 5. Long description
Table presents PM₂.₅ concentration exceedances (ΔC), estimated relative risks (RR) with 95% confidence intervals, and attributable risk percentages (AR%) for skin disease hospital admissions using satellite, measured, and dust war zone exposure scenarios.
During the baseline period, the estimated RR was 1.00048 (95% CI: 1.00009–1.00088; AR% = 0.048%). During the conflict period, satellite-derived estimates yielded an RR of 1.0232 (95% CI: 1.0042–1.0424; AR% = 2.27%, 95% CI: 0.41%–4.07%). Ground-level measurements across all 5 sites produced an RR of 1.0192 (95% CI: 1.0035–1.0351; AR% = 1.89%, 95% CI: 0.34%–3.39%). DWZ sites showed the highest estimates: RR = 1.0320 (95% CI: 1.0057–1.0587; AR% = 3.10%, 95% CI: 0.57%–5.55%).
As AirQ+ does not support skin disease outcomes, no cross-validation was conducted for this outcome. These findings indicate a consistent positive association between elevated PM2.5 concentrations during the conflict period and estimated skin disease hospital admissions, with the strongest effects in DWZ areas.
Discussion
This study represents a risk attribution analysis conducted in a data-limited setting, exploring the potential environmental health implications of the 2024 conflict in Lebanon, with a focus on Beirut’s air quality and the associated risks for respiratory and dermatological outcomes. Given constraints on data availability and the study’s observational nature, the findings reflect suggested elevations in health risk rather than definitive causal estimates. The results suggest that the 2024 conflict was associated with significant increases in PM2.5, PM10, NO2, SO2, and CO, with differences between the pre-war and war periods statistically significant for all 5 pollutants (Table 2).
These findings align with evidence from other recent conflicts. Wei et al.Reference Wei, Yukhymchuk and Danylevsky 16 documented significant increases in PM2.5, PM10, and SO2 during armed conflict attributable to military activity and infrastructure damage. Research on the Ukraine-Russia war found PM2.5 and NO2 concentrations rose by 9.78% and 10.07%, respectively, in cities near the conflict,Reference Meng, Lu and Liu 8 which helps explain the elevated pollutant levels we observed at sites not directly struck by airstrikes. Similar patterns emerged in Mosul, Iraq, where residents faced extreme concentrations of particulate matter, SO2, NO2, and CO from war-caused fires, particularly the targeting of oil wells and sulfur stockpiles.Reference Altahaan and Dobslaw 17 Together, these studies demonstrate that armed conflicts consistently push pollutant concentrations well above baseline levels across diverse geographic settings.
PM2.5 median concentrations in Beirut rose from 15.11 μg/m3 [IQR: 12.99–17.92] pre-war to 20.21 μg/m3 [IQR: 14.93–23.72] during the conflict. Satellite-derived and ground-based PM2.5 measurements did not differ significantly (paired t-test, P = 0.0587), supporting the use of satellite data for monitoring air pollution in areas with limited ground-level infrastructure, a particularly valuable finding for conflict zones. However, satellite retrievals, particularly for CO, may be affected by cloud cover arising from elevated PM2.5 and military emissions,Reference Borsdorff, Andrasec and Hu 18 and should be interpreted with this caveat. The observed decrease in CO concentrations during the conflict period may also reflect changes in population mobility and transportation patterns, including reduced traffic activity in heavily affected areas due to displacement, road closures, and security concerns. Alternatively, the finding may partly reflect uncertainties in satellite retrievals under conflict-related atmospheric conditions. As such, the CO results should be interpreted cautiously and warrant further investigation using ground-based measurements where available.
These context-specific limitations underscore the need for expanded ground-level monitoring in Lebanon. Though the country established an Air Quality Monitoring Network (AQMN) in 2004, it was suspended in 2019 due to budget cuts and has not resumed operations.Reference Whaibeh, Tayeh and Farah 12 The ongoing AWAIR project, led by HERA and the University of Balamand, aims to address this gap by installing 80 low-cost monitors across schools, hospitals, and other social spaces, with open-access real-time data to inform future environmental policy. 19
The hidden costs of armed conflict often manifest as severe health outcomes linked to wartime air pollution. Elevated PM2.5 and NO2 exposure is associated with asthma, bronchitis, and eye irritation, and an assessment of the Syrian war found that deaths attributable to air pollution increased by 17% during the 2010-2017 conflict period.Reference Gaafar 20 Conflict-generated pollution frequently includes carcinogenic compounds, heavy metals, dioxins, and benzene, placing exposed populations at heightened risk of chronic and inflammatory disease. Skin conditions are a well-documented consequence of air pollution, including allergic and contact dermatitis and other inflammatory reactionsReference Ngoc, Park and Lee 21; Petruccelli et al.Reference Petruccelli, Goldenbaum and Scott 22 documented significantly elevated rates of skin rashes among Gulf War troops exposed to heavy smoke. Quantitative evidence supports these associations. Ngoc et al.Reference Ngoc, Park and Lee 21 found that a 10 μg/m3 increase in PM2.5 raises the probability of skin disease by 1.6%, with a higher risk in vulnerable populations, particularly children. Comparable increases in PM2.5 and NO2 have been linked to an 18% elevation in chronic obstructive pulmonary disease incidence.Reference Park, Kim and Lee 23
Our risk attribution analysis suggests that the wartime increase in PM2.5 was associated with modest but meaningful estimated elevations in risk for both outcomes. For respiratory admissions, the estimated attributable fraction rose from approximately 0.02% pre-war to 0.82% during the conflict (satellite-based), with ground-level DWZ estimates reaching 1.08%. These patterns remained consistent across BAPHE-based and AirQ+ approaches. For skin diseases, the estimated attributable fraction reached up to 3.10% at DWZ sites, consistent with systematic evidence linking PM2.5 to allergic and inflammatory skin conditions.Reference Ngoc, Park and Lee 21 Aside from skin inflammation and oxidative stress caused by pollution, other environmental factors such as displacement, overcrowded housing facilities, poor sanitation, inadequate supply of drinking water, and lack of access to medical care could further worsen skin health problems due to increased vulnerability to infections, allergies, and skin inflammations associated with high exposure to PM2.5. This estimate is likely conservative, as it does not account for dermatological conditions arising from poor housing, limited water access, and hygiene deficits experienced by the over 1.2 million displaced persons during the conflict.Reference Al-Hindi, Aker and Al-Delaimy 24 , Reference Fawaz 25
Limitations
While this study provides important insights into the impacts of armed conflict on air quality and associated health outcomes in Beirut, several important methodological constraints unique to conflict settings must be explicitly acknowledged when interpreting these findings. First, the behavioral changes and population displacement driven by the conflict are deeply confounded with pollution exposure: altered mobility patterns, evacuation, and shifts in indoor and outdoor activity co-occurred with the pollution events, making it impossible to isolate the contribution of PM2.5 from other simultaneously occurring disruptions. Second, the chemical composition of conflict-generated PM2.5 almost certainly differs from the routine urban PM2.5 on which the BAPHE exposure-response functions were derived. Bombardment, burning infrastructure, and military activity generate a chemically complex mixture, potentially including metals, dioxins, and combustion by-products, whose health consequences cannot be assumed to follow the same dose-response relationships as regular urban particulate matter. Without chemical speciation data from the conflict period, this remains an irreducible uncertainty. Third, the massive psychosocial, traumatic, and displacement-related health burdens co-occurring with the conflict period constitute additional confounders that a risk attribution framework is not designed to disentangle. Fourth, the study has a narrow temporal scope, with data collected over 10 days only and focused solely on PM2.5, which may not fully capture Beirut’s pollution levels during the conflict, especially since airstrikes continued beyond the initial measurement period. As such, a longer monitoring window would have provided a more robust assessment of pollution trends and sustained PM2.5 elevations. Fifth, our study was restricted to 5 measurement sites, which, though strategically placed near locations affected by the air strikes, may not fully represent citywide air pollution. More distributed sites could have improved the generalizability of our results.
While these factors would represent serious threats to validity in an etiological epidemiological study, in a risk attribution analysis, they introduce uncertainty into the magnitude of estimates rather than invalidating the approach outright. Collectively, these considerations mean that the estimates presented here represent plausible, order-of-magnitude approximations rather than precise causal attributions, and should be communicated as such.
Conclusion
This study contributes to the literature on the potential health consequences of armed conflicts and war pollution. Recent reports from conflict areas around the world paint a consistent picture: armed conflicts lead to elevated levels of air pollutants. These findings were also evident in the results of our study, which recorded a significant increase in PM2.5 levels during the armed conflict period. As a result of this surge in air pollution, cases of respiratory and skin diseases also significantly increased, as shown in the comparison of attributable risks and relative risks pre- and during armed conflict. This is a serious public health concern, as previous studies have shown that constant exposure to air pollutants is linked to severe health consequences, ranging from acute respiratory infections to more serious chronic diseases and cancer.
In addition to proving empirical evidence that conflicts can worsen air pollution and pose significant quantifiable risks to public health, the current study underscores the need for:
-
1. Enhanced environmental monitoring in conflict-affected and conflict-prone areas, combining monitoring systems and low-cost ground-level sensors to ensure accurate pollution surveillance.
-
2. Protective public health measures, including rapid multi-channel emergency alerts for vulnerable patient populations and for health care facilities to anticipate increases in certain health conditions.
-
3. Further conflict-sensitive environmental research to assess cumulative and long-term exposures to various air pollution across multiple measurement sites and over longer periods of time, especially since the bombing is still ongoing and many people have returned to their homes, which are located in environmentally deteriorated areas.
The environmental impact of warfare cannot be ignored in public and environmental health emergency planning. Finally, war-driven environmental degradation is not merely collateral damage but a central ongoing determinant of national health that requires more attention.
Author contribution
AAN: Software, validation, formal analysis, data curation, writing—original draft, writing—review and editing; EW: Methodology, validation, formal analysis, writing—original draft, writing—review and editing; RH: Validation, methodology, writing—review and editing; JAH: Investigation, resources, data curation, project administration; GM: Data curation; KAT: Resources, writing—review and editing; WF: Resources, writing—review and editing; MA: Resources; NZ: Investigation, writing—review and editing; EM: Formal analysis, writing—original draft, writing—review and editing; JPJ: Writing—original draft; MZ: Writing—original draft; GAT: Conceptualization, writing—review and editing, supervision; MM: Conceptualization, methodology, writing—review and editing, supervision.
AAN and EW contributed equally as co-first authors.
RH contributed as second author.
GAT and MM contributed equally as co-last authors.
Funding statement
This research did not receive any specific grant from funding agencies in the public, commercial, or not-for-profit sectors.