Introduction
Increases in productivity by dairy production systems in the last decades were generally established with a profound increase in nitrogenous emissions to the environment. A large part of these emissions depend on nitrogen (N) excreted by ruminants. More recently, the major contribution of enteric methane (CH4) emissions to global CH4 emissions and its global warming potential was identified (Steinfeld et al., Reference Steinfeld, Gerber, Wassenaar, Castel, Rosales and de Haan2006). From this viewpoint, nutritional management aiming to mitigate N and CH4 emission per unit of milk (with or without maintaining cow productivity) is desirable. This contribution explores the relationship between N excretion and CH4 emission in response to nutritional measures in intensive dairy systems. It is discussed why a detailed representation of rumen function is a prerequisite to explaining and making use of variation in (the type of) N excretion and in CH4 emission. It is also considered how these emissions may be quantified by the use of predictive models, or by readily available information on-farm.
Nutritional effects on enteric CH4
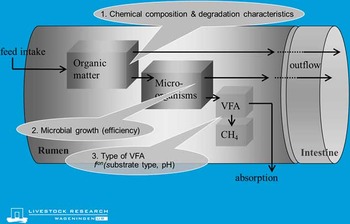
Observed CH4 emission in cattle ranges from 2% to 12% of gross energy intake (Johnson and Johnson, Reference Johnson and Johnson1995), and depends on the type of cattle and animal characteristics (e.g. residual feed intake), and the type of diet or production system. Within type of cattle, the main determinant of enteric CH4 emission is dry matter (DM) intake and the rate of enteric rumen fermentation of dietary organic matter (OM). A substantial part of observed variation in enteric CH4 remains unexplained by DM intake however, caused by variation in the rate of methanogenesis as a function of various nutritional and animal factors. Rumen fermentation of OM, efficiency of microbial growth and type of fermented substrate converted into volatile fatty acids (VFA) are main drivers of the amount of excess hydrogen that becomes available as substrate for methanogens (Figure 1). Very low amounts of hydrogen are emitted from the animal. Although there are alternative sinks of hydrogen and some alternative microbial metabolic pathways exist that can affect hydrogen availability for methanogenesis (Ellis et al., Reference Ellis, Dijkstra, Kebreab, Bannink, Odongo, McBride and France2008; Janssen, Reference Janssen2010), a reasonable assumption is that (under normal feeding conditions) almost all excess hydrogen, generated with the conversion of feed substrate into VFA, eventually becomes converted into CH4. This means that the net excess of hydrogen and CH4 production are very closely associated with the amount and profile of VFA produced (Mills et al., Reference Mills, Dijkstra, Bannink, Cammell, Kebreab and France2001; Bannink et al., Reference Bannink, Van Schijndel and Dijkstra2011). Fat and long-chain fatty acids do not become fermented and do not deliver hydrogen as a substrate for CH4 production. By hydrogenation of unsaturated fatty acids fat can actually be a relatively small sink of hydrogen and have a rather negative effect on the amount of excess hydrogen and CH4 formed (Mills et al., Reference Mills, Dijkstra, Bannink, Cammell, Kebreab and France2001). From the remaining fractions in fermented OM, protein delivers least CH4 followed by starch with 10% more compared with protein, and by sugars and cell walls with around 50% more CH4 being produced per unit of substrate converted into VFA (Bannink et al., Reference Bannink, Kogut, Dijkstra, France, Kebreab, Van Vuuren and Tamminga2006 and Reference Bannink, France, Lopez, Gerrits, Kebreab, Tamminga and Dijkstra2008; Dijkstra et al., Reference Dijkstra, Oenema and Bannink2011).
Rumen processes contributing to methane emission.

Nutritional measures that change the amount and profile of substrates that become fermented in the rumen must hence be expected to affect CH4 emission. However, with manipulation of CH4 emission by nutritional means, some potential digestive trade-offs need to be kept in mind. High-fat or high-starch diets may reduce CH4 emission per kg of feed intake or per kg of milk produced, but they also may create less favourable rumen fermentation conditions for fibrolytic bacteria, reducing fibre digestion. A higher DM intake (e.g. by a change in diet composition with more concentrates) leads to a higher milk yield which reduces the amount of CH4 per unit milk produced if digestibility would remain unaffected. However, with a higher DM intake the rate of OM fermentation increases and the rumen environment may become more acidic limiting fibre degradation and diet digestibility, reducing feed utilization and the marginal increase in milk yield, and as a consequence limiting the reduction in CH4 per unit milk. Therefore, there are some potential trade-offs such as a decline of rumen degradability of feed substrates, mainly the fibre fraction of OM, because of rumen acidification and a shorter residence time in the rumen as a result of higher DM intake and faster rumen passage. These trade-offs limit rumen and total digestion and may lead to a reduced utilization of feed for milk production. Such a reduced digestibility partly counteracts the dilution effect of the amount of CH4 originating from feed required for maintenance functions per kg milk with increase of milk yield (Mills et al., Reference Mills, Dijkstra, Bannink, Cammell, Kebreab and France2001; Bannink et al., Reference Bannink, Van Schijndel and Dijkstra2011). However, a higher DM intake and rate of OM may be accompanied by a shift towards a more propionate-oriented fermentation profile that reduces the amount of CH4 produced and compensates again the reduced diet digestibility with increase in DM intake.
In summary, variation in CH4 produced per kg of DM intake or per kg of milk can be explained from general animal characteristics such as feed intake, feed digestion and dietary characteristics that affect OM fermentation in the rumen and the large intestine, and several trade-offs are included in the mechanisms of fermentation and digestion.
More specific nutritional effects on CH4 may be considered, such as dietary inclusion of alternative hydrogen sinks, or perhaps even the stimulation of bacteria that compete with methanogens for hydrogen utilization if maintaining their presence in the rumen is feasible. Such nutritional measures are worthwhile to take into account if they demonstrably work in vivo. For example, Van Zijderveld et al. (Reference Van Zijderveld, Gerrits, Dijkstra, Newbold, Hulshof and Perdok2011) found a prolonged CH4 reducing effect of nitrate as a hydrogen sink in lactating cows. With up to 20% reduction of CH4 by addition of nitrate to the diet no increase of methemoglobin in blood plasma was observed. Hence, the inclusion of nitrate in the diet seems to be a feasible mitigation measure with an assured mode of action that promises general efficacy, without health consequences for the dairy cow when carefully managed, and without the risk of compromising milk quality.
Nutritional effects on N excretion
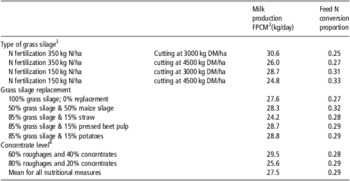
The excretion of N reduces when roughages or concentrates are fed with a decreased ratio of N content to energy value (net energy of lactation, NEL). Under most production conditions, the N retained in milk protein is mainly determined by NEL. The marginal effect of an extra amount of digested protein on milk protein yield, as established in single studies, is about three times lower than the overall effect on milk protein yield that becomes apparent across studies with different levels of NEL intake (Cant, Reference Cant2005). The retention of N therefore strongly depends on the level of feed intake, on the chemical composition of feed and on the digestibility of the chemical fractions determining NEL. In particular, the carbohydrate fractions and protein have a variable contribution to NEL depending on their extent and site of digestion (digestion by microbial fermentation v. digestion by host enzymes). Although the potential to manipulate dietary characteristics depends on farming conditions and farming strategy (e.g. milk yield per animal pursued, on-farm available roughages, costs of feed purchase), there is in principle large potential for nutritional measures to lower N : NEL ratio to reduce N intake, to increase the fraction of ingested N that is retained and, as a consequence, to decrease the excretion and emission of N. Recently, the effect of N reducing nutritional measures was determined by Dijkstra et al. (Reference Dijkstra, Oenema and Bannink2011) using a mechanistic modelling approach. The study covered a range of N reducing nutritional measures in feeding mid-lactation dairy cow. Nutritional measures included changes in grassland management (N fertilization rate, stage of grass cutting) and in the level of concentrate feeding, and the replacement of grass silage by maize silage, beet pulp, straw or potatoes (Table 1; assumptions based on Reijs, Reference Reijs2007). Feed intake was calculated for an average Dutch dairy cow according to the Dutch system for feed intake capacity (Blok et al., Reference Blok, André, Brandsma, Van Straalen and Van Duinkerken2007; Zom et al., Reference Zom, André and Van Vuuren2012). Calculated N excretion strongly varied from 200 to 550 g N/day, and from 10 to 18 g N/kg fat and protein corrected milk (FPCM). Simulations show that rumen function plays a major role in this variation, by its effect on the extent of N digestion and site of N excretion (urine v. faeces) and by the occurrence of trade-offs such as an altered digestion and NEL (Dijkstra et al., Reference Dijkstra, Oenema and Bannink2011).
Description of 40 model simulationsFootnote 1 including nutritional measures which reduce N excretion, and predicted milk yield and conversion of feed N to milk N averaged per nutritional measure, based on results from Reijs (Reference Reijs2007) and Dijkstra et al. (Reference Dijkstra, Oenema and Bannink2011)

1 Dry matter intake of the complete rations was estimated using the Dutch ‘Dairy CowModel’ (Blok et al., Reference Blok, André, Brandsma, Van Straalen and Van Duinkerken2007; Zom et al., Reference Zom, André and Van Vuuren2012).
2 FPCM, fat and protein corrected milk (4.00% fat, 3.32% protein and 4.60% lactose).
3 Indicated are a high v. a low rate of N fertilization with artificial fertilizer (350 v. 150 kg N/ha) for an early v. a late cut of grass (3000 v. 4500 kg dry matter/ha) for a first spring cut of the grass sward for silage making. Besides artificial N fertilizer an initial application of an additional 70 kg N/ha with animal manure was assumed.
4 Concentrate composition was assumed constant.
The N : NEL of concentrates can easily be reduced by a selection of N-poor feed ingredients. Practical feasibility of changes in the selection of feed ingredients mainly depends on limitations put in place by cost, targets for NEL, by nutrient-specific critical levels for inclusion in the diet (e.g. dietary fat content), or other restrictions such as manure legislation (e.g. phosphorous content). Without exceeding any critical level of, for example, dietary fat content or rumen acidification potential, negative trade-off effects may remain limited in size. Nevertheless, there are some effects which may be of importance but do not become apparent from tables of feeding values, from feeding systems applied in practice, or from constraints and safety margins adopted with feed formulation.
For example, rumen starch digestion is subject to variation with the amount of starch fed. Variability in rumen digestion of a starch source means a variable contribution of that source to rumen microbial N synthesis, which is of importance to take into account when aiming for a minimum N : NEL and protein delivery still matching the cow's requirements. With an increase in dietary starch content and of starch intake from 4.0 to 6.5 kg/day, Oba and Allen (Reference Oba and Allen2003) observed an increase of rumen digestion of starch from 59% to 71% with high-moisture maize (absent with ground maize). The finding for high-moisture maize may reflect a higher amylolytic activity sustained in the rumen by a higher starch intake level. It cannot be explained from differences in DM intake (similar), fractional passage rate of rumen starch (higher), or the rumen starch pool (similar). Contrasting with this, with ground maize no such differences in rumen starch digestibility were found. In addition, Van Vuuren et al. (Reference Van Vuuren, Hindle, Klop and Cone2010) did not observe an effect of maize starch intake (2.1 v. 6.2 kg/day) on rumen starch digestibility. Although in situ fractional starch degradability was numerically 25% lower on high starch intake, this effect seems to have been compensated by a numerically 23% lower fractional passage rate, explaining the similar rumen starch digestion at low and high starch intake (68% and 66%, resp.). In this case, a stimulatory effect of a high starch intake on the rumen pool size of amylolytic bacteria is not needed to explain observed results. Existence or absence of a trade-off of the level of starch intake probably has to be explained from the combination of factors of intrinsic degradation characteristics of starch, rumen retention time of starch and rumen pool sizes of starch and amylolytic bacteria.
Next to potential trade-offs of changes in the proportion of starch in the concentrate fraction of the diet, a change in the level of feed intake may cause trade-offs with respect to rumen and total tract digestion, thereby affecting the utilization of digested N by the cow. Roughage intake, chewing and rumination behaviour and rumen fermentation conditions can be affected and are relevant because of their influence on rumen passage rate, rumen content and activity of the amylolytic and fibrolytic microbiota (Dijkstra et al., Reference Dijkstra, Neal, Beever and France1992). A higher feed intake level reduces rumen, as well as faecal, fibre degradation. This is demonstrated in a classical study by Robinson et al. (Reference Robinson, Tamminga and Van Vuuren1987), who combined measurements of the effect of an increase in starch content in concentrate (from 8% to 32% in concentrate; in effect from 5% to 21% in dietary DM) with an increase in DM intake (from 6 to 24 kg/day), of a diet consisting of one-third of hay and two-thirds of concentrate. Increasing dietary starch content decreased faecal NDF digestibility from 64% to 60% (from 58% to 53% for the rumen), compared with a decrease from 71% to 57% (from 65% to 49% for the rumen) with an increase of DM intake (average starch content). Part of the effect of an increase of dietary starch on NDF digestion may have been caused by a lower rumen pH (pH reduction from 6.6 to 6.0) because fibrolytic activity is generally assumed to become inhibited below pH values of 6.3 (Dijkstra et al., Reference Dijkstra, Neal, Beever and France1992). An even stronger effect of the dietary content of rapidly degradable starch was reported by Van Vuuren et al. (Reference Van Vuuren, Hindle, Klop and Cone2010). With an increase in dietary starch from 12% to 33%, faecal NDF digestibility decreased from 84% to 75%, whereas there was no effect on rumen pH. Therefore, in contrast to the results of Robinson et al. (Reference Robinson, Tamminga and Van Vuuren1987), rumen pH seems to have not been the reason for the decline in NDF digestibility. Still, in situ fractional degradation rate of NDF was decreased, reflecting a less available NDF source for fibrolytic bacteria with higher starch intake, and a lower rumen NDF digestion despite the slower passage from the rumen.
For roughages, both exchange of maize for grass, and altered grassland management (lower N fertilization rate, late cutting or postponed grazing for reduced N content) can strongly reduce N : NEL. Such measures have important trade-offs with roughage intake, feeding value, milk production and N excreted per unit of milk. A lower N fertilization rate and extended cutting of grass will lower N : NEL in grass, which can almost be halved when considering extremes (Bannink et al., Reference Bannink, Smits, Kebreab, Mills, Ellis, Klop, France and Dijkstra2010; Dijkstra et al., Reference Dijkstra, Oenema and Bannink2011). Simultaneously, this strategy may lower grass NEL and result in a lower feed intake of grass. When compensated for with an increased concentrate allowance to maintain milk yield, a trade-off to take into account may be less favourable rumen fermentation conditions for fibrolytic bacteria, reducing roughage digestion (similar to what was discussed above for the effect of starch intake in the study of Robinson et al., Reference Robinson, Tamminga and Van Vuuren1987). Such a trade-off may partly off-set the reduction in N excretion per kg of milk achieved. Nevertheless, with grass as the main portion of a dairy cow diet, moving towards more extensive grassland management (less N fertilizer, later cutting), or to a partial exchange of grass for maize, will still have a profound effect on N intake and N excreted per kg FPCM (Dijkstra et al., Reference Dijkstra, Oenema and Bannink2011).
Quantifying N excretion and CH4 emission
Enteric CH4
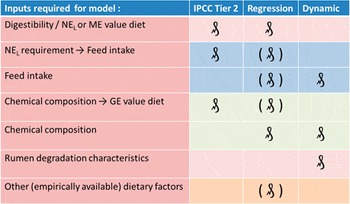
Rate of enteric CH4 emission is difficult to monitor on-farm and probably even more difficult to relate to the systematic effect of a specific nutritional measure taken by the farmer. So far, quantification of effects on enteric CH4 relies on prediction models. Various models are available to quantify enteric CH4, varying from the IPPC Tier 2 approach which assumes a constant 6.0% of gross energy intake being emitted as CH4, recently updated to 6.5% (IPCC, 2006), to empirical models derived from large data bases by regression techniques (model evaluation and review by Ellis et al., Reference Ellis, Dijkstra, Kebreab, Bannink, Odongo, McBride and France2008), to dynamic models which adopt a mechanistic approach by representing rumen fermentation processes and methanogenesis (e.g. Bannink et al., Reference Bannink, Van Schijndel and Dijkstra2011). The IPCC Tier 2 method is commonly used in national inventory reports but it suffers from the problem that it assumes the proportion of ingested gross energy emitted as CH4 is constant. The Tier 2 method hence only reflects the effects of DM intake level on CH4 emission, neglecting all variation that is unrelated to DM intake; variation in the site of digestion of carbohydrates and protein, and the lack of fermentation of dietary fat. With the purpose to address the latter unexplained part of variation in enteric CH4, modelling exercises have been conducted which delivered various quantitative models that diverge in the level of complexity represented in them, ranging from an empirical description of data sets with observations at the animal level (reviewed by Ellis et al., Reference Ellis, Dijkstra, Kebreab, Bannink, Odongo, McBride and France2008), to the representation of the mechanisms of microbial activity and methanogenesis in the rumen (e.g. Dijkstra et al., Reference Dijkstra, Neal, Beever and France1992; Mills et al., Reference Mills, Dijkstra, Bannink, Cammell, Kebreab and France2001; Bannink et al., Reference Bannink, Van Schijndel and Dijkstra2011; Figure 1). It remains open to discussion which of these models is best used for what purpose. In farm scale or regional monitoring, the choice often made is to use the Tier 2 approach or another empirical model to quantify enteric CH4 (Schils et al., Reference Schils, Olesen, Del Prado and Soussana2007), although there are exceptions to this (Beukes et al., Reference Beukes, Gregorini and Romera2011). A commonly used argument for empirical models or the Tier 2 approach to be the preferred choice is that these models would require a lower number and more easily accessible inputs. Evaluation of these empirical models adopted in farm-scale analyses against independent observations of enteric CH4 is scarce or even absent. What has been reported seems to indicate their prediction capacity leaves room for improvement (Ellis et al., Reference Ellis, Bannink, France, Kebreab and Dijkstra2010). More complex models may serve in delivering more appropriate estimates of enteric CH4 because they imply a logic with respect to the representation of mechanisms of rumen fermentation and occurrence of trade-offs at the rumen level (instead of the animal level) can be identified and quantified. Complex models might be considered to require too many inputs, introducing uncertainty with each one of them, which adds to prediction error and also making them cumbersome to apply. Although indeed more inputs are required compared with empirical models, the presumption that these inputs in itself create more complexity cannot easily be made. A closer inspection of the type of inputs required by various types of models of enteric CH4 makes clear that all model types make use of all input types (Table 2). Because it is needed for calculations on NEL and feed requirement, all models relating feeding value to CH4 make use of an input which relates to a digestibility characteristic of the feed. The use of more complex models suffers from a lack of data for the in situ rumen degradation characteristics, whereas data on NEL are generally available (Bannink et al., Reference Bannink, Van Schijndel and Dijkstra2011). The more specific the case studied the more important these estimates become (e.g. Ellis et al., Reference Ellis, Dijkstra, France, Parsons, Edwards, Rasmussen and Kebreab2012). All models somehow have to address chemical composition of the diet and prediction equations are available for NEL, but so far equations are lacking for the estimation of in situ degradation characteristics. However, even with prediction equations available for estimation of NEL, the error of estimation may still be substantial. Further, the full list of inputs required by a complex model such as that used by Bannink et al. (Reference Bannink, Van Schijndel and Dijkstra2011) or Beukes et al. (Reference Beukes, Gregorini and Romera2011) should not be considered an indication of higher complexity of these inputs compared with those needed by empirical models. Several dietary chemical fractions are complementary to each other simplifying their estimation, by using generic or table values, reducing the number of uncertain inputs. From this respect, the input requirements of the various quantitative modelling approaches is not so fundamentally different as it appears from the type and number of equations involved in the mathematical description of more complex models.
Overview of the type of inputs required by various categories of prediction models relating feeding value and feed requirement to enteric methane, with input type categorized according to shade of grey

A distinction is made between the Tier 2 approach according to IPCC methodology for performing inventories on greenhouse gas emissions (IPCC, 1997), empirical regression equations which include feeding value and a variety of other explanatory factors, and dynamic, mechanistic models which represent the mechanisms of the enteric fermentation process. The symbol ( ) indicates that this type of model input is used by a model category, whereas this symbol between brackets indicates the model input is conditional and depends on details of the model representation.
The differences between modelling approaches strongly relates to the origin of inputs chosen to be used (at the diet or ingredient level, at the animal and digestive level, or at the rumen fermentation level) and how these are handled by the model. The model of choice for quantifying CH4, hence depends on the origin of data, the specific aim(s) the model can be used for, and the level of detail required to answer the questions posed. If the aim is to have a detailed insight in the effects of nutrition on enteric fermentation and its consequences for CH4 emission next to diet digestibility, N excretion and cow productivity, rumen details matter. Empirical models cannot be used to deliver details on the rumen or even the digestive level, with the Tier 2 approach perhaps being least applicable in this respect because it only generates a generic value for CH4 emission based on gross energy intake. It is not very specific which is in contrast to the aim to establish differences between farm management options directed at lowering CH4 emissions.
N excretion
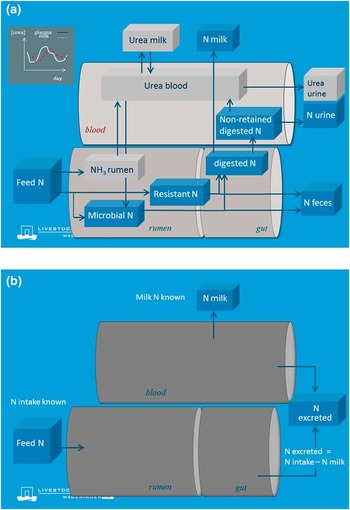
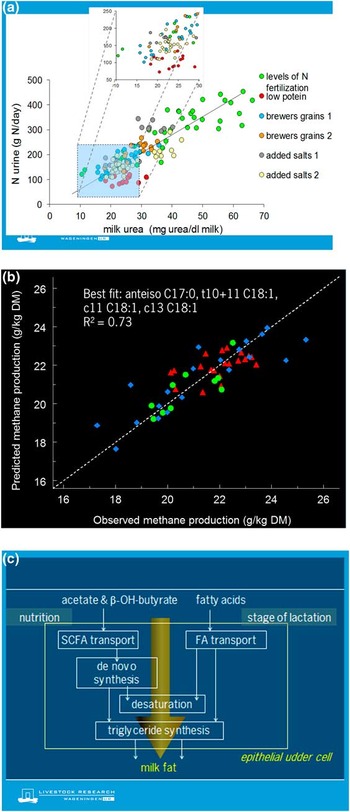
Quantifying the details of N digestion and N metabolism, and the variation in N and urea flows in a dairy cow is complex. Similar to what was discussed for CH4, the rumen also plays an important role in the extent and site of N digestion, in microbial protein synthesis (the main digestible protein source for a dairy cow) and in recycling of blood urea to the rumen (Figure 2a). As a result, variation in rumen function contributes to variation in the partitioning of excretion of ingested, non-utilized N in urine and faeces. In contrast to quantifying CH4, quantifying N excretion has the advantage that actual observations are available on N flows at the animal level, viz., feed intake, feed requirement, diet composition and milk protein yield. Under assumption of zero N balance, these observations allow a quick estimate of N excreted (N excreted equal to N intake minus N milk; Figure 2b). Assumption of a zero N balance will bias estimated N excretion but the size of error remains small, particularly when long periods are considered (e.g. whole lactation). For specific relatively short periods of time (e.g. first weeks after calving, late pregnancy) bias may be significant however, and lead to under- or overprediction of N excretion in the order of 50 g N/day (Van Knegsel et al., Reference Van Knegsel, Van den Brand, Dijkstra, Van Straalen, Heetkamp, Tamminga and Kemp2007), which may exceed 10% of estimated N excretion. Bias can partly be prevented by taking into account a priori the physiological state of the cow and make assumptions on N balance. But, in combination with uncertainty about the estimates on feed intake and dietary composition (generally no observations available), error may remain substantial when estimating momentary N excretion for certain stages in the lactation cycle.
Nitrogen and urea flows in the dairy cow (a) and the approximation of N excretion by a nitrogen balance calculation (b).

Most variation in N excretion is because of variation in urea excretion in urine. Therefore, it is most important to quantify this most variable part of N excretion. Milk urea content reflects urea concentration in blood, and hence is an indicator of urea flow through blood to urine (Figure 2a). Blood urea levels are the net result of the amount of urea produced, urea excreted by the kidneys and urea recycled to the gastrointestinal tract (Reynolds and Kristensen, Reference Reynolds and Kristensen2008). Although, milk urea appears closely associated with total excretion rate of N and urea in urine, over a wide range of values at least, some dynamical aspects of the aforementioned processes are reflected in blood and milk urea concentrations (Spek et al., Reference Spek, Dijkstra, Van Duinkerken and Bannink2013). The principal concern remains that a concentration (milk urea content) is used as an approximation of urea flux (urea excretion). Accuracy of calculating N excretion from milk urea will be discussed further in the section related to on-farm indicators.
Interactions between N excreted and CH4 emitted
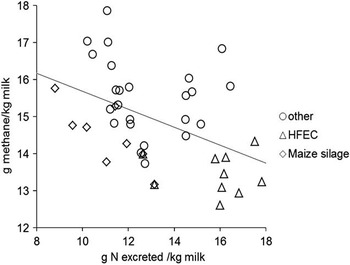
Because rumen function has an important influence on feed digestion, and associated N excretion and enteric CH4 emission per kg FPCM, investigation of the effect of nutritional measures on emissions requires that details on rumen fermentation mechanisms are taken into account. This can be achieved by making use of a dynamic, mechanistic model of fermentation and digestive processes in the gastrointestinal tract of a cow. Such a model (Dijkstra et al., Reference Dijkstra, Neal, Beever and France1992; Mills et al., Reference Mills, Dijkstra, Bannink, Cammell, Kebreab and France2001; Bannink et al., Reference Bannink, Kogut, Dijkstra, France, Kebreab, Van Vuuren and Tamminga2006 and Reference Bannink, France, Lopez, Gerrits, Kebreab, Tamminga and Dijkstra2008) is in use as a Tier 3 approach in the Dutch inventory of greenhouse gas emissions in dairy cattle as described by Bannink et al. (Reference Bannink, Van Schijndel and Dijkstra2011). Recently, Dijkstra et al. (Reference Dijkstra, Oenema and Bannink2011) used the model to study a variety of N reducing nutritional measures on enteric CH4, as well as N excretion, by performing simulations for 40 different diets, including two extremes in N fertilization of grassland as well as in sward weight at cutting, two levels of concentrate allowance and various exchanges of grass silage (Table 1). The results indicated a moderate (r 2 = 0.22; Figure 3) but negative trend (slope of −0.24) for g CH4/kg FPCM emitted per g N excreted/kg FPCM (Dijkstra et al., Reference Dijkstra, Oenema and Bannink2011). The results indicate that there is a large variation in CH4 emission for the various N reducing nutritional measures. In some cases, there were synergistic effects (Figure 3; more maize silage at the expense of grass silage), in other cases there was a trade-off of an increased N excretion with reduced CH4 emission (Figure 3; high N fertilization and early cutting of grass). Recently, such a negative trend with much variation remaining was confirmed in a simulation study specifically oriented on trials performed on high-sugar grasses (Ellis et al., Reference Ellis, Dijkstra, France, Parsons, Edwards, Rasmussen and Kebreab2012). Although in vivo observations in well-designed experiments remain sparse, there is some support of a decrease in N excretion via grassland management resulting in an increase in CH4 emissions. Results of lactating cows fed grass herbage in climate controlled respiration chambers, used for model evaluation by Bannink et al. (Reference Bannink, Smits, Kebreab, Mills, Ellis, Klop, France and Dijkstra2010), as well as results of Murray et al. (Reference Murray, Gill, Balsdon and Jarvis2001) of sheep kept in tunnels on pasture suggest that with an extreme increase of N content in grass (2.5% to 4.5% of DM) or in N fertilization rate (70 v. 270 kg N/ha), respectively, CH4 emission per kg DM may be up to 20% lower. More in vivo results from well-designed experiments are needed however for more conclusive results.
Methane emission v. N excretion per kg fat and protein corrected milk for 40 simulated diets. Effects were simulated of a changed grassland management (350 v. 150 kg N artificial fertilizer/ha next to 70 kg N/ha from animal manure for first cut; early at 3000 kg/ha v. late cutting at 4500 kg/ha), changing level of concentrate allowance (20% or 40% of DM intake), and exchange of grass silage for various other ingredients (maize silage, beet pulp, potatoes, straw). Separate symbols are used to indicate the low methane emissions simulated for diets with grass silage exchanged for maize silage (Maize silage, ◊), and for diets including high N-fertilization and early-cutting (HFEC; Δ), compared with the remainder of diets simulated (Other; ○).

Therefore, nutritional measures to reduce N excretion and related N emissions do not necessarily reduce greenhouses gas emission (in CO2 equivalents). According to the general trend that was simulated by Dijkstra et al. (Reference Dijkstra, Oenema and Bannink2011), 1 g reduction in N excretion/ kg FPCM increases CH4 emission by 0.24 g/kg milk. Suppose only 1% of excreted N becomes emitted as N2O, and the ratio of global warming potential of N2O to that of CH4 is 298 : 25, then the reduced N2O emission is more or less compensated by an increased enteric CH4 emission. The large variation in simulation results for N excretion and CH4 emission makes clear that generic values better not be used when aiming to analyse specific farming conditions, farm types or nutritional measures. Generic values do not hold when research questions are very specific because details on rumen fermentation processes and digestive function matter when aiming to evaluate the effects on enteric CH4 next to effects on N excretion. Farm N surplus has been mentioned as an indicator of the level of greenhouse gas emissions from farms (Schils et al., Reference Schils, Olesen, Del Prado and Soussana2007). However, the present results indicate that this does not necessarily hold. It may hold when coming downwards from extremely high farm N surpluses, with high N2O emissions and with N2O as the predominant source of greenhouse gas. However, this is likely not a good reference for current practice and certainly not with the situation under a stringent manure legislation (e.g. the EU nitrate and phosphate directives). Moreover, farm type and details on farm management have a profound impact on which nutritional measures actually are feasible and on how they will affect enteric CH4 and N excretion realized per kg FPCM. This impact will be hard to evaluate when non-specific values or average values from inventory studies are adopted.
On-farm indicators for quantification of N excreted and CH4 emitted
In previous sections, the methods to quantify N excretion and enteric CH4 were discussed. Although different models may be adopted, they are all prone to error and uncertainty related to the model inputs. An alternative to the uncertainty associated with model calculations would be on-farm measurement. However, it is difficult to measure rates of CH4 emission or N excretion as such. Measurements which are feasible are normally those of concentrations of compounds in samples of, for example, air (ppm CH4) or manure (g N/kg DM), whereas estimates of rates are needed (g CH4/day; g N/day). Even when samples are taken on a frequent basis, interpretation of them as a rate relies on the (measurement and calculation) method to transfer measured concentration in samples into estimates of daily quantities or fluxes (e.g. Garnsworthy et al., Reference Garnsworthy, Craigon, Hernandez-Medrano and Saunders2012). Because of technological issues, the need for technology assessment, the operational costs involved, and the continuous variation in feeding conditions and sampling in practice, a pragmatic and straightforward alternative to the technology of air and manure sampling would be the sampling of milk which is already in place in current practice. The rate of milk production (kg/day) is known for every individual animal, concentrations of milk urea are associated with N excretion rate as discussed earlier, and milk fat composition is associated to rumen fermentation processes and hence CH4 emission. The association of both N excretion and CH4 emission to milk composition exists (Dijkstra et al., Reference Dijkstra, Oenema and Bannink2011; Spek et al., Reference Spek, Bannink, Gort, Hendriks and Dijkstra2012). However, reliable prediction equations or quantitative models are needed to let them be a realistic alternative for continuous on-farm measurement, and to let them become useful to monitor short-term developments in CH4 emission and N-excretion and control these by nutritional means.
Milk urea seems to be a useful indicator when considering the whole range of N excretion, but it clearly is an inaccurate indicator when considering the far more narrow operational working range of milk urea for a farmer (Figure 4a). A large part of variation in milk urea content is unrelated to N excretion and must be related to several dietary, animal and management factors as recently reviewed by Spek et al. (Reference Spek, Dijkstra, Van Duinkerken and Bannink2013). The existence and impact of such factors on milk urea is nicely illustrated by the fact that heritability of milk urea content appears to be not even slightly related to efficiency of N utilization as determined from observations of 723 cows in 26 trials on feed intake, milk production and cow weight (Šebek et al., Reference Šebek, Van Riel and De Jong2007). This finding indicates there was no causal relationship between heritability of milk urea content and efficiency of N utilization (and hence N excretion). Other factors must be involved with heritability of milk urea content. Likely, similar factors first need to be understood, and subsequently to be sifted out, in order to let milk urea become an accurate indicator of N excretion and be a useful tool for the farmer to optimize feeding strategy, minimize N excretion and identify differences between individual cows. For the moment, perhaps it is most accurate simply to estimate N excretion by a N balance calculation approach.
Estimating (a) N excretion from milk urea content (dataset described by Schröder et al., Reference Schröder, Bannink and Kohn2005), (b) enteric CH4 emission from the profile of fatty acids in milk fat as an indicator by an empirical method (derived from Dijkstra et al., Reference Dijkstra, Oenema and Bannink2011), (c) milk fat composition by a mechanistic approach describing regulatory mechanism involved in milk fat synthesis in udder cells.

Comparable to milk urea being related to N excretion, milk fat composition is likely susceptible to variation unrelated to rumen fermentation and enteric CH4 (Vlaeminck et al., Reference Vlaeminck, Fievez, Tamminga, Dewhurst, Van Vuuren, DeBrabander and Demeyer2006). Associations between milk fat composition and enteric CH4 have been documented (e.g. Dijkstra et al., Reference Dijkstra, Oenema and Bannink2011). However, similar to the case discussed for milk urea (Figure 4a), with an R 2 of 0.73 for the equation for the whole range of CH4 emission observed (Figure 4b), to predict accurately enough in the range of interest of the farmer the explanation of observed variation has to improve. Various factors are involved in the regulation of milk fat composition. More mechanistic modelling approaches that attempt to address the underlying regulatory mechanisms of milk fat synthesis may assist the more empirical approaches that attempt to describe the variation in milk fat composition related to enteric CH4 (Figure 4c). This may include a representation of the effect of diet (Bauman et al., Reference Bauman, Harvatine and Lock2011), physiology (Kelsey et al., Reference Kelsey, Corl, Collier and Bauman2003) and genotype (Schennink et al., Reference Schennink, Stoop, Visker, Heck, Bovenhuis, Van der Poel, Van Valenberg and Van Arendonk2007; Mach et al., Reference Mach, Blum, Bannink, Causeur, Houee-Bigot, Lagarrigue and Smits2012) on milk fatty acid profile. For the development of milk fat composition as an on-farm indicator of enteric CH4 in any case requires large data sets which include accurate in vivo measurement of CH4 emission. At this moment, an indicator of enteric CH4 is unavailable and estimation of CH4 emission relies on the use of quantitative models. The model of choice depends on model accuracy and on the preferred level of detail in the model representation (i.e. of the underlying mechanisms and trade-offs in CH4 emission with N reducing measures).
Conclusions
Rumen function has a profound impact on the extent and site of feed digestion, on the extent and site of N excretion and on enteric CH4 emission. Simulation studies indicate that the direction and the extent of changes in enteric CH4 depend on the approach taken to reduce N excretion. Results indicate changes in N excretion must be expected to be accompanied by changes in enteric CH4 emission, and that simultaneous changes may fully compensate each other with respect to their contribution to greenhouse gas emission. When the aim is to become precise in accounting for such trade-offs, details on rumen fermentation mechanisms matter and need to be addressed, or it should at least be made clear why such details can be ignored. Before milk analysis can be used as an indicator for N excretion and enteric CH4 emission accuracy of these measures need to be improved. Development of these indicators require modelling efforts which preferably include logic and rational before they are applied as a proxy for the mechanisms responsible for N excretion and CH4 emission. Until such indicators are available, estimates of N excretion and enteric CH4 emission on farms are better off being based on extant quantitative models that make use of information available on-farm regarding animal performance and dietary characteristics.
Further information
The research leading to these results has been conducted as part of the AnimalChange project which received funding from the European Community's Seventh Framework Programme (FP7/ 2007-2013) under the grant agreement number 266018, and the project Low-Emission Animal Feed funded by the Dutch Ministry of Economic Affairs, Agriculture. Innovation.
The Dairy Solutions Symposium is a biennial event that covers a wide variety of themes and topics of relevance and importance to the dairy industry. The aim is to provide high level, up-to-date information and research to dairy professionals, technologists and scientists. In 2012, the theme addressed the biggest challenge facing all those involved in dairy production: optimizing production efficiency while lowering environmental impact. For more information, please visit www.dairycowsolutions.com or contact dairycowsolutions@alltech.com.