A congenital diaphragmatic hernia is a physical defect of the abdominal diaphragm resulting in possible herniation of abdominal contents into the thoracic cavity. Congenital diaphragmatic hernias have commonly been found to be associated with other congenital anomalies including those of the gastrointestinal, nervous, and genitourinary systems in up to 39% of cases.Reference Fauza and Wilson1 Furthermore, 10–25% of patients with congenital diaphragmatic hernia have been found to have some form of CHD.Reference Graziano2 The combination of both congenital diaphragmatic hernia and CHD has been uniformly regarded as predicting a poorer prognosis than either alone, but most studies observing the interplay between the two have focused on the prevalence of various different types of CHD such as atrial septal defects, ventricular septal defects, and hypoplastic left heart syndrome.Reference Bianchi, Fesslova, Lista, Rustico, Torricelli and Pansini3– Reference Lin, Pober and Adatia5
While many types of CHDs have been described in individuals with congenital diaphragmatic hernia, there seems to be a predominance of several small case series and case reports describing underdevelopment of left-sided heart structures and the potential for left heart obstructive disease, even in the absence of significant structural heart disease.Reference Bianchi, Fesslova, Lista, Rustico, Torricelli and Pansini3, Reference Thebaud, Azancot and de Lagausie6– Reference Okawada, Yanai and Yamataka8 Though the mechanism of why these structures fail to develop normally is incompletely understood, the presence of a congenital diaphragmatic hernia has been theorised to affect fetal development of the left heart and possibly predispose these patients to developing small left-sided heart structures.Reference Siebert, Haas and Beckwith7, Reference Migliazza, Otten, Xia, Rodriguez, Diez-Pardo and Tovar9 The goal of this study is to evaluate whether the presence of a congenital diaphragmatic hernia appears to be associated with concomitant hypoplasia of left-sided heart structures and how the indexed relative size of those structures affects the outcomes and length of stay following repair of the diaphragmatic hernia.
Materials and methods
This study was performed after approval from the University of Virginia Institutional Review Board and performed in accordance with their guidelines.
A retrospective review was performed to identify all patients between birth and 1 month of age at our institution who were diagnosed with a congenital diaphragmatic hernia between May 2007 and April 2015. Study dates were selected secondary to reliability and accuracy of the echocardiographic measurements that were available after 2007 at our institution. Patients were included for analysis if they had complete study data in the electronic medical record as well as a complete transthoracic echocardiogram with all standard views of the left-sided cardiac structures. Patients were excluded from analysis if initial echocardiographic data were not available prior to surgical intervention or redirection of care. Further exclusion criteria included any patient that underwent single ventricle palliation or any conotruncal defect known to affect the size of left-sided heart structures. The rationale for this exclusion was the inability to generalise these patients’ left-heart structures to the population as a whole. Death prior to congenital diaphragmatic hernia repair was not excluded in the echocardiographic assessment but was not included in the comparative outcome analysis following surgery.
Patient data collected included sex, date of birth, gestational age, birth weight, congenital diaphragmatic hernia defect size as described in the operative report, congenital diaphragmatic hernia sidedness, liver eventration into the congenital diaphragmatic hernia defect as described by the surgeon or imaging prior to surgery, age at repair of congenital diaphragmatic hernia, weight, length, and age at first echo after birth, APGAR scores, initial PaO2, use of pre-operative or peri-operative extracorporeal membranous oxygenation, date of initial extubation, length of stay at the tertiary care facility, and discharge disposition. Variables were all collected for potential model inclusion and as confounders. Term was assumed to be 37 weeks completed gestation.
Echocardiographic data
Echocardiographic images were gathered from the medical centre’s electronic echocardiography reading system for each patient within the study period. All images were obtained using standard views, in standard location, and during expected phases of the cardiac cycle as dictated by previously published guidelines.Reference Lopez, Colan and Frommelt10 Patients needed to have acceptable views to meet inclusion criteria and all images utilised were obtained prior to operative repair. Measurements collected for each patient included the left ventricular end diastolic diameter (LVIDd), left ventricular end systolic diameter (LVIDs), aortic annulus, aortic sinuses, sinotubular junction, transverse arch, aortic isthmus, distal aortic arch, and the aorta at the diaphragm. These measurements were obtained from the parasternal long-axis and suprasternal views where appropriate. All measurements were performed blinded, offline, by a registered cardiac sonographer (CS) with 15 years of congenital sonography experience. After the required measurements were obtained, 25% of the studies were randomly selected by a computer to be measured again, in their entirety, by a board-certified paediatric non-invasive cardiologist (JV) to assess for inter-observer reliability.
Comparison to normative measures
Raw measurements were plotted against the body surface area in m2 (Haycock formula) of each patient to index the specific structure to somatic size. Scatter plots were then compared with published percentile normative values also indexed to body surface area using the exact same methods.Reference Pettersen, Du, Skeens and Humes11 After assessing for normal distribution, the mean structure size was compared to the normative mean (Z = 0) by use of t-tests with p-values less than 0.05 considered statistically significant.
Regression models
Univariable regression models were used to assess the association between each echocardiographic measure and length of stay defined as discharge from the hospital or transfer to a long-term care facility. Multi-variable models were used to assess the association after adjusting for known confounders of surgical outcomes including congenital diaphragmatic hernia defect size, congenital diaphragmatic hernia sidedness, extracorporeal membranous oxygenation (ECMO) use, and liver eventration into the congenital diaphragmatic hernia defect. In order to meet the statistical assumptions underlying regression analyses, length of stay was transformed to the log base 10 scale. Stepwise and Cp-based model selection procedures were used to estimate the simultaneous effect of several echocardiographic measures on length of stay, adjusting for the same confounders 12. Statistical analysis was completed with two statistical programs, SAS 9.4 (SAS Institute Inc., Cary, NC, United States of America) and GAUSS 18.0 (Aptech Systems, Inc, Chandler, AZ, United States of America). Due to the low frequency of mortality in our population, mortality was not used as an outcome of interest.
Results
Baseline data
A total of 66 patients with congenital diaphragmatic hernias were included in the initial data set. Six of the patients were excluded due to no available echocardiograms, two patients were late diagnoses after discharge from the hospital, and six were excluded because of incomplete patient data in the electronic medical record. A total of 52 patients met criteria for inclusion in the study and had the required data available for analysis. Of those patients 36 were male (69%) with 16 females (31%). Two infants were born at 27 weeks gestation, one at 33 weeks, and the remainder (49/52, 94%) were born at 37-weeks gestation or greater. Two-thirds of the patients (35/52, 67%) were inborn. The majority of the patients were ultimately discharged home (38/52, 73%) compared to six deaths within the study, and eight transfers to other medical centres. Congenital diaphragmatic hernias were primarily classified as left-sided (40/52, 76.9%) or right-sided (12/52, 23%) with three patients also having a small hernia or eventration on the side contralateral to their primary hernia. Pre-operative ECMO was used in 16 cases while post-operative extracorporeal membranous oxygenation was used in five cases following congenital diaphragmatic hernia repair. Average age at repair of congenital diaphragmatic hernia was 12.5 days. The body surface area of the patients secondary to a fairly homogenous, newborn population ranged from 0.1 to 0.25. Patient characteristics, disposition, CDH sidedness and size, and birth data are listed in Table 1.
Baseline demographics for patients with CDH in the data set

ECMO = extracorporeal membrane oxygenation.
Aortic and left-sided heart structure measurements
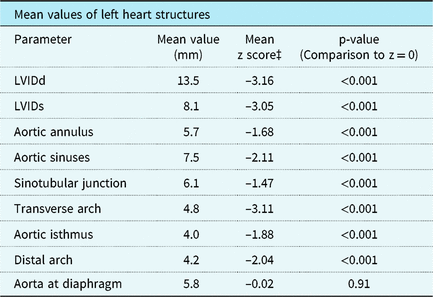
Table 2 outlines the mean size of each cardiac structure that was evaluated along with the corresponding z score when the values were plotted against each patient’s body surface area using the normative regression equations. This demonstrated that the mean values of all variables measured including LVIDd, LVIDs, aortic annulus, sinuses and sinotubular junction as well aortic arch measurements were all statistically smaller compared to normative data with a similar body surface area. The exception to this was the aorta at the level of the diaphragm which demonstrated no statistical difference from the normative values (mean 5.8 mm, z = –0.02, p = 0.91).
Mean values of measured left heart structures in the study population and z scores generated from previously published data setReference Pettersen, Du, Skeens and Humes11 with comparisons to z = 0 (mean) of normative patients

LVIDd = left ventricular internal diastolic diameter; LVIDs = left ventricular internal systolic diameter.
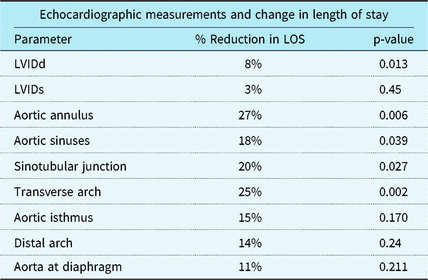
Univariate regression analysis controlling for known confounders

LVIDd = left ventricular internal diastolic diameter, LVIDs = left ventricular internal systolic diameter.
Percent associated reduction in length of stay is determined by a 1 unitReference Lopez, Colan and Frommelt10 increase in structure diameter.
Inter-observer variability was minimal, demonstrating less than a 7% difference across all absolute measurements obtained in the randomly assigned over-read group compared to the original whole data set. Furthermore, the mean of the over-read measurements demonstrated the same statistical difference from the normative control mean as the previously reported original data showing minimal effect from inter-observer variability.
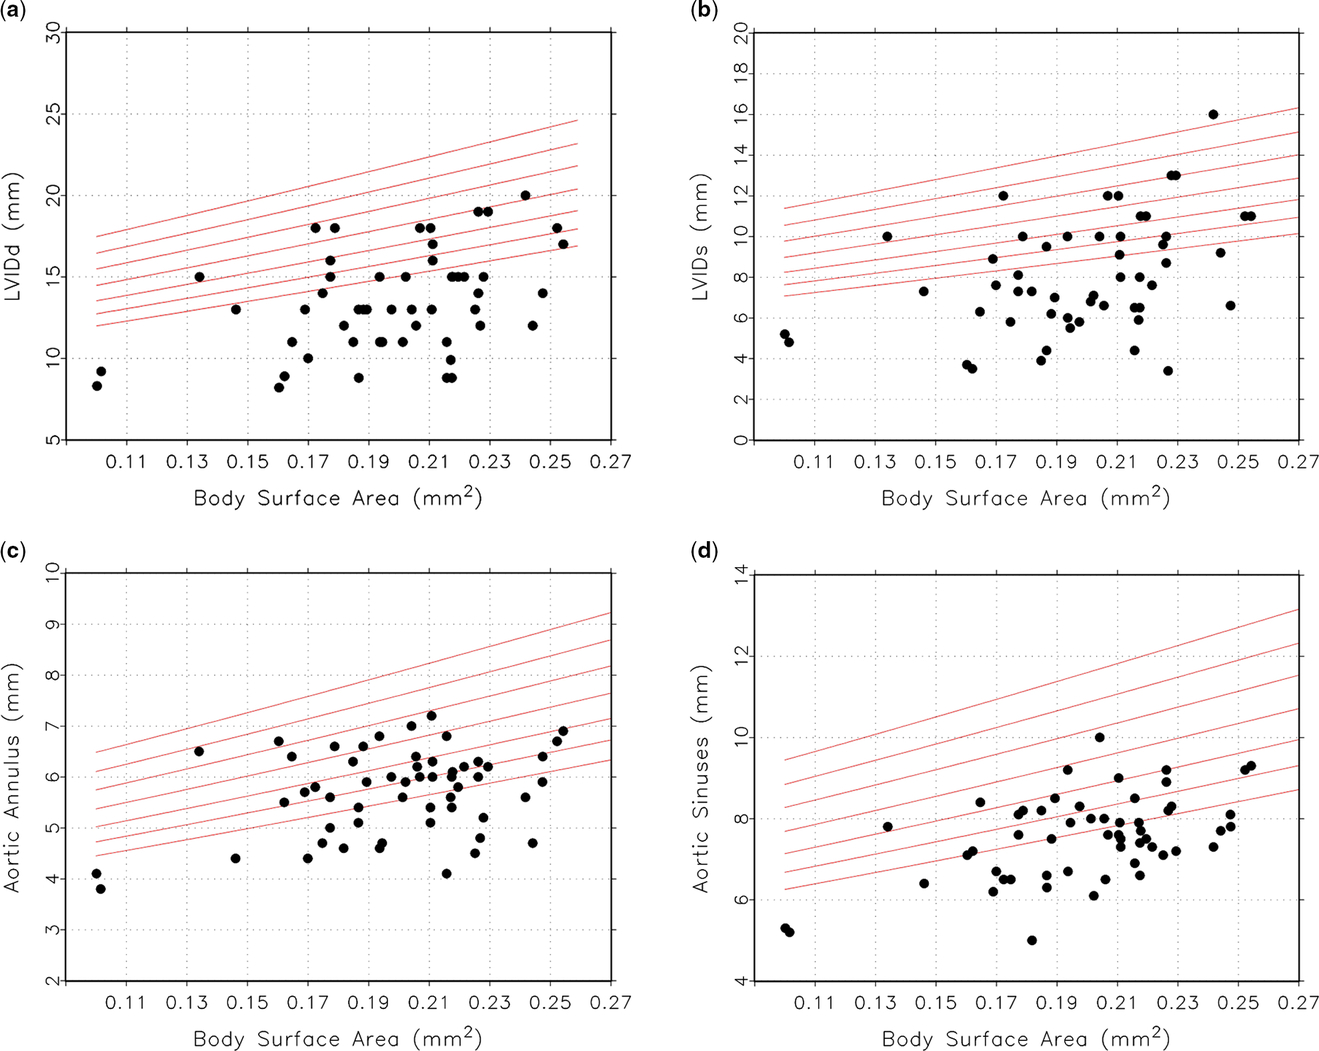
Scatter plots of left ventricular dimensions with aortic valve and root dimensions plotted against the patient body surface area as measured from the parasternal long axis are displayed in Figure 1. In comparison to normative percentile lines, all measurements of the left ventricle and aortic valve fell below, as a group, those of the normative controls across the range of body surface areas present in the study population. Figure 2 demonstrates scatter plots of all measurements of the aorta distal to the aortic sinuses as measured in the parasternal long axis, suprasternal notch, or subcostal imaging where appropriate. The scatter plots again demonstrate that in comparison to normative body surface area standards, patients with congenital diaphragmatic hernia had smaller structures overall. The exception, again, is the aorta at the level of the diaphragm that demonstrated a similar distribution to normative values.
Scatter plots demonstrating measured raw values for ( a ) left ventricular end diastolic diameter (LVIDd), ( b ) left ventricular end systolic diameter (LIVDs), ( c ) aortic annulus, ( d ) aortic sinuses, with respect to body surface area. Lines representing the 3rd, 10th, 25th, 50th, 75th, 90th, and 97th percentiles are plotted, in addition.

Scatter plots demonstrating measured raw values for ( a ) sinotubular junction, ( b ) transverse arch, ( c ) aortic isthmus, ( d ) distal aortic arch, and ( e ) the aorta at the diaphragm, with respect to BSA. Lines representing the 3rd, 10th, 25th, 50th, 75th, 90th, and 97th percentiles are plotted, in addition.

Outcome analysis
Our secondary outcome investigated our measured left heart parameters and their association with any prolonged length of stay at our hospital. Univariate linear regression analysis was performed looking at each left heart parameter in isolation and controlling for known confounders as listed in the methods sectionReference Weisberg12. The results of this analysis are shown in Table 2. Only patients who survived to discharge or transfer to a long-term care facility were included in analysis of length of stay as shown in Table 3. The majority of left heart dimensions including LVIDd, aortic annulus, sinuses and sinotubular junction as well as the transverse aortic arch were all associated with an increased length of stay as the sizes of the structures progressively decreased. Stepwise selection in a multi-variate fashion demonstrated that increases in size of the LVIDd (p = 0.01), aortic sinuses (p = 0.009), and the transverse arch (p = 0.05) were associated with overall reduced length of stay. Indexed size of the descending aorta, even though not statistically different from the normative data set, did have an effect as well on the length of stay (p = 0.007).
Discussion
Cardiac anomalies with congenital diaphragmatic hernia have varied across the spectrum of CHD, but do show some predominance towards left-sided heart lesions. Previous studies have shown decreased left ventricular, left atrial, and inter-ventricular septal muscle mass in newborns born with congenital diaphragmatic hernias compared to age-matched patients without congenital diaphragmatic hernias.Reference Thebaud, Azancot and de Lagausie6, Reference Siebert, Haas and Beckwith7 Several of these studies have suggested a possible mass effect from the intra-abdominal contents herniating into the thoracic cavity as a pathophysiologic mechanism for poor left-sided cardiac development. These studies have typically evaluated the left ventricle, mitral valve, aortic valve, and LV volume as their indices of left-sided cardiac hypoplasia, but typically without extension into the aortic arch. While they have helped to demonstrate the effects of different types of congenital diaphragmatic hernias on the size of left-sided heart structures,Reference Byrne, Keller and Meadows13, Reference Vogel, McElhinney, Marcus, Morash, Jennings and Tworetzky14 our study appears to be the first to quantitatively describe the uniformly decreased size of the left ventricle through the distal aortic arch. The z scores of our congenital diaphragmatic hernia population were uniformly found to be lower than their age matched normative values based on body surface area.
While the majority of the left-sided structures consistently appear smaller, the aorta at the diaphragm appears to be preserved in these patients. The data from our study cannot definitively identify a causative relationship between the congenital diaphragmatic hernia and the smaller left-sided structures, but the preservation of the aorta at the diaphragm suggests that there may be some merit to the theory that intra-thoracic abdominal contents could exert a mass effect on cardiac structures within the thoracic cavity and thus hinder their physical development. Additionally, the preservation of the aorta at the diaphragm could be explained by additional blood flow supplied to the descending aorta through the patent ductus arteriosus during fetal development. This blood flow, in conjunction with the herniation of abdominal contents above the measured area, likely allowed the aorta to grow appropriately at the level of the diaphragm, despite the restricted growth of the more proximal cardiac structures. However, underdevelopment of the fetal lung buds could also result in fetal RV hypertension which can have a significant effect on blood flow through the developing left heart in utero. Furthermore, it is possible, though not proven, that increased afterload on the left heart in the developing fetus can have a significant impact on the degree of elevated pulmonary vascular resistance, thereby increasing the right-to-left shunting across the ductus in utero.Reference Harting15
Complicating this is the heterogeneity of our population consisting of left- and right-sided congenital diaphragmatic hernia. The reason for inclusion and analysis of both types of hernias initially together was to reduce the possibility of information or observational bias within the study based on possible preconceived notions that one type of hernia would be worse than the other. Theoretically, mass effect on the developing left ventricle could exist with both left-sided congenital diaphragmatic hernias with abdominal contents near the pericardial space and right-sided congenital diaphragmatic hernias that can cause a major shift of the mediastinum towards the left. Thus, we felt that including all types of hernias and controlling for them in the regression analysis offered the most robust and non-biased method to assess all theoretical reasons for an underdeveloped fetal left heart.
This study appears to agree rather consistently with previous studies examining left-sided heart structures in patients with congenital diaphragmatic hernia,Reference Thebaud, Azancot and de Lagausie6, Reference Byrne, Keller and Meadows13, Reference Vogel, McElhinney, Marcus, Morash, Jennings and Tworetzky14 but provides actual quantitative evidence of diminutive left-sided cardiac structures in this study population. Some retrospective studies have evaluated the interplay between various cardiac anomalies associated with congenital diaphragmatic hernias, including a study by Graziano in 2005 illustrating decreased survival of patients with congenital diaphragmatic hernia and some form of heart disease.Reference Graziano2 Similar rates of survival have been found in several additional studies and small case series of patients with congenital diaphragmatic hernias and concomitant heart disease likely secondary to their frequent association.Reference Okawada, Yanai and Yamataka8, Reference Eghtesady, Skarsgard, Smith, Robbins, Wexler and Rhine16– Reference Gray, Fifer and Hirsch18 One of the most important questions regarding our study’s findings is the effect of decreased cardiac structure size on patient outcomes.
While CHD has a well-documented impact on morbidity and mortality, our results demonstrate how the relative size of left-sided heart structures can impact various morbidity metrics in the absence of definitive CHD. Decreased size of portions of the left ventricular outflow tract, including the LV body itself, had a demonstrable effect on prolonging length of stay in these patients. While our patients did not meet criteria for borderline left hearts, the hemodynamic ramifications of smaller left-sided structures, especially marginal aortic arches, can have theoretically profound effects on cardiac output and recovery from congenital diaphragmatic hernia surgery. The relatively low mortality in our population made analysis of survival of patients with diminished left-sided structures slightly more difficult, but a larger cohort may provide more insight into the association between those smaller structures and mortality risk.
Limitations
This study was retrospective and thus there was a limitation of potentially incomplete data for some patients included in the study. One significant limitation to this study was the high prevalence of pulmonary hypertension in this patient population secondary to abdominal contents within the thoracic cavity and its effect on obtaining accurate echocardiographic measurements. While pulmonary hypertension should not significantly affect the measurements of the aortic arch, it likely affected the measurements of the left ventricle in both systole and diastole due to the distortion of the ventricular septum with elevated right ventricular pressure. Flattening of septum will underestimate the size of the LVIDd secondary to pulmonary hypertension, especially if there is any bowing of the septum into the left ventricle. The data for our patient population were also uniform at the lower end for z scores. While this underscores the significantly small sizes of the different cardiac structures, it also overestimates small changes in actual measurements and the significance of the differences in z scores between those measurements.
Furthermore, the effect of the size of hernia on development would have been helpful to examine, yet inconsistency in the reported size at the time of the operation brought concern as to the reliability of the results. This is similarly true for sidedness of the congenital diaphragmatic hernia. Because there were so few bilateral and right-sided hernias, separating these out into different groups would have made it challenging to derive meaningful results on the outcomes of interest. The sidedness was controlled for in the regression models, however, primarily in order to reduce its effect on the associations as previously described.
Acknowledgments
None
Financial Support
This research received no specific grant from any funding agency, commercial or not-for-profit sectors.
Conflicts of Interest
None