Introduction
The adult tsetse fly (Glossinidae; Glossina spp.) is the main haematophagous vector of the trypanosome parasite which affects humans (Sleeping sickness) and livestock (Nagana) throughout sub-Saharan Africa (Smith et al., Reference Smith, Pepin and Stich1998; Kristjanson et al., Reference Kristjanson, Swallow, Rowlands, Kruska and Leeuw1999; WHO, 2006). As a medically and economically important species, therefore, tsetse fly biology has been well studied to facilitate vector control in the field (Wall & Langley, Reference Wall and Langley1991; Colvin & Gibson, Reference Colvin and Gibson1992; Gooding et al., Reference Gooding and Krafsur2005) and to enable the captive rearing of tsetse for laboratory studies of both fly and parasite and sterile insect release (Nash, Reference Nash1969; Vreyson et al., Reference Vreysen, Saleh, Ali, Abdulla, Zhu, Juma, Dyck, Msang, Mkonyi and Feldmann2000). Accordingly, olfaction (Leonard & Saini, Reference Leonard and Saini1993; Gibson & Torr, Reference Gibson and Torr1999; Voskamp et al., Reference Voskamp, Everaarts and Den Otter1999), vision (Green, Reference Green and Cosens1983; Gibson & Torr, Reference Gibson and Torr1999), taste (Van Der Goes Van Natters & Den Otter, Reference Van Der Goes Van Naters and Den Otter1998), tactile sensation (Dethier, Reference Dethier1954; Reinouts Van Haga & Mitchell, Reference Reinouts Van Haga and Mitchell1975) and audition (Popham et al., Reference Popham, Parr and Chowdhury1977) have all been investigated but to varying degrees; audition in particular has received comparatively modest attention. In many organisms, however, sound signals from hosts, prey, predators and/or conspecifics initiate complex behavioural responses. Insects commonly receive air-borne sound vibrations using pressure-sensitive tympanal organs (Hoy & Robert, Reference Hoy and Robert1996; Yack, Reference Yack2004). Morphologically, insect tympanal ears are characterized by: (i) a flexible tympanal membrane, (ii) an air chamber apposing the tympanum, and (iii) one or more mechanosensory chordotonal organs coupled to the tympanum (Fullard & Yack, Reference Fullard and Yack1993; Hoy & Robert, Reference Hoy and Robert1996; Yager, Reference Yager1999; Yack, Reference Yack2004). Dipteran tympanal hearing organs were discovered relatively recently and exhibit these three morphological features (Lakes-Harlan & Heller, Reference Lakes-Harlan and Heller1992; Robert et al., Reference Robert, Amoroso and Hoy1992).
Two families of Diptera are endowed with tympanal ears located on the ventral prothorax (Sarcophagidae: Emblemasoma sp.: Lakes-Harlan et al., Reference Lakes-Harlan, Stölting and Stumpner1999; Robert et al., Reference Robert, Miles and Hoy1999; and Tachinidae: Homotrixa sp.: Stumpner et al., Reference Stumpner, Allen and Lakes-Harlan2007; Ormia sp.: Lakes-Harlan & Heller, Reference Lakes-Harlan and Heller1992; Robert et al., Reference Robert, Amoroso and Hoy1992; Therobia sp.: Stumpner & Lakes-Harlan, Reference Stumpner and Lakes-Harlan1996). Each family employs a parasitic reproductive strategy and requires a suitable host to develop their larval stages. However, unlike other parasitoids which mainly use semiochemicals for host location, female ormiine tachinids and Emblemasoma sp. orient towards the acoustic signals of their host Orthoptera and Hemiptera (Cade, Reference Cade1975; Soper et al., Reference Soper, Shewell and Tyrell1976; Adamo et al., Reference Adamo, Robert, Perez and Hoy1995; Allen et al., Reference Allen, Kamien, Berry, Byrne and Hunt1999, Kohler & Lakes-Harlan, Reference Kohler and Lakes-Harlan2001). Appropriately, the resonant frequency of the tachinid and sarcophagid tympana is tuned to the carrier frequency of the host song (Robert et al., Reference Robert, Amoroso and Hoy1992, Reference Robert, Miles and Hoy1996b). In addition, an independently evolved structural adaptation mechanically couples the tympanal membranes of both sarcophagid and tachinid ears, generating a directional response (Robert et al., Reference Robert, Miles and Hoy1998, Reference Robert, Miles and Hoy1999), enabling hosts to be pinpointed entirely by sound (Ramsauer & Robert, Reference Ramsauer and Robert2000; Müller & Robert, Reference Müller and Robert2001).
This study investigates the anatomy of the membranous ventral prothorax of the tsetse fly Glossina morsitans and characterises its vibrational response to test its similarity with the tympanal hearing organs previously documented in Diptera. Firstly, the ventral prothorax of G. morsitans was examined under a scanning electron microscope to establish morphology of the prothoracic membrane. The tsetse prothorax was then compared with that of two tympanate (Tachinidae: Ormia ochracea; Sarcophagidae: Emblemasoma sp.) and two atympanate, calypterate flies (Muscidae: Musca domestica; Hippoboscidae: Ornithomya avicularia). Secondly, sections were cut from G. morsitans to ascertain the presence of a prothoracic chamber and two sensory chordotonal organs associated with the tsetse membrane. Thirdly, using micro-scanning laser Doppler vibrometry, the response of the prothoracic membrane in G. morsitans to a broad range of frequencies (1–30 kHz) was tested and contrasted against M. domestica. The resonant frequency, directionality and linearity of the response were measured to test the hypothesis that the tsetse membrane responds to sound in a way that could constitute a hearing organ.
The anatomical and vibrational evidence we present supports the notion that tsetse may possess a tympanal organ. Together with previous reports of acoustic emissions, the presence of an ear-like structure promotes future studies, which explore the behavioural and sensory biology of this medically important species.
Methods and materials
Animals
Vibration measurements were made using Glossina morsitans (Glossinidae) obtained from a colony at the Tsetse Research Laboratory (Bristol University, UK). Individual tsetse flies were kept in mesh-ended tubes (8-cm long, 2.5-cm diameter) at 70% humidity, 25°C in an environmental chamber (MLR-350HT; Sanyo). They were fed on alternate days with defibrinated horse blood using an artificial membrane feeding system (Moloo, Reference Moloo1971). Additional experiments were carried out using Musca domestica (Muscidae) obtained from a local supplier as larvae and allowed to pupate in the laboratory. The emerged adults were maintained in a cage and provided with granulated sugar and water ad libitum. For comparison, additional adult fly species were procured and in total the external prothorax of five genera representing the three calypterate superfamilies were imaged. Two atympanate Calyptera were examined, a representative from the same superfamily as Glossina spp., the hippoboscid Ornithomya avicularia (sample Ae6603), preserved in 70% IMS (industrial methylated spirits) from the Bristol City Museum and Art Gallery (UK), and M. domestica, a member of the Muscoidea. Two tympanate specimens, Ormia ochracea and Emblemasoma sp., belonging to the Oestroidea were pre-prepared for imaging at Cornell University (USA) and supplied by D. Robert, H. Farris and R.R. Hoy.
Scanning electron microscopy
For scanning electron microscopy, live specimens were asphyxiated with CO2 and air-dried. Samples in 70% IMS were transferred to ethanol through an ethanol series and underwent critical point drying. All dried specimens were then decapitated and mounted onto metal stubs with the prothorax uppermost before being gold coated. The samples were then examined in a Philips 501B scanning electron microscope (SEM).
Light microscopy
G. morsitans were killed for light microscopy using CO2 and decapitated; in addition, the wings, legs and abdomen were removed. The thoraces were fixed in alcoholic Bouin's solution and dehydrated through an alcohol series before embedding in LR-White Resin (14380–14382; Electron Microscopy Sciences, Hatfield, UK). The material was then sectioned (10-μm thick) and stained with toluidine blue in 1% borax.
Measurements
Digital pictures of the prothoracic membrane on G. morsitans were taken (Nikon Coolpix 990; Nikon, Tokyo, Japan). The software TPS-DIG v.1.4. (Rohlf, Reference Rohlf2001) was then used to measure the area and width of the membrane from the digital image. The overall size of the animal was assessed by measuring the width of the thorax using a binocular microscope and an eye piece graticule.
Laser Doppler vibrometry measurements
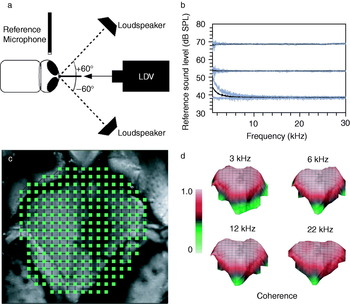
Animals were anesthetized with CO2 and restrained ventral side down to a metal rod (150-mm long, 8-mm diameter) using BLU-TACK (Bostik-Findley, Stafford, UK). The head was lifted and the body tilted up slightly to expose the prosternum to the laser beam. They were positioned ~10 cm in front of a laser Doppler vibrometer with the prosternal membrane perpendicular to the laser beam (fig. 1a).
(a) The experimental set-up used to measure the response of the tsetse (G. morsitans) prothoracic membrane to sound stimuli consisting of a Laser Doppler Vibrometer (LDV) and a loudspeaker placed at ±60° to the animal. (b) The sound stimulus used comprised frequencies 1–30 kHz and unless otherwise stated a sound level of 54 dB SPL (54±0.18; mean±SD, n=20 animals) was used. In linearity experiments the sound level was increased from 40–70 dB in 3dB increments and the minimum and maximum stimuli are shown here. (c) Video capture from the laser camera illustrating the scan points measured on the ventral prothorax (n=240). (d) Coherence of a series of scans at four different frequencies measured at 55 dB. Typically, coherence across the whole membrane was >0.8.

All experiments were performed on a vibration isolation table (TMC 784-443-12R; Technical Manufacturing Corp., Peabody, MA, USA) in an acoustic isolation booth (IAC series 1204A; Industrial Acoustics, Bronx, NY, USA) at room temperature (24–26°C) and relative humidity of 40–60%. A laser scanning Doppler vibrometer (PSV 300-F; Polytec, Waldbronn, Germany) fitted with an OFV-056 scanning head was used to measure the mechanical vibrations of the prosternum in response to a sound stimulus. The sound stimulus was a broadband frequency sweep comprising 1–30 kHz (80 ms), electronically equalized to provide a flat spectrum (fig. 1b). Sound was generated using an AD/DA card (National Instruments PCI-4452), amplified (TA-FE570; Sony, Tokyo, Japan) and fed into a loudspeaker (ESS AMT-1; ESS Laboratory Inc., Sacramento, CA, USA). The loudspeaker was placed 30 cm from the prosternum so that the measurements took place in the far field (fig. 1a).
A 1/8 inch reference pressure microphone (Bruel & Kjaer, 4138) with a preamplifier (Bruel & Kjaer, 2633) was positioned 10 mm directly above the head of the fly, with its diaphragm parallel to the sound source. A sound calibrator (Bruel & Kjaer, 4231; 1 kHz at 94 dB SPL) was used to calibrate the microphone. The reference sound stimulus level across all frequencies at the tympanum was 54±0.18 dB SPL (mean±S.D.) (ref. SPL=20 μPa) for the majority of experiments. A step attenuator (50BR-009; JFW Industries, Essex, UK) was used to adjust the sound intensity in 3 dB steps between 40–70 dB SPL to assess the intensity response of the prosternum (fig. 1b).
For each animal, a scanning measurement grid of ca. 250 points was generated that covered the entire prosternal area (fig. 1c). This grid accurately and reproducibly defined the position of each point of vibration measurement.
Analysis of laser measurements
Signals from the reference microphone and laser vibrometer were simultaneously sampled at 102.4 kHz by the Polytec PSV300 data management PC. For each measurement point, 20 windows, each 80 ms long, were averaged. Frequency spectra with a resolution of 12.5 Hz were produced by applying a FFT (fast Fourier transform) with a rectangular window. The vibrometer's software (PSV v.7.4 software; Polytec, Waldbronn, Germany) was used to calculate the gain, the phase and the coherence from the laser and microphone signals. The gain was calculated as the transfer function (H 1) of the membrane velocity (ms−1) to the reference sound level (Pa):

where G ab(f) is the cross-spectrum of the reference and velocity signals and G aa(f) is the auto-spectrum of the reference signal. Coherence (C) was used to assess data quality where:
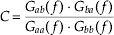
Only reliable data, with a coherence >85% was used. Coherence maps indicated that the data was of high quality over the entire surface of the prothoracic membrane (fig. 1d). Measurements from the individual scan points were collated to produce animations illustrating the deflection of the prosternal area covered.
The mechanical data was examined and analysed further by using a model for a simple harmonic oscillator. The output of the model was fitted to the gain data using Mathematica (v.5.1; Wolfram Research, Champaign, IL), and the fit assessed by calculating the R2 values. Consistently, the model produced a good fit to the gain and phase data at the main sound level used (R2: 0.82±0.12, 54 dB SPL; mean±SD). When lower sound levels were used in the sound intensity experiments, however, the fit of the model was decreased somewhat due to noise (R2: 0.55±0.245, <54 dB SPL; mean±SD). The model parameters were used to calculate the resonance frequency (f o), the quality factor (Q) and the maximum gain (the gain at f o).
Examination of deflection lines
Measurements along a cross-section and animations of the entire prosternal membrane were produced by collating the scan points, enabling the deflection of the membrane to be visualized at specified frequencies. Examination of a cross-section of the prosternal membrane enabled a more detailed analysis of deflections at the attachment points and the comparison of different individuals and different treatments. Cross-sectional deflection lines were constructed along the central fold, traversing the attachment sites and spanning across the entire width of the membrane. The response gain of the deflection line was measured at 30° intervals in the phase cycle, in ten males and ten females, for three different frequencies (3, 6 and 22 kHz). To enable comparison between individuals of different sizes, the distance across each membrane was normalized and each line was resampled to obtain 800 points using LabVIEW (v.8.0; National Instruments, Austin, Texas, USA). The directional response of the membrane was evaluated by taking measurements with the sound source placed ±60° to the membrane. The average gain for each position of the sound source and the difference between them was then calculated and plotted.
Results
Prosternal anatomy
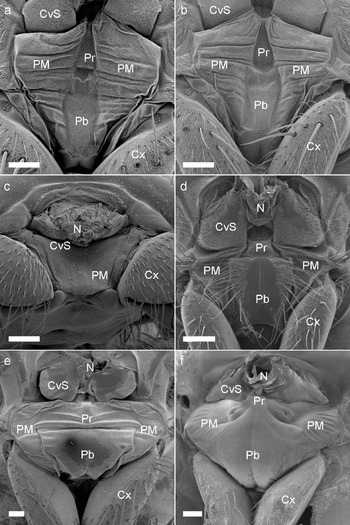
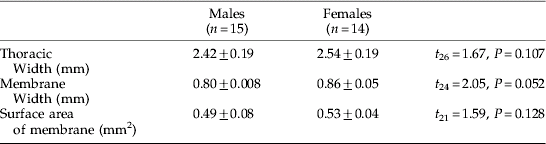
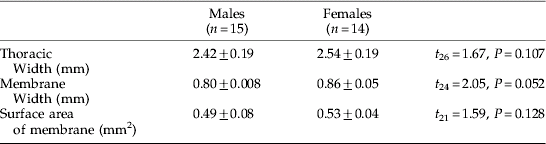
On the anterior prothorax of G. morsitans, a single membrane spans the area between the neck and the prothoracic coxae (Cx) (fig. 2a,b). The prothoracic membrane is characterized by a slightly depressed central vertical strip comprising the presternum (Pr), and ventral to this, the probasisternum (Pb) (fig. 2a,b). The ventral edge of the presternum terminates above a small recess in the membrane. Prosternal membranes (PM) extend laterally from the presternum and probasisternum to the prothoracic coxal joints. The prosternal membranes (PM) are marked by a consistent pattern of horizontal folds. Small striated hairs (approx. 10–20 μm long) cover the entire surface of the prothoracic membrane, but sensory setae are absent (fig. 2a, b). No sexual dimorphism was immediately evident, and closer inspection of G. morsitans revealed no significant difference between the overall area, length and width of male and female prothoracic membranes (table 1).
Scanning electron micrograph images comparing the prosternal anatomy of (a) a female and (b) a male G. morsitans (Glossinidae) with that of (c) the atympanate O. avicularia (Hippoboscidae) and (d) M. domestica (Muscidae) and (e) the tympanate Diptera Emblemasoma sp. (Sarcophagidae) and (f) O. ochracea (Tachinidae). CvS, cervical sclerites; N, neck; PM, prosternal membrane; Pr, presternum; Pb, probasisternum; Cx, prothoracic coxa. Scale bars: 200 μm.

The dimensions of the tsetse membrane (mean±SE) including the results of t-tests comparing male and female measurements.
Interestingly, the prothorax of O. avicularia (fig. 2c), the only other member of the Hippboscoidea examined, was also membranous; but, unlike Glossina spp., it was entirely smooth and featureless. By contrast, in M. domestica (fig. 2d) the sclerites of the prothorax are clearly distinct from one another. The presternum and probasisternum are discrete sclerites, which are separated from the coxae on either side by the prosternal membranes. Large sensory setae are evident on the probasisternum in addition to the small hairs found across the whole prothorax. In comparison, the specialized prothorax in hearing sarcophagid (e.g. Emblemasoma sp.; fig. 2e) and tachinid (e.g. O. ochracea; fig. 2f) flies is inflated and the prosternal sclerites have merged with the prosternal membranes. In both cases, the sensory chordotonal organ has been found to attach to the highly modified presternum. In Emblemasoma sp., the presternum and probasisternum are indistinguishable and the tympanum shows clear medial, horizontal folds. The presternum of O. ochracea forms a distinct ‘n’-shaped structure. The tympanal membrane harbours no sensory setae although small hairs cover the entire structure.
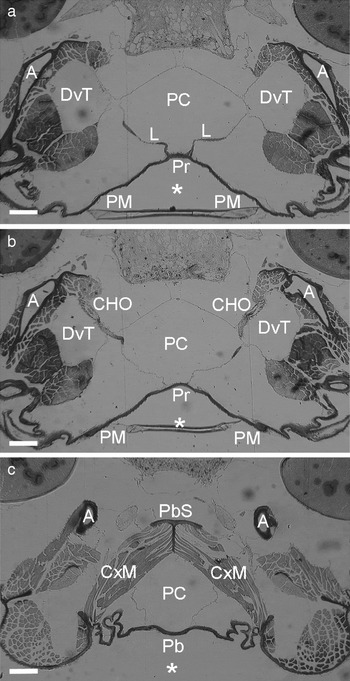
Horizontal sections of the G. morsitans prothorax indicate an undivided prosternal chamber (PC) directly backing the prosternal membranes (membrane thickness: ~15 μm). Dissections of fresh specimens revealed the prosternal chamber to be air-filled and lined by large tracheal sacs (Tuck & Robert, personal observations). Two dorsoventral trachea (DvT) extend through the prothorax, one on each side of the prosternal, unpaired tracheal air sac. A pair of L-shaped chordotonal apodemes (L) (ca. 70 μm apart) attach to the ventral edge of the presternum (fig. 3a). The apodemes run between the membranes of the prosternal chamber and the dorsoventral tracheae and connect to a pair of chordotonal organs (CHO). Basally, the chordotonal organs attach through muscle to a rigid cuticular prosternal apophysis (A) (fig. 3b).
Consecutive light micrographs of horizontal sections through the anterior thorax of G. morsitans, with the dorsalmost in A. Anterior is marked with an asterisk. (a, b) The prosternal membrane (PM) appears sunken and is backed by an air filled prosternal chamber (PC). ‘L-shaped’ apodemes connect the presternum (Pr) to a pair of chordotonal organs (CHO). The chordotonal organs attach basally to a cuticular apopysis (A). (c) More ventrally, a pair of coxal muscles (CxM) attach to a probasisternal support (PbS) originating from an invagination of the probasisternum (Pb) and lie on either side of the prosternal chamber. Scale bars: 100 μm.

The ventral part of the probasisternum extends inwards to form a rigid, T-shaped structure (PbS). Rather than impinge upon or subdivide the prosternal chamber, the probasisternal ridge extends dorsally behind the chamber. A pair of coxal muscles (CxM) attach to the probasisternal ridge and extend around the chamber on either side of it (fig. 3c).
Vibration measurements
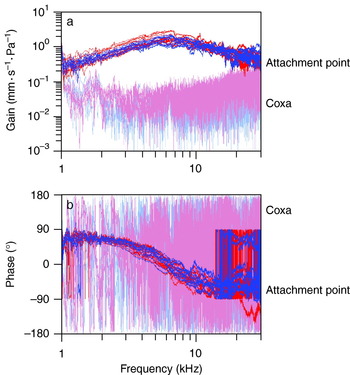
Measurements from the prosternal membranes of ten males and ten females at the attachment point of the chordotonal apodeme (fig. 4a) reveal a mechanical response to sound that contains a clear resonance peak. The resonance is almost critically damped and, within the 20 individuals, the Q factor ranged from 0.66–1.28 (1.01±0.042; mean±SE). The relative phase between stimulus and tympanal velocity shifts from 90° to −90°, crossing 0° at the frequency of resonance (fig. 4b). In contrast, measurements taken on the coxa show very little mechanical response to sound. There is also no characteristic phase change to indicate the presence of a particular resonance.
The (a) gain and (b) phase response of ten male (blue) and female (red) tsetse membrane measured at the base of the presternum (dark) and on the coxa (pale) ( , Female (n=10);
 , Male (n=10).

At the stimulus intensity used (54 dB SPL), the resonant frequency of the membrane ranged between 5300 and 7200 Hz, and there was no significant difference between males (6130±190 Hz; mean±SE) and females (5876±148 Hz; mean±SE) (U=64, N 1=10, N 2=10, P=0.315; Mann-Whitney U Test, two-tailed significance). The maximum gain was slightly higher in females (1.83±0.16 mm⋅s−1Pa−1; mean±SE) compared to males (1.48±0.12 mm⋅s−1Pa−1; mean±SE), but the difference was not statistically significant (U=70, N 1=10, N 2=10, P=0.143; Mann-Whitney U Test, two-tailed significance).
Response to stimulus intensity
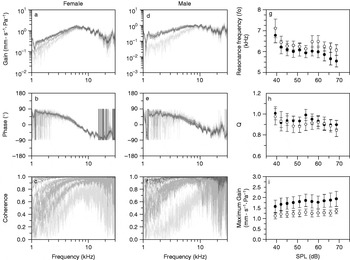
Several insect auditory systems exhibit non-linear responses which enhance their sensitivity and/or selectivity to specific sounds (Göpfert & Robert, Reference Göpfert and Robert2001; Jackson & Robert, Reference Jackson and Robert2006). In order to investigate the linearity of G. morsitans prosternal membrane, the response of the chordotonal attachment point was measured at different sound intensities ranging from 40–70 dB SPL in ten males and ten females. Greater noise can be seen in the gain (fig. 5a,d) and phase functions (fig. 5b,e) taken at low sound levels. This is also reflected by a reduction in the coherence functions (fig. 5c,f), particularly for frequencies of resonance.
The (a, d) gain, (b, e) phase and (c, f) coherence of the attachment point for a female and male. The sound level was increased in 3 dB increments from 40 dB (light grey) to 70 dB (black). The average (g) resonant frequency; (h) quality factor, Q; and (i) maximum gain were calculated for ten males and ten females and plotted against sound intensity (•, Female (n=10); ○, Male (n=10)).

Over the intensity range examined, the average resonant frequency ranged from 5496–6680 Hz for females and 5578–6156 Hz for males. The average maximum gain ranged from 1.45–1.90 mm⋅s−1Pa−1 in females and 1.11–1.30 mm⋅s−1Pa−1 in males. The resonant frequency decreased with increasing sound level, by 11.9 Hz⋅mPa−1 in females and 10.2 Hz⋅mPa−1 in males (fig. 5g). Overall, the gain and Q do not change with stimulus intensity, suggesting that the system behaves linearly within the range investigated.
Deflection shapes
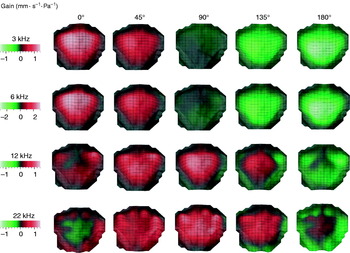
The mechanical response to sound could be measured at many different locations across the entire prothoracic region of the G. morsitans. The measurements were used to produce animations of the deflections of membranous areas at specified frequencies. The displacement of the membrane at four frequencies (3, 6 kHz: near resonance; 12, 22 kHz: off resonance) are shown at 45° phase intervals during a full cycle at the respective frequencies (fig. 6). As indicated by the frequency response spectra, the animations show that membrane displacement is reduced for stimulating frequencies other than 6 kHz (i.e. resonance) (fig. 6; 3–6 kHz). The animations also show that the membrane moves like a circular membrane in a (0, 1) mode (Kreyszig, Reference Kreyszig1999). The maximum displacement occurs at a central region of the membrane around the median presternum. Maximum displacement, thus, occurs at the attachment points of the chordotonal apodeme. At stimulus frequencies higher than resonance, a wave begins at the outside edge and propagates inwards to converge on the presternum and the central presternal region (fig. 6; 12 kHz). For higher stimulus frequencies, a wave progresses from the membrane edge inwards but, then, in contrast with the lower frequencies, dissipates at several different points on the membrane (fig. 6; 22 kHz).
The deflection shapes of a female tsetse prosternal membrane during half a cycle (0–180°) at 45° intervals for four frequencies: 3, 6, 12 and 22 kHz.

Deflection lines of the prosternal membranes
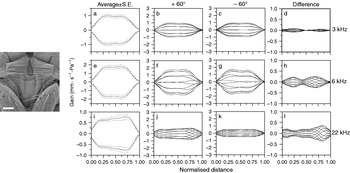
The maximum deflection of a cross-section across the membrane of ten males and ten females was averaged and is shown with standard errors for the three frequencies: 3, 6 and 22 kHz (fig. 7a,e,i). Interestingly, this analysis reveals that, near resonance, the median attachment points move slightly less than the prosternal membranes on either side of it. On average, the difference between the maximum gain and the gain at the attachment point was 0.126±0.023 and 0.251±0.049 mm⋅s−1Pa−1 (mean±SE) for 3 kHz and 6 kHz, respectively.
Inset is an SEM of a male G. morsitans prosternal membrane (scale bar: 200 μm); the dotted line depicts a line of points along which the gain was measured for three frequencies: 3, 6 and 22 kHz. (a, e, i, respectively). The average maximum deflection of the line and the average error is shown for ten males and ten females. The average line deflection of ten males and ten females is shown during a cycle at 30° intervals with the sound stimulus positioned at +60° (b, f, j) and −60° (c, g, k) and the difference between them (d, h, l).

Plots of the membrane's deflection near the resonant frequency (fig. 7b,c,f,g) show that when the sound stimulus is delivered at a ±60° azimuthal angle to the prothorax, the membranes motion is slightly asymmetrical. The difference between the deflections measured at ±60° (fig. 7d,h,l) show that the response at +60° mirrors that at −60° and indicates that the leading side corresponds to the side nearest the sound source. At 3 and 6 kHz, the response of the edge and centre of the membrane appears similar regardless of the sound direction, and this is reflected in the figure-of-eight shape of the difference plots (fig. 7d,h).
At resonance, the position of the sound source had a small effect on the movement of the membrane, especially at 3 kHz (fig. 7d) (3 kHz: 0.0036±0.0012 mm⋅s−1Pa−1; 6 kHz: 0.0536±0.0025 mm⋅s−1Pa−1; 22 kHz: 0.1612±0.0024 mm⋅s−1Pa−1; mean difference at maximum movement±SE). Off resonance, although the membrane moves very little (fig. 7j,k), the position of the loudspeaker has a larger effect (fig. 7l). This is probably due to diffraction effects as the stimulus wavelength (22 kHz; λ ~1.5 cm) is approaching the size of the tsetse's body.
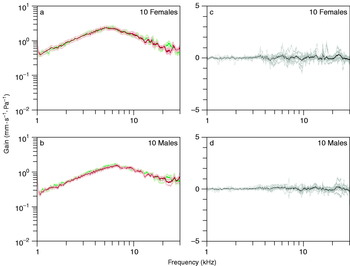
The average gain spectra at the attachment point, when the sound source was moved ±60°, were calculated for ten males and ten females and plotted (fig. 8a,b). The frequency response at the attachment point is unaffected by the position of the loudspeaker, and there was no difference in the resonant frequency (Wilcoxon test: males: N=10, W=11.0, P=0.193; females: N=10, W=20, P=0.813). There was also no statistical difference between the Q (Wilcoxon test: males: N=10, W=41, P=0.185; females: N=10, W=33, P=0.610), and there was a significant difference in the maximum gain for males but not females (Wilcoxon test: males: N=10, W=52, P=0.014; females: N=10, W=47, P=0.053). Any differences between the spectra were not confined to particular frequency bands but were uniform throughout the range investigated (fig. 8c,d).
The average gain spectrum is shown with errors for (a) ten females and (b) ten males with the sound stimulus positioned at +60° (green) and −60° (red). (c, d) The difference between the spectra produced from these two sound source positions ( , 60° Average;
 , 60° Average;
 , −60° S.E.;
 , −60° S.E.;
 , Individuals; —, Average).

Comparing G. morsitans to M. domestica
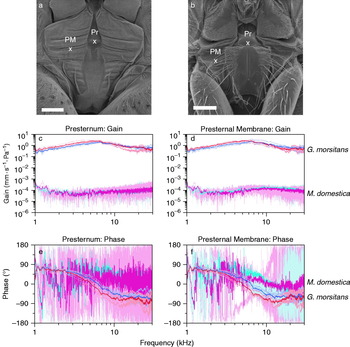
Prosternal membranes, separating the prothoracic coxa from the probasisternum and the presternum, are a common feature in higher Diptera (Edgecomb et al., Reference Edgecomb, Robert, Read and Hoy1995). To compare the mechanical response of the tsetse fly membrane to that of the prosternal membranes in another calypterate fly, additional measurements were made using M. domestica. The response of five male and five female M. domestica, and five male and five female G. morsitans were compared. Laser measurements were made at the base of the presternum (the attachment point of the chordotonal organs in M. domestica) and at the centre of one of the prosternal membranes (fig. 9a,b). As before, the gain and phase for each sex were plotted together for each measurement point.
Scanning electron images of (a) G. morsitans and (b) M. domestica indicating where laser measurements of the presternum (Pr) and the prosternal membrane (PM) were taken. The average (c, d) gain and (e, f) phase of the presternum and prosternal membranes was calculated for five male and five female G. morsitans (dark blue and dark red, respectively) and M. domestica (dark turquoise and dark pink, respectively). Individual measurements are shown in lighter colours. Scale bars: 200 μm ( , Males n=5 (M. domestica);
 , Females n=5 (M. domestica);
 , Males n=5 (G. morsitans);
 , Females n=5 (G. morsitans);
 , Male mean (M. domestica);
 , Female mean (M. domestica);
 , Male mean (G. morsitans);
 , Female mean (G. morsitans)).

The gain measurements of M. domestica are considerably lower (Presternum: 1.15×10⁻⁴±9.49×10⁻⁶ mm⋅s−1Pa−1; Prosternal membrane: 1.11×10⁻⁴±8.85×10⁻⁶ mm⋅s−1Pa−1; mean±SE) than those of G. morsitans (fig. 9c,d). At the presternum, the phase indicates no particular resonances in M. domestica. Interestingly, a phase change between +90° and −90° is seen in M. domestica for measurements made on the prosternal membrane (fig. 9e,f). The phase change is noisy compared to that of G. morsitans because the movements of the prosternal membrane in M. domestica are much smaller (ca. gain 1000 times smaller). The resonant frequency of the prosternal membrane in Musca ranged from 6300–7800 Hz in females (7160±282 Hz; mean±SE) and 5850–10,500 Hz in males (8270±806 Hz; mean±SE).
Discussion
Comparative anatomy
G. morsitans possesses the main morphological elements that earlier investigations of ormiine tachinids and the sarcophagid Emblemasoma sp. suggest are characteristic of a dipteran ear (Robert et al., Reference Robert, Read and Hoy1994, Reference Robert, Miles and Hoy1999). Firstly the entire prosternum is membranous and thinner than the surrounding cuticle, providing a large flexible surface that vibrates independently of the prothoracic coxae. Secondly, the prothoracic tracheal system is modified to produce a large prosternal air sac which apposes the membrane. Thirdly, a pair of mechanosensory chordotonal organs attach to the membrane via stiff apodemes.
Interestingly, previous anatomical studies on both atympanate and tympanate Diptera revealed several pre-adaptive prothoracic structures in atympanate calypterate flies, which may have promoted the formation of a tympanum at this site (Edgecomb et al., Reference Edgecomb, Robert, Read and Hoy1995; Robert et al., Reference Robert, Edgecomb, Read and Hoy1996a). The auditory organs of tympanate Diptera are homologous with a pair of prosternal chordotonal organs in acalypterate (Tephritidae) and calypterate (Sarcophagidae, Tachnidae) flies (Edgecomb et al., Reference Edgecomb, Robert, Read and Hoy1995; Robert et al., Reference Robert, Edgecomb, Read and Hoy1996a), which have been hypothesised to detect substrate or in-flight vibrations (Stölting et al., Reference Stölting, Stumpner and Lakes-Harlan2007). Consistently, in both tympanate and atympanate Schizophora, the prosternal organs attach basally to a cuticular apophysis and apically to the ventral edge of the presternum. In Ormia sp. and Emblemasoma sp., the chordotonal organ is suspended within the tympanal chamber (Robert et al., Reference Robert, Edgecomb, Read and Hoy1996a, Reference Robert, Miles and Hoy1999; Lakes-Harlan et al., Reference Lakes-Harlan, Stölting and Stumpner1999). By contrast, the chordotonal organ of G. morsitans is surrounded by muscle; and its apodemes extend around the prosternal chamber between the membranes of the prosternal chamber and the dorsoventral tracheae, a condition found in atympanate flies (Edgecomb et al., Reference Edgecomb, Robert, Read and Hoy1995). Although Edgecomb et al. (Reference Edgecomb, Robert, Read and Hoy1995) suggested that isolating the chordotonal organ from the fluid haemolymph could reduce vibration-damping, this specialization has not proved essential for the function of all insect ears (Yager, Reference Yager1999; Yack, Reference Yack2004).
Comparative studies also suggest that the tympanal chamber is derived from the medial prosternal trachea that connects the dorsoventral tracheae in atympanate flies (Edgecomb et al., Reference Edgecomb, Robert, Read and Hoy1995; Robert et al., Reference Robert, Edgecomb, Read and Hoy1996a). Although the medial prosternal trachea is enlarged to form a prosternal chamber in calypterate flies, the volume of a tympanal chamber can be increased further by an expansion into the dorsoventral tracheae and by rearrangement of the coxal muscles. In atympanate flies, the coxal muscles attach in direct apposition to the probasisternum (Edgecomb et al., Reference Edgecomb, Robert, Read and Hoy1995; Robert et al., Reference Robert, Edgecomb, Read and Hoy1996a). By contrast, in both Ormia sp. and G. morsitans, the coxal muscles attach to a ridge behind the prosternal chamber and then extend around it, enabling the chamber to expand ventrally.
The membrane on the prosternum of G. morsitans is a most unusual feature as previous comparative investigations suggested that the prosternal condition of M. domestica was common in atympanate Schizophora (Edgecomb et al., Reference Edgecomb, Robert, Read and Hoy1995). Interestingly, however, the Glossinidae and Hippoboscidae inspected here do not conform to this state and instead possess a membranous prothorax. As both these families are members of the Hippoboscoidea, it is possible that the condition arose in a common ancestor to the clade. Unlike Glossina spp., the Hippoboscidae are highly morphologically adapted for an ectoparasitic lifestyle (Petersen et al., Reference Petersen, Meier, Kutty and Wiegmann2007). In O. avicularia, the thorax is flattened and concave where the head inserts so that the ventral prothorax is entirely concealed; the prothoracic membrane could simply be another adaptation that facilitates this conformation. By contrast, the prothoracic membrane of G. morsitans resembles an intermediate between the prothorax of an atympanate fly (e.g. M. domestica) and the tympanal membranes of Ormia sp. and Emblemasoma sp.
The mechanical response
The prothoracic membrane of G. morsitans is thicker (~15 μm) in comparison to the tympanal membranes of Ormia sp. (~1–3 μm: Lakes-Harlan & Heller, Reference Lakes-Harlan and Heller1992; Robert et al., Reference Robert, Read and Hoy1994) and Emblemasoma sp. (~1–2 μm: Robert et al., Reference Robert, Miles and Hoy1999). Laser measurements indicate, however, that the membrane of G. morsitans easily moves in a sound field of moderate intensity (54 dB SPL; sound level of quiet human speech) and, indeed, oscillates significantly more than the prosternal membranes of M. domestica (M. domestica prosternal membrane: 1.11×10⁻⁴±8.85×10⁻⁶ mm⋅s−1Pa−1; G. morsitans prosternal membrane: 1.83±0.16 mm⋅s−1Pa−1; mean±SE). Acoustically, the tsetse membrane was most sensitive to a range of frequencies between 5300 and 7200 Hz. Interestingly, the resonant frequency of the prosternal membranes of Ormia sp. (Robert et al., Reference Robert, Miles and Hoy1996b), Emblemasoma sp. (Robert et al., Reference Robert, Miles and Hoy1999) and M. domestica are all around 5–6 kHz. This similarity suggests that the main frequency response of the membrane is considerably influenced by its material properties. The resonant frequency of a tympanic membrane can, however, be indicative of function, as the known dipteran tympana are tuned to host sounds; and, in Ormia sp., an additional resonance peak enables predator detection (Hoy & Robert, Reference Hoy and Robert1996; Robert et al., Reference Robert, Miles and Hoy1996b, Reference Robert, Miles and Hoy1999).
There was no evidence, either structurally or mechanically, that the membrane of G. morsitans responds directionally to sound stimuli. In Ormia sp. and Emblemasoma sp., directionality is conferred, respectively, by a laterally expanded presternum and a horizontal arrangement of folds on the tympanum (Robert et al., Reference Robert, Miles and Hoy1998, Reference Robert, Miles and Hoy1999). At particular frequencies, the deflection modes of the tachinid and sarcophagid membranes change to maximize the amplitude difference of the sensory insertion points; in effect, causing the side nearest the sound source to move more (Robert et al., Reference Robert, Miles and Hoy1996b, Reference Robert, Miles and Hoy1999). The membrane of G. morsitans is structurally different; the presternum is distinctly unexpanded but the horizontal folds in the prosternal membranes are reminiscent of Emblemasoma sp. Vibration measurements indicate minimal directional differences in the gain of the prosternal membranes; and any small discrepancies probably result from acoustic diffraction, as greater differences are seen with smaller wavelengths. In addition, the central position and proximity of the two sensory insertion points (ca. 70 μm apart) in G. morsitans suggest it is poorly adapted for comparing vibrational differences across the membrane's midline. In this study, however, the vibration measurements were restricted to one plane (perpendicular to the membrane); and it is possible that the tsetse prosternal membrane derives directional information from some other, as yet undescribed, modes of vibration.
Putative function
The membranous tsetse prothorax is an interesting feature, which has been retained despite potential increased vulnerability to puncture and water loss. It is possible that more elasticity between the prothoracic legs could enable the tsetse fly to better resist a sudden impact if swatted during bloodfeeding. Conceivably, the membrane could function in the detection of substrate-borne vibrations via the legs (Cocroft et al., Reference Cocroft, Tieu, Hoy and Miles2000; Stölting et al., Reference Stölting, Stumpner and Lakes-Harlan2007). In this study, we have shown that the prothoracic membrane may potentially also receive air-borne sounds.
Insects use audition to detect the sounds of potential mates, predators, prey and hosts. The diversity of sounds, which tsetse flies encounter in their natural environment, is largely unknown. Interestingly, several species of tsetse flies are documented to produce harmonic sounds with a broad frequency range that in G. morsitans includes peaks at 0.8–1 kHz, 1–2 kHz, 5 kHz and 8 kHz (Saini, Reference Saini1983b). The sounds are produced by both sexes and have been associated with virtually all known tsetse fly behaviours, making it difficult to ascribe them a function. Hence, tsetse sound production has been conjectured to relate to endothermy (Howe & Lehane, Reference Howe and Lehane1986), the rearrangement of organs (Denlinger et al., Reference Denlinger, Saini and Chaudhury1983) and predator deterrence (Saini, Reference Saini1981). Intraspecific communication has also been invoked, the function of which may be to indicate the location of suitable feeding items or sites (Popham et al., Reference Popham, Parr and Chowdhury1977; Saini, Reference Saini1983a), suitable larviposition sites (Denlinger et al., Reference Denlinger, Saini and Chaudhury1983) or the identification of species and/or sex (Erickson & Moller, Reference Erickson and Moller1975; Saini, Reference Saini1985).
Previous researchers contemplating tsetse communication were somewhat hindered as, at the time, only the antenna was envisaged as a potential hearing organ in Diptera (Popham et al., Reference Popham, Parr and Chowdhury1977; Saini, Reference Saini1981). Conversely, without compelling behavioural evidence for acoustic communication and detection in Glossina spp., it would be unwise to conclude whether the prosternal membrane examined here constitutes the tympanum of a hearing organ. Notably, antennae and tympani have very different properties as sound receptors (Yack, Reference Yack2004; Robert & Hoy, Reference Robert, Hoy, North and Greenspan2007). This difference can be exemplified by contrasting the well-known antennal ears of Drosophila species, which detect low frequency courtship emissions in the near-field (Bennet-Clark & Ewing, Reference Bennet-Clark and Ewing1967), with the broad frequency and long range sensitivity of Ormine tympani (Müller & Robert, Reference Müller and Robert2001). Peak frequency variations are reported between different species and sexes of Glossina spp. (Saini, Reference Saini1981) and different behavioural contexts (Saini, Reference Saini1983a; Saini, Reference Saini1985; Denlinger et al., Reference Denlinger, Saini and Chaudhury1983); theoretically, such variations are best detected by tympanal pressure receivers (Robert & Hoy, Reference Robert, Hoy, North and Greenspan2007). Indeed, the correspondence between the mechanical resonance of the prothoracic membrane and the frequency of sound emissions is remarkable and perhaps of functional significance.
The identification of a potential tympanic ear in Glossina spp. facilitates the design of many new experiments and promotes the re-examination of sound production and conspecific communication in this group. Are flies without a functional prothoracic membrane more or less likely to feed, sing or approach a mate? Past research suggested that post-feeding tsetse fly sounds signal the location of a suitable feeding site to other flies (Popham et al., Reference Popham, Parr and Chowdhury1977). A more recent study indicates that acoustic cues are used for communication during the complex copulation process (Briceño et al., Reference Briceño, Eberhard and Robinson2007). Until the work of numerous early studies is readdressed, the possibility of hearing in this species cannot be discounted, and the prothoracic membrane examined in this study cannot be conclusively attributed to a hearing organ. Our results, however, are now instrumental in designing novel experiments to investigate the possible functions of sound production and hearing in the biology of tsetse flies.
Acknowledgements
The authors would like to thank J.C. Jackson, V. Pook, R. Porter and W. Gibson for their invaluable assistance throughout this study. We are also grateful to S. Hallett and R. Rowson of the Bristol City Museum and Art Gallery for the loan of insect specimens. This study was funded by the Biotechnology and Biological Sciences Research Council (BBSRC, UK).